. 2025 Mar 6;74(4):557-570.
doi: 10.1136/gutjnl-2024-333530.

Butyrate-producing Faecalibacterium prausnitzii suppresses natural killer/T-cell lymphoma by dampening the JAK-STAT pathway

Affiliations

Butyrate-producing Faecalibacterium prausnitzii suppresses natural killer/T-cell lymphoma by dampening the JAK-STAT pathway

Zhuangzhuang Shi et al. Gut. .

Abstract

Background: Natural killer/T-cell lymphoma (NKTCL) is a highly aggressive malignancy with a dismal prognosis, and gaps remain in understanding the determinants influencing disease outcomes.

Objective: To characterise the gut microbiota feature and identify potential probiotics that could ameliorate the development of NKTCL.

Design: This cross-sectional study employed shotgun metagenomic sequencing to profile the gut microbiota in two Chinese NKTCL cohorts, with validation conducted in an independent Korean cohort. Univariable and multivariable Cox proportional hazards analyses were applied to assess associations between identified marker species and patient outcomes. Tumour-suppressing effects were investigated using comprehensive in vivo and in vitro models. In addition, metabolomics, RNA sequencing, chromatin immunoprecipitation sequencing, Western blot analysis, immunohistochemistry and lentiviral-mediated gene knockdown system were used to elucidate the underlying mechanisms.

Results: We first unveiled significant gut microbiota dysbiosis in NKTCL patients, prominently marked by a notable reduction in Faecalibacterium prausnitzii which correlated strongly with shorter survival among patients. Subsequently, we substantiated the antitumour properties of F. prausnitzii in NKTCL mouse models. Furthermore, F. prausnitzii culture supernatant demonstrated significant efficacy in inhibiting NKTCL cell growth. Metabolomics analysis revealed butyrate as a critical metabolite underlying these tumour-suppressing effects, validated in three human NKTCL cell lines and multiple tumour-bearing mouse models. Mechanistically, butyrate suppressed the activation of Janus kinase-signal transducer and activator of transcription pathway through enhancing histone acetylation, promoting the expression of suppressor of cytokine signalling 1.

Conclusion: These findings uncover a distinctive gut microbiota profile in NKTCL and provide a novel perspective on leveraging the therapeutic potential of F. prausnitzii to ameliorate this malignancy.

Keywords: BUTYRATE; INTESTINAL MICROBIOLOGY; LYMPHOMA; PROBIOTICS.


Conflict of interest statement

Competing interests: None declared.

Figures

Figure 1
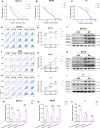
Figure 1. Alterations of gut microbial community in NKTCL patients. (A) Alpha diversity analysis by the Simpson index in the NKTCL (n=30) and HC (n=20) groups of the discovery cohort. P value corresponds to one-tailed Wilcoxon rank sum test. (B) Comparison of intragroup beta diversity, estimated by Bray-Curtis distance, between NKTCL (n=30) and HC (n=20) groups in the discovery cohort. P value corresponds to Wilcoxon rank sum test. (C) PCoA analysis of Bray-Curtis distances at the species level between the HC (n=20) and NKTCL (n=30) groups in the discovery cohort. R2 and FDR-adjusted p values correspond to Adonis test. Comparations of PCoA1 and PCoA2 values between HC and NKTCL groups are shown at the bottom and left of the figure, respectively, and p values correspond to Wilcoxon rank sum test. (D) Marker species between HC (n=20) and NKTCL (n=30) groups identified using LEfSe analysis in the discovery cohort. Blue and red bars represent markers enriched in the HC and NKTCL groups, respectively. Bar lengths indicate the effect size related to species, and marker species with |LDA score|>3.5 are shown. Stars in front of marker species indicate reported butyrate-producing species. (E) Comparison of the relative abundance of marker species identified in (D) across all participants of the discovery cohort (n=50). A paired Wilcoxon rank sum test was used to determine significance between F. prausnitzii (reference group) and other taxa. (F) Relative abundance of F. prausnitzii in HCs (n=20) and NKTCL patients, including the discovery cohort (n=30) and a public Korean NKTCL cohort (NKT_public, n=41). P values correspond to Wilcoxon rank sum test. (G, H) Associations between the abundance of F. prausnitzii and survival outcomes in terms of (G) PFS and (H) OS for NKTCL patients in the discovery cohort (n=30). Patients were divided into F. prausnitzii abundance high and low groups based on a cut-point of 0.01471541 determined by the surv_cutpoint function in the ‘survminer’ R package (V.0.4.9). P values correspond to log-rank test. (I) Relative abundance of F. prausnitzii in HC, ‘good’ and ‘poor’ survival groups in the discovery cohort (n=50). ‘Good’ and ‘poor’ survival groups correspond to F. prausnitzii abundance high and low groups as defined in (G) or (H), respectively. P values correspond to Wilcoxon rank sum test. (J) Relative abundance of F. prausnitzii in HCs (n=33) and NKTCL patients, including both Chinese cohorts (n=42) and the public Korean NKTCL cohort (NKT_public, n=41). P values correspond to Wilcoxon rank sum test. (K, L) Associations between the abundance of F. prausnitzii and survival outcomes in terms of (K) PFS and (L) OS for NKTCL patients in both Chinese cohorts (n=42). P values correspond to log-rank test. (M) Relative abundance of F. prausnitzii in HC, ‘good’ and ‘poor’ survival groups in both Chinese cohorts (n=75). P values correspond to Wilcoxon rank sum test. *p<0.05; **p<0.01; ***p<0.001; ****p<0.0001. See also online supplemental figure S1 and table S4. HCs, healthy controls; LEfSe, LDA effect size; NKTCL, natural killer/T-cell lymphoma; NKT_public, public Korean NKTCL cohort; ns, no significance; OS, overall survival; PCoA, principal coordinate analysis; PFS, progression-free survival.
Figure 2
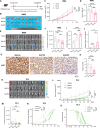
Figure 2. Faecalibacterium prausnitzii (FP) exhibits antitumour effects against NKTCL mouse models. (A) Schematic diagram illustrating FP supplementation in RMA and EL4 tumour-challenged C57BL/6 mice. (B) Display of RMA tumours across different groups: Vehicle (PBS), EC (E. coli MG1655) and FP. Sample size (n)=10 per group. (C) Changes in RMA tumour volume over the course of this experiment (n=10 per group). P values correspond to the Student’s t-test. (D) RMA tumour weights at termination in vehicle, EC and FP groups (n=10 per group). P values correspond to the Student’s t-test. (E) Visualisation of RMA tumours by in vivo imaging system (n=10 per group). (F) Comparison of luminescence intensity in RMA tumour-bearing mice between groups (n=10 per group). P values correspond to the Student’s t-test. (G) Changes in body weight of RMA tumour-challenged mice throughout this experiment (n=10 per group). All p>0.05 between groups, p values correspond to the Student’s t-test. (H) Immunohistochemical staining and (I) evaluation of Ki67 in RMA tumour tissues (n=8 per group). Scale bar=20 µm. P values correspond to Wilcoxon rank sum test. (J) Fluorescent in situ hybridisation targeting FP (green) in the intestinal tract (terminal ileum) of mice across groups. Cell nuclei were stained with DAPI (blue). Scale bar=100 µm. (K) Visualisation of EL4 tumours by in vivo imaging system (n=10 per group). (L) Changes in EL4 tumour volume over the course of this experiment (n=10 per group). P values correspond to the Student’s t-test. (M) Comparison of luminescence intensity in EL4 tumour-bearing mice between groups (n=10 per group). P values correspond to the Student’s t-test. (N) Changes in body weight of EL4 tumour-bearing mice throughout this experiment (n=10 per group). All p>0.05 between groups, p values correspond to the Student’s t-test. (O) Tumour formation and (P) survival rates of mice in the EL4 tumour-challenged model (n=10 per group). P values correspond to log-rank test. The error bars indicate the SD of all the measurements in each group; ns, no significance; *p<0.05; **p<0.01; ***p<0.001. See also online supplemental figure S2–S4. EC, Escherichia coli MG1655; PBS, phosphate-buffered solution.
Figure 3
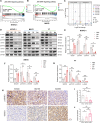
Figure 3. Faecalibacterium prausnitzii culture supernatant suppresses NKTCL through the metabolite butyrate. (A–C) Cell viability of three human NKTCL cell lines: (A) KHYG-1, (B) NKYS and (C) YT, assessed by Cell Counting Kit-8 Assay in response to the treatment of F. prausnitzii culture supernatant (CS) compared with blank culture medium (CM), heat-killed F. prausnitzii (HK), E. coli MG1655 culture supernatant (EC) and PBS controls. Triplicate measurements per group, and p values correspond to the Student’s t-test (CM vs CS). (D, F, H) Representative flow cytometry plots and (E, G, I) quantification of apoptotic cells using FITC-Annexin V/PI kit in response to the treatment of CS compared with CM, HK, EC and PBS controls in the three human NKTCL cell lines. Triplicate measurements per group, and p values correspond to the Student’s t-test (CM vs CS). (J) Volcano plot showing differential metabolites between CS and CM. n=6 biological replicates per group. (K) Total Ion Chromatogram peak chromatogram of targeted short-chain fatty acids analysed by gas chromatography-mass spectrometry for CS, CM and EC. (L) Comparison of the relative abundance of the butyrate synthesis pathway ‘‘pyruvate fermentation to butanoate’’ in HC, ‘good’ and ‘poor’ survival groups in the discovery set (n=50) and both Chinese cohorts (n=75). ‘Good’ and ‘poor’ survival groups correspond to high and low F. prausnitzii abundance as defined in figure 1G,H, respectively. P values correspond to Wilcoxon rank sum test. (M) Butyric acid levels in CS, EC and CM groups detected by gas chromatography-mass spectrometry. n=3 biological replicates per group, and p values correspond to the Student’s t-test. (N) Faecal and (O) plasma butyric acid levels in HC (n=13) and NKTCL (n=12) groups. P values correspond to Wilcoxon rank sum test. (P) Faecal and (Q) plasma butyric acid levels in RMA tumour-bearing mice receiving living F. prausnitzii gavage (n=6 per group). P values correspond to the Student’s t-test. The error bars indicate SD of all the measurements in each group; ns, no significance; *p<0.05; **p<0.01; ***p<0.001; ****p<0.0001. HCs, healthy controls; NKTCL, natural killer/T-cell lymphoma; PBS, phosphate-buffered solution.
Figure 4
Figure 4. Faecalibacterium prausnitzii-derived butyrate restrains proliferation and potentiates apoptosis in NKTCL. (A–C) Cell viability of three human NKTCL cell lines: (A) KHYG-1, (B) NKYS and (C) YT, assessed by Cell Counting Kit-8 Assay in response to sodium butyrate treatments at diverse concentrations and time points (24 hours, 48 hours and 72 hours). Triplicate measurements per group. (D–I) Representative flow cytometry plots and quantification of apoptotic cells in (D, E) KHYG-1, (F, G) NKYS and (H, I) YT cells using FITC-Annexin V/PI kit in response to treatment with various concentrations of sodium butyrate at 24 hours, 48 hours and 72 hours. (J–O) Western blot evaluation of apoptosis-related signalling molecules (Cleaved Caspase-3, Cleaved Caspase-7 and Cleaved Caspase-9) in (J, M) KHYG-1, (K, N) NKYS and (L, O) YT cells treated with sodium butyrate. The error bars indicate SD of all the measurements in each group, and p values correspond to the Student’s t-test. *p<0.05; **p<0.01; ***p<0.001; ****p<0.0001. But, butyrate; NKTCL, natural killer/T-cell lymphoma; PBS, phosphate-buffered solution.
Figure 5
Figure 5. Butyrate attenuates tumour development in two syngeneic tumour-challenged mouse models of NKTCL. (A) Schematic diagram illustrating butyrate administration in RMA and EL4 tumour-challenged C57BL/6 mice. (B) Display of RMA tumours across different groups: vehicle (normal drinking water), But100 (100 mM sodium butyrate drinking) and But300 (300 mM sodium butyrate drinking). Sample size (n)=10 per group. (C) Changes in RMA tumour volume over the course of this experiment (n=10 per group). P values correspond to the Student’s t-test. (D) RMA tumour weights at termination in Vehicle, But100, and But300 groups (n=10 per group). P values correspond to the Student’s t-test. (E) Visualisation of RMA tumours by in vivo imaging system (n=10 per group). (F) Comparison of luminescence intensity in RMA tumour-bearing mice between groups (n=10 per group). P values correspond to the Student’s t-test. (G) Immunohistochemical staining and (H) evaluation of Ki67 in RMA tumour tissues (n=8 per group). Scale bar=20 µm. P values correspond to Wilcoxon rank sum test. (I) Faecal and (J) plasma butyric acid levels in the RMA tumour-bearing mouse model receiving butyrate drinking water measured by gas chromatography-mass spectrometry (n=6 per group). P values correspond to the Student’s t-test. (K) Visualisation of EL4 tumours by in vivo imaging system (n=10 per group). (L) Changes in EL4 tumour volume over the course of this experiment (n=10 per group). P values correspond to Wilcoxon rank sum test. (M) Comparison of luminescence intensity in EL4 tumour-bearing mice between groups (n=10). P values correspond to Wilcoxon rank sum test. (N) Tumour formation and (O) mice survival rates in the EL4 tumour-challenged mouse model (n=10 per group). P values correspond to log-rank test. The error bars indicate the SD of all the measurements in each group. *p<0.05; **p<0.01; ***p<0.001; ****p<0.0001. See also online supplemental figure S5. But100, 100 mM sodium butyrate drinking; But300, 300 mM sodium butyrate drinking; NKTCL, natural killer/T-cell lymphoma.ns, no significance;
Figure 6
Figure 6. Faecalibacterium prausnitzii culture supernatant and butyrate dampen JAK-STAT pathway through escalation of SOCS1. (A) Gene set enrichment analysis (GSEA) of the JAK-STAT signalling pathway in KHYG-1 cells treated with F. prausnitzii culture supernatant (CS). n=3 biological replicates per group. (B) GSEA of the JAK-STAT signalling pathway in NKYS cells treated with butyrate (But). n=3 biological replicates per group. (C) Differential expressions analysis of the SOCS family in RNA sequencing data from KHYG-1 (Left panel) and NKYS (Right panel). Different shapes indicate the direction of enrichment in the CS or butyrate-treated groups, and colours denote different SOCS genes. n=3 biological replicates per group. ‘ns’ represents Q value>0.01. (D) Evaluation of protein levels related to JAK-STAT pathway inhibition in three human NKTCL cell lines. (E–G) Comparison of relative protein expressions related to the JAK-STAT pathway in NKTCL cells, including (E) KHYG-1, (F) NKYS and (G) YT. Triplicate measurements per group, and p values correspond to the Student’s t-test. (H) Immunohistochemical staining and (I, J) evaluation of p-STAT3 and SOCS1 in the RMA mouse model treated with butyrate (n=8 per group). Scale bar=20 µm. p values correspond to Wilcoxon rank sum test. The error bars indicate the SD of all the measurements in each group; *p<0.05; **p<0.01; ***p<0.001. See also online supplemental figure S6. But, butyrate; But100, 100 mM sodium butyrate drinking; But300, 300 mM sodium butyrate drinking; CM, blank culture medium; CS, F. prausnitzii culture supernatant; JAK-STAT, Janus kinase-signal transducer and activator of transcription; PBS, phosphate-buffered solution.
Figure 7
Figure 7. Butyrate inhibits JAK-STAT pathway activation via enhancing histone acetylation at promoter region of SOCS1, rather than activating GPRs. (A) Protein expressions and (B) quantification of Pan-ace-H3 in all three human NKTCL cell lines: KHYG-1, NKYS and YT. Triplicate measurements per group, and p values correspond to Student’s t-test. (C) Immunohistochemical staining and (D) evaluation of Pan-ace-H3 in the RMA mouse model treated with butyrate (n=8 per group). Scale bar=20 µm. P values correspond to Wilcoxon rank sum test. (E–H) Protein-level evaluation showing enhanced histone H3 acetylation and JAK-STAT pathway inhibition in the three human NKTCL cell lines treated by butyrate. P values correspond to the Student’s t-test. (I) Concentration-dependent and (J) time-dependent inhibitions of STAT3 phosphorylation and elevation of histone H3 acetylation levels in NKTCL cells, including KHYG-1, NKYS and YT. (K) Heatmap of ChIP sequencing analysis in NKYS cells showing more genes acetylated near transcription start site in the butyrate-treated group compared with PBS control. n=3 biological replicates per group. (L) Genome tracks of ChIP sequencing for histone 3 lysine 27 acetylation signals for SOCS1 gene loci in different samples. n=3 biological replicates per group. (M) Schematic diagram illustrating the mechanism by which F. prausnitzii exerts an anti-tumour effect on NKTCL. The error bars indicate the SD of all the measurements in each group; *p<0.05; **p<0.01; ***p<0.001; ****p<0.0001. See also online supplemental figure S7. But, butyrate; ChIP, chromatin immunoprecipitation; CM, blank culture medium; CS, F. prausnitzii culture supernatant; HDAC, histone deacetylase; JAK-STAT, Janus kinase-signal transducer and activator of transcription; NKTCL, natural killer/T-cell lymphoma; Pan-ace-H3, acetylated histone H3 (acetyl K4+K9+K14+K18+K23+K27); PBS, phosphate-buffered solution.

References

    1. Wang H, Fu B-B, Gale RP, et al. NK-/T-cell lymphomas. Leukemia. 2021;35:2460–8. doi: 10.1038/s41375-021-01313-2. - DOI - PMC - PubMed
    1. Tse E, Zhao W-L, Xiong J, et al. How we treat NK/T-cell lymphomas. J Hematol Oncol. 2022;15:74. doi: 10.1186/s13045-022-01293-5. - DOI - PMC - PubMed
    1. Lim SH, Hong JY, Lim ST, et al. Beyond first-line non-anthracycline-based chemotherapy for extranodal NK/T-cell lymphoma: clinical outcome and current perspectives on salvage therapy for patients after first relapse and progression of disease. Ann Oncol. 2017;28:2199–205. doi: 10.1093/annonc/mdx316. - DOI - PubMed
    1. Tse E, Kwong YL. Recent Advances in the Diagnosis and Treatment of Natural Killer Cell Malignancies. Cancers (Basel) 2022;14:597. doi: 10.3390/cancers14030597. - DOI - PMC - PubMed
    1. de Vos WM, Tilg H, Van Hul M, et al. Gut microbiome and health: mechanistic insights. Gut. 2022;71:1020–32. doi: 10.1136/gutjnl-2021-326789. - DOI - PMC - PubMed

LinkOut - more resources