. 2025 Jan;22(1):111-126.
doi: 10.1038/s41423-024-01238-7. Epub 2024 Dec 9.

The antitumor activity of TGFβ-specific T cells is dependent on IL-6 signaling

Affiliations

The antitumor activity of TGFβ-specific T cells is dependent on IL-6 signaling

Maria Perez-Penco et al. Cell Mol Immunol. 2025 Jan.

Abstract

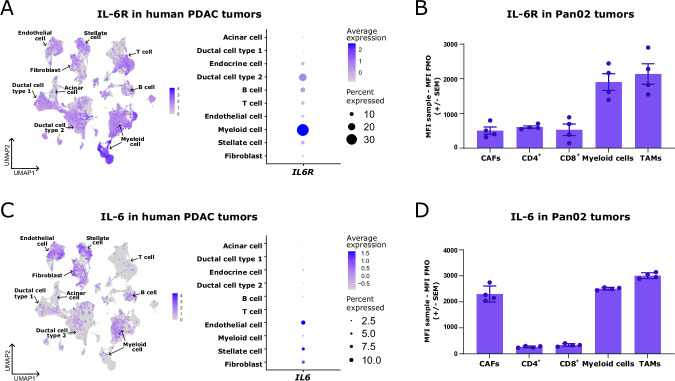
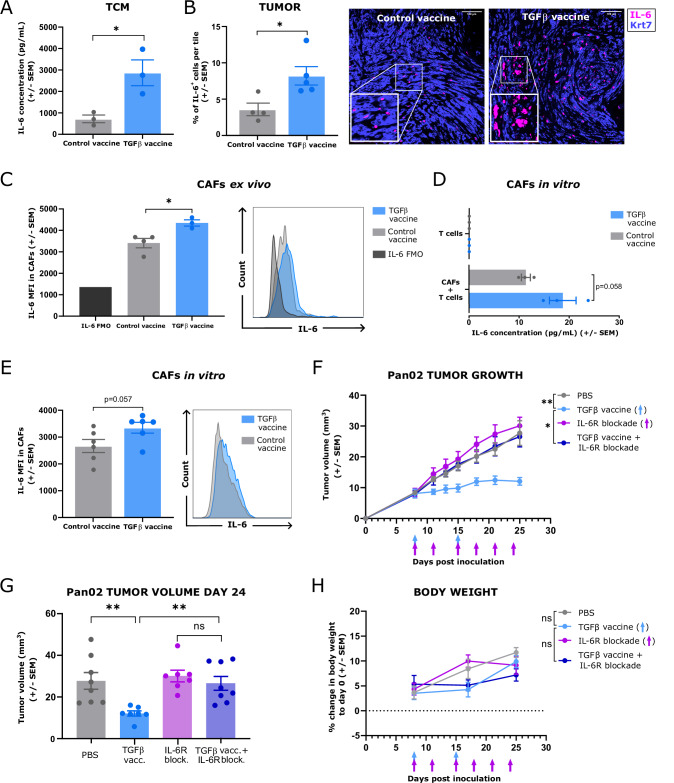
Although interleukin (IL)-6 is considered immunosuppressive and tumor-promoting, emerging evidence suggests that it may support antitumor immunity. While combining immune checkpoint inhibitors (ICIs) and radiotherapy in patients with pancreatic cancer (PC) has yielded promising clinical results, the addition of an anti-IL-6 receptor (IL-6R) antibody has failed to elicit clinical benefits. Notably, a robust TGFβ-specific immune response at baseline in PC patients treated solely with ICIs and radiotherapy correlated with improved survival. Recent preclinical studies demonstrated the efficacy of a TGFβ-based immune modulatory vaccine in controlling PC tumor growth, underscoring the important role of TGFβ-specific immunity in PC. Here, we explored the importance of IL-6 for TGFβ-specific immunity in PC. In a murine model of PC, coadministration of the TGFβ-based immune modulatory vaccine with an anti-IL-6R antibody rendered the vaccine ineffective. IL-6R blockade hampered the development of vaccine-induced T-cells and tumoral T-cell infiltration. Furthermore, it impaired the myeloid population, resulting in increased tumor-associated macrophage infiltration and an enhanced immunosuppressive phenotype. In PC patients, in contrast to those receiving only ICIs and radiotherapy, robust TGFβ-specific T-cell responses at baseline did not correlate with improved survival in patients receiving ICIs, radiotherapy and IL-6R blockade. Peripheral blood immunophenotyping revealed that IL-6R blockade altered the T-cell and monocytic compartments, which was consistent with the findings in the murine model. Our data suggest that the antitumor efficacy of TGFβ-specific T cells in PC depends on the presence of IL-6 within the tumor. Consequently, caution should be exercised when employing IL-6R blockade in patients receiving cancer immunotherapy.

Keywords: IL-6; TGFβ; immunosuppression; tumor microenvironment; vaccines.


Conflict of interest statement

Competing interests: IL is an employee at IO Biotech. IMS has received research funding from Evaxion Biotech, Adaptimmune, IO Biotech, Lytix Biopharma, TILT Biotherapeutics, Enara Bio, and Asgard Biotech. IMS has received consulting fees for MSD, IO Biotech, Novartis, Pierre Fabre, and TILT Biotherapeutics. The IMS has received travel support from the MSD. IMS has received payment or honoraria for lectures, presentations, speakers’ bureaus, manuscript writing, or educational events from MSD, Novartis, Sanofi Aventis, Pierre Fabre, BMS, Novo Nordisk, and Takeda. MD is an advisor of Achilles Therapeutics and has received access to proprietary data from Bristol Myers Squibb and Genentech. IMC has received research funding from Roche, Bristol Myers Squibb, Celgene, Genis, and Varian Medical Systems, AstraZeneca, and Genmab. Travel and accommodation expenses for IMC have been covered by Roche, Bristol Myers Squibb, Celgene, Bayer, and AstraZeneca. The IMC has an advisory role at Amgen, AstraZeneca, and ANOCCA. MHA has developed an invention based on the use of transforming growth factor-β–derived peptides for vaccinations. A patent application directed to the invention is owned by the company IO Biotech ApS and lists the MHA as the sole inventor. MHA is an advisor and shareholder at IO Biotech. The additional authors declare that they have no competing interests.

Figures

Fig. 1
Fig. 1
IL6R is expressed primarily in myeloid cells, whereas IL6 is expressed predominantly by fibroblasts in pancreatic tumors. (A, left) UMAP plot of 136,163 cells from a publicly available single-cell RNAseq atlas of >70 samples from human pancreatic ductal adenocarcinoma (PDAC) [12] showing 10 different clusters (acinar cell, ductal cell type 1, ductal cell type 2, endocrine cell, B cell, T cell, endothelial cell, myeloid cell, stellate cell, and fibroblast) and the expression of IL6R across the different clusters. (A, right) Average normalized expression of IL6R and percentage of IL6R-expressing cells in the different clusters shown in (A, left). (B) IL-6R mean fluorescence intensity (MFI) in cancer-associated fibroblasts (CAFs), CD4+ T cells, CD8+ T cells, myeloid cells, and tumor-associated macrophages (TAMs) in Pan02 tumors from untreated mice. (C, left) UMAP plot of 136163 cells from a publicly available single-cell RNAseq atlas of >70 samples of human PDAC [12] showing the same 10 different clusters described in (A, left) and the expression of IL6 across the different clusters. (C, right). Average normalized expression of IL6 and percentage of IL6-expressing cells in the different clusters shown in (C, left). (D) IL-6 MFI in CAFs, CD4+ T cells, CD8+ T cells, myeloid cells, and TAMs in Pan02 tumors from untreated mice. For (B, D), CAFs were gated as live CD45 CD90.2+ cells. CD4+ T cells were gated as live CD45+ CD3+ CD4+ cells. CD8+ T cells were gated as live CD45+ CD3+ CD8+ cells. Myeloid cells were gated as live CD45+ CD11b+ cells. TAMs were gated as live CD45+ CD11b+ F4/80+ cells. The data are presented as the average ±  SEM. Dots represent individual mice. The IL-6R or IL-6 MFI was calculated by subtracting the MFI in the fluorescence minus one (FMO) control for IL-6R or IL-6 from the MFI in the fully stained sample for each sample
Fig. 2
Fig. 2
The general increase in IL-6 in the tumor microenvironment, and specifically in cancer-associated fibroblasts, induced by the TGFβ vaccine is necessary for the antitumor activity of the vaccine in the Pan02 murine model of pancreatic cancer. (A) Concentration of IL-6 in tumor-conditioned media (TCM) derived from Pan02 tumors from mice that were treated with a control vaccine or with the TGFβ vaccine on days 8 and 15 postinoculation, as quantified by ELISA (n = 3 different batches of TCM). (B, left) Percentage of IL-6+ cells per tile in Pan02 tumors from mice that received either a control vaccine or the TGFβ vaccine (n = 4–5 mice per group), as assessed by immunofluorescence staining for IL-6 (pink) and the cancer cell marker keratin-7 (Krt7, blue). Representative immunofluorescence microscopy images are shown in (B, right). Scale bar = 100 µm. (C, left) Ex vivo mean fluorescence intensity (MFI) of intracellular IL-6 in cancer-associated fibroblasts (CAFs) in the tumors of Pan02 tumor-bearing mice that received either a control vaccine or the TGFβ vaccine, as assessed by flow cytometry (n = 3–4 mice per group). The mice were treated with a control vaccine or the TGFβ vaccine on days 8 and 15 postinoculation. The IL-6 MFI was assessed on day 25 post-inoculation. (C, right) Representative histograms of intracellular IL-6 expression in the CAFs shown in (C, left). (D) Concentration of IL-6 in the supernatants of a coculture of CAFs sorted from KPC pancreatic tumors that were cultured at a 1:20 fibroblast: T-cell ratio for 48 h with T cells isolated from the spleens of mice that received two shots, one week apart, of either a control vaccine or the TGFβ vaccine, as assessed by ELISA (n = 3 per group). (E, left) In vitro MFI of intracellular IL-6 in CAFs from the coculture described in (D), as assessed by flow cytometry (n = 6 per group). (E, right) Representative histograms of intracellular IL-6 expression in the CAFs shown in (E, left). For (C, E), CAFs were gated as live CD45 CD90.2+ cells. For (AE), the data are presented as the means ± SEMs. Dots represent individual mice. (F) Pan02 tumor growth in mice treated with PBS, the TGFβ vaccine, an anti-IL-6R blocking antibody, or the combination of both the TGFβ vaccine and an anti-IL-6R blocking antibody. The TGFβ vaccine was administered subcutaneously (s.c.) in the flank on days 8 and 15 postinoculation. PBS or the anti-IL-6R blocking antibody (200 µg/mouse) was administered s.c. next to the tumor on day 8 postinoculation and every 3rd–4th day for a total of six injections. The data are representative of 4 independent experiments and are presented as the means ± SEMs. (G) Pan02 tumor volume on day 24 post-inoculation for the different treatment groups shown in (F). The data are shown as the means ± SEMs. Dots represent individual mice. (H) Changes in body weight over time in Pan02 tumor-bearing mice across the different treatment groups shown in (F). The data are presented as the means ± SEMs. For (FH), (n = 7–8 mice per group). ns, not significant; *p < 0.05 and **p < 0.01 according to unpaired two-tailed t-test for (AE, G) and according to TumGrowth software [42] for (F, H)
Fig. 3
Fig. 3
IL-6 signaling blockade hampers the development of CD4+ vaccine-specific T cells and impairs T-cell infiltration in tumors. (A) Specific IFNγ response against the pool of TGFβ-derived peptides that constitute the TGFβ vaccine in the spleen of Pan02 tumor-bearing mice that were treated with PBS, the TGFβ vaccine, IL-6R blockade or the combination of the TGFβ vaccine and IL-6R blockade, as described in Fig. 2, as assayed by IFNγ ELISpot at the endpoint (day 25 postinoculation). (BE) Specific IFNγ response against the individual peptides that constitute the TGFβ vaccine: (B) mTGFb-18-32, (C) mTGFb-215-223, (D) mTGFb-282-289 and (E) mTGFb-334-342 in the spleens of Pan02 tumor-bearing mice across the different treatment groups, as assayed by IFNγ ELISpot at the endpoint. For (AE), a representative example of IFNγ ELISpot responses can be found at the bottom of each panel. n = 6 mice per group. (FL) Characterization of T-cell subsets in Pan02 tumors from mice that were treated with PBS, the TGFβ vaccine, IL-6R blockade, or the combination of the TGFβ vaccine and IL-6R blockade, as described in Fig. 2, as assayed by flow cytometry at the endpoint (day 25 postinoculation). Bar plots showing (F) T cells gated as CD45+ CD3+; (G) CD4+ T cells gated as CD45+ CD3+ CD4+; (H) CD8+ T cells gated as CD45+ CD3+ CD8+ and (I) regulatory T cells (Tregs) gated as CD45+ CD3+ CD4+ Foxp3+ CD25+ as a percentage of live cells; (J) PD1+ T cells; (K) PD1+ CD4+ T cells and (L) PD1+ CD8+ T cells as a percentage of the parent gate. All populations were gated on single live cells. For (FL), representative contour plots can be found on the right of each panel. n = 5 mice per group. The data in (AL) are presented as the means ± SEMs. Dots represent individual mice. ns, not significant; *p < 0.05 and **p < 0.01 according to the unpaired two-tailed t test. The data are representative of 3 independent experiments
Fig. 4
Fig. 4
Disruption of IL-6 signaling in the tumor results in a greater abundance of tumor-infiltrating myeloid cells, higher levels of tumor-associated macrophages, an increase in their suppressive phenotype, and a reduction in the proinflammatory TAM subset. (A, left) Percentages of myeloid cells (gated as live, CD45+ CD3 CD11b+ cells) among CD45+ cells in the tumors of Pan02 tumor-bearing mice that were treated with PBS, the TGFβ vaccine, IL-6R blockade, or the combination of the TGFβ vaccine and IL-6R blockade, as described in Fig. 2, were assayed via flow cytometry. (A, right) Representative contour plots for the data shown in (A, left). (B, left) Percentage of tumor-associated macrophages (TAMs) among CD45+ cells across treatment groups. TAMs were gated as live CD45+ CD3 CD11b+F4/80+ cells. (B, right) Representative contour plots for the data shown in (B, left). (C, left) Percentages of MHC-II+ TAMs among total TAMs across treatment groups. (C, right) Representative histograms for MHC-II expression for the data shown in (C, left). For (AC), the data are presented as the means ± SEMs. Dots represent individual mice. Data were collected at the endpoint (day 25 post-inoculation). (D) UMAP displaying the meta clusters identified via the FlowSOM unsupervised clustering algorithm in the Cytobank platform on the live CD45+ CD3 population of 18 samples (n = 4–6 mice per group) identified via flow cytometry and assessed at the endpoint (day 25 postinoculation). (E) Heatmap showing the normalized expression by column of CD11b, F4/80, mannose receptor (MR), arginase-1 (ARG1), MHC-II, programmed death-ligand 1 (PD-L1) and CD8a using the Z score across the six different metaclusters identified in the FlowSOM analysis shown in (D). (F) Frequencies of the six different metaclusters identified in the FlowSOM analysis across treatment groups. The data are presented in a box-and-whisker plot. n = 4–6 mice per group. (G) Representative UMAPs of a sample derived from a mouse treated with the TGFβ vaccine and a sample derived from a mouse treated with both the TGFβ vaccine and an anti-IL-6R antibody, showing how the metaclusters identified via FlowSOM changed between the treatment groups. (H) ARG1 mean fluorescence intensity (MFI) in the six metaclusters identified via FlowSOM across treatment groups. The data are presented in a box-and-whisker plot. n = 4–6 mice per group. (I) Representative UMAPs of a sample derived from a mouse treated with the TGFβ vaccine and a sample derived from a mouse treated with both the TGFβ vaccine and an anti-IL-6R antibody, displaying the ARG1 MFI for metacluster 2. (J) Correlation between the percentage of T cells of total CD45+ cells and the percentage of TAMs of total CD45+ cells in Pan02 tumors. (KM) Correlations between the percentage of T cells of total CD45+ cells and the frequencies of (K) metacluster 1, (L) metacluster 4, and (M) metacluster 6 as a percentage of the total. For (JM), the dots represent individual mice. n = 4–6 mice per group. The treatment groups are color-coded. Correlations were performed with data collected at the endpoint (day 25 postinoculation). ns, not significant; *p < 0.05 and **p < 0.01 according to an unpaired two-tailed t-test for (AC, F, H) and linear regression for (JM)
Fig. 5
Fig. 5
Changes in intratumoral gene expression induced by IL-6R blockade are associated mainly with myeloid migration and immunity, as well as with T-cell inhibition. (A) Volcano plot showing differentially expressed genes in Pan02 tumors from mice treated with an anti-IL-6R blocking antibody compared with those in tumors from untreated mice (n = 3–4 per group). n = 161 upregulated genes and n = 161 downregulated genes. (B) Volcano plot showing differentially expressed genes in Pan02 tumors from mice treated with the TGFβ vaccine in combination with an anti-IL-6R blocking antibody compared with those in tumors from mice treated with the TGFβ vaccine as monotherapy (n = 3 per group). n = 134 upregulated genes and n = 246 downregulated genes. For (A, B) False discovery rate (FDR) < 0.05 and absolute log2-fold-change > 0.585. (C) Venn diagram showing the overlap in the lists of differentially upregulated genes described in (A, B). A total of 28 genes were identified as differentially upregulated genes in both comparisons. (D) Gene Ontology (GO) enrichment analysis for biological processes associated with the 28 significantly upregulated genes described in (C). The 66 GO terms related to cancer immunity, of a total of 93 identified GO terms, are shown. The GO terms are classified into 10 different categories. (E) Enrichment map of the 66 GO terms related to cancer immunity showing five functional modules: 1) myeloid and lymphoid cell chemotaxis and phagocytosis, 2) myeloid immunity, 3) immune activation and B-cell function, 4) the extracellular matrix, and 5) metabolism signaling. (F) Mean normalized enrichment scores for monocytes and macrophages across treatment groups inferred via cell type deconvolution analysis (n = 3-4 mice per group). (G) Volcano plot showing differentially expressed genes in Pan02 tumors from mice treated with the TGFβ vaccine in combination with an anti-IL-6R blocking antibody compared with those in tumors from mice treated with the TGFβ vaccine as a monotherapy, where Ccl6, Ccl8, Ccl9, and Pf4 are highlighted. (H) Volcano plot showing differentially expressed genes in Pan02 tumors from mice treated with the TGFβ vaccine in combination with an anti-IL-6R blocking antibody compared with those in tumors from mice treated with the TGFβ vaccine as a monotherapy, where Alox12e and Fcer1a are highlighted. I (left) Pie chart displaying the percentage of T-cell-related GO terms (n = 3) of total cancer immunity-related GO terms (n = 144) identified in the GO enrichment analysis for biological processes associated with the 161 upregulated genes identified in the differential gene expression analysis comparing tumors from mice that received IL-6R blockade to those from untreated mice. GO terms unrelated to cancer immunity (n = 49) were excluded from the data visualization. (I, right) T-cell-related GO terms identified in the GO enrichment analysis described in (I, left). (J, left) Volcano plot showing differentially expressed genes in Pan02 tumors from mice treated with an anti-IL-6R blocking antibody compared with those in tumors from untreated mice, where Arg1 is highlighted. (J, right) Expression levels were assessed by RNA-seq and are presented as VST-normalized counts of Arg1 in Pan02 tumors across treatment groups. The data are presented as the means ± SEMs. The dots represent individual mice (n = 3–4 per group)
Fig. 6
Fig. 6
Patients with pancreatic cancer with high TGFβ-specific immunity at baseline do not benefit from immune checkpoint inhibitors and radiotherapy if IL-6R blockade is added to the treatment regimen. (A) Number of specific T-cell responses to the peptide TGFβ-15 per 2.5×10⁵ peripheral blood mononuclear cells (PBMCs) from patients in the TRIPLE-R study (n = 25 patients), as assayed via IFNγ ELISpot. The median IFNγ response for the CheckPAC study (50 spots) is shown. Dots represent individual patients. (B) Kaplan‒Meier curve of overall survival (OS) for patients in the CheckPAC study treated with radiotherapy and both immune checkpoint inhibitors (ipilimumab and nivolumab) with high (n = 13 patients) and low (n = 4 patients) TGFβ-15-specific T-cell responses and for patients in the TRIPLE-R study with high (n = 10 patients) and low (n = 12 patients) TGFβ-15-specific T-cell responses. Survival analysis for all patients in the CheckPAC trial on the basis of TGFβ-15-specific immunity at baseline was previously published [9]. Here, we assessed survival on the basis of TGFβ-15-specific immunity at baseline only for patients in the CheckPAC trial who received radiotherapy, nivolumab, and ipilimumab to enable comparison with those in the TRIPLE-R trial. (C) Kaplan‒Meier curve of progression-free survival (PFS) for the patients described in (B). For (B, C), statistical significance was calculated via a log-rank test. (D) Number of specific T cells against a tetanus-derived peptide per 2.5 × 105 PBMCs from patients in the TRIPLE-R study with high (n = 10 patients) and low (n = 15 patients) TGFβ-15-specific T-cell responses. The data are presented in a box-and-whisker plot, with dots representing individual patients. *p < 0.05 according to an unpaired two-tailed t-test. (E) Percentages of CD3+ cells, CD4+ T cells and CD8+ T cells of live cells in PBMCs at baseline and 8 weeks post-treatment initiation for patients who were treated with both immune checkpoint inhibitors (ipilimumab and nivolumab) and who had a high TGFβ-15-specific T-cell response at baseline in the CheckPAC trial (n = 10 patients) and for patients with a high TGFβ-15-specific T-cell response at baseline in the TRIPLE-R trial (n = 9 patients). (F) Percentages of the following monocytic metaclusters: CD14+ CD16 HLA-DR (HLA-DR classical monocytes), CD14+ CD16 HLA-DRmid (HLA-DRmid classical monocytes), CD14+ CD16+ HLA-DRhi (monocytes in an intermediate state) and CD14 CD16+ (nonclassical monocytes) of total live cells in PBMCs at baseline and 8 weeks post-treatment initiation for the patients described in (E). For (E, F), the data are presented in a box-and-whisker plot, with dots representing individual patients and *p < 0.05 according to a paired two-tailed t-test. Characterization of human PBMCs via flow cytometry at baseline and 8 weeks posttreatment (w8) was performed on all patients from whom PBMCs were available at both timepoints (n = 10 patients for the CheckPAC trial and n = 9 for the TRIPLE-R trial)

References

    1. Hunter CA, Jones SA. IL-6 as a keystone cytokine in health and disease. Nat Immunol. 2015;16:448–57. - PubMed
    1. Orange ST, Leslie J, Ross M, Mann DA, Wackerhage H. The exercise IL-6 enigma in cancer. Trends Endocrinol Metab. 2023;34:749–63. - PubMed
    1. Fisher DT, Appenheimer MM, Evans SS. The two faces of IL-6 in the tumor microenvironment. Semin Immunol. 2014;26:38–47. - PMC - PubMed
    1. Kjaergaard AD, Chen IM, Johansen AZ, Nordestgaard BG, Bojesen SE, Johansen JS. Inflammatory biomarker score identifies patients with sixfold increased risk of one-year mortality after pancreatic cancer. Cancers. 2021;13:4599. - PMC - PubMed
    1. Tsukamoto H, Fujieda K, Senju S, Ikeda T, Oshiumi H, Nishimura Y. Immune-suppressive effects of interleukin-6 on T-cell-mediated anti-tumor immunity. Cancer Sci. 2018;109:523–30. - PMC - PubMed