. 2025 Jan;22(1):97-110.
doi: 10.1038/s41423-024-01242-x. Epub 2024 Dec 9.

Esophageal ILC2s mediate abnormal epithelial remodeling in eosinophilic esophagitis via Areg-EGFR signaling

Affiliations

Esophageal ILC2s mediate abnormal epithelial remodeling in eosinophilic esophagitis via Areg-EGFR signaling

MinYeong Lim et al. Cell Mol Immunol. 2025 Jan.

Abstract

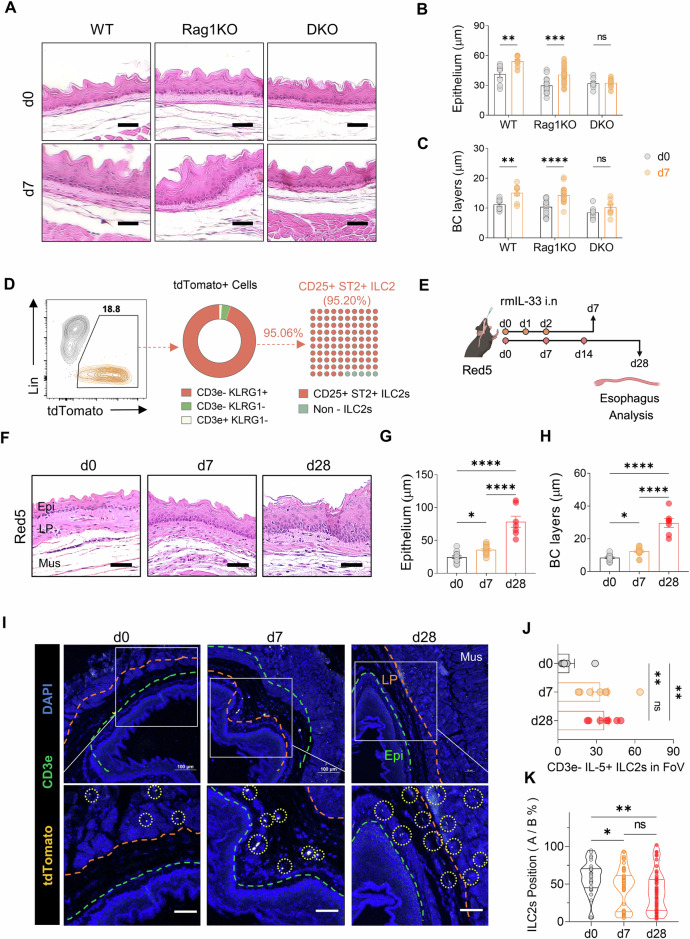
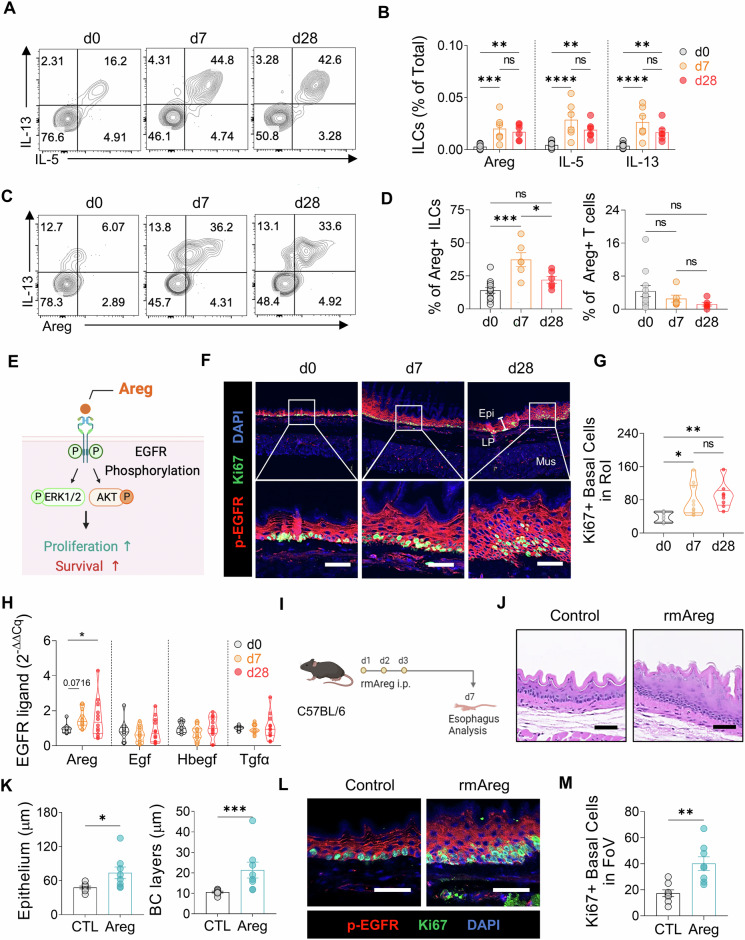
Eosinophilic esophagitis (EoE) is a chronic allergic disorder characterized by eosinophilia and epithelial thickening, resulting in dysphagia. While emerging evidence implicates increased frequencies of group 2 innate lymphoid cells (ILC2s) and increased interleukin (IL)-33 expression in EoE pathogenesis, the precise mechanisms remain unclear. In this study, we investigated the role of ILC2s in EoE pathogenesis. We observed an abundance of KLRG1+ ILC2s in the esophagi of healthy mice, with their numbers significantly increasing in murine EoE models and humans. Using a murine EoE model, we demonstrated the recapitulation of EoE-associated features, including basal-cell hyperproliferation, epithelial thickening, and eosinophilia. Notably, these characteristics are absent in ILC-deficient mice, whereas mice lacking IL-5 or eosinophils display epithelial defects, highlighting the pivotal role of ILC2s in EoE pathogenesis. Further investigations revealed increased amphiregulin (Areg) production by esophageal ILC2s in mice. The administration of Areg induced epithelial defects similar to those observed in EoE. Mechanistic studies using human esophageal cell lines revealed Areg-induced phosphorylation of epidermal growth factor receptor (EGFR). Significatntly, treatment with anti-Areg agents and EGFR inhibitors effectively attenuated EoE development, highlighting the therapeutic potential of targeting the Areg-EGFR axis.

Keywords: Allergic disorder; Amphiregulin (Areg); Eosinophilic esophagitis (EoE); Epidermal growth factor receptor (EGFR); Epidermal hyperplasia; Innate lymphoid cells (ILCs).


Conflict of interest statement

Competing interests: The authors declare no competing interests.

Figures

Fig. 1
Fig. 1
Characterization of ILCs in the mouse esophagus and human EoE patients. A Schematic representation of mouse esophageal and lung immune cells analyzed via flow cytometry. B FACS plots showing ILCs in esophageal (orange) and lung (green) tissues. C Comparison of transcription factor expression in total esophageal and lung ILCs. D Frequencies of ILCs in the esophagus and lung. FACS plots (E) and frequencies (F) of cytokine-producing ILCs in the esophagus and lung. G Comparison of surface molecules in total esophageal and lung CD25ST2+ ILC2s (gray: fluorescence minus one control (FMO)). H Frequencies of CD90.2, ICOS, KLRG1, and SCA1+ ILC2s in total esophageal and lung CD25+ ST2+ ILC2s. I Study design for human esophageal biopsies analyzed via immunofluorescence. J Number of ILCs detected in patients with esophageal diseases. K Representative immunofluorescence images from healthy controls and GERD and EoE patients (KLRG1: magenta; CD3e: green; and DAPI: blue). The white arrows indicate CD3+ T cells, whereas the orange arrows indicate KLRG1+ ILC2s. Scale bars = 50 µm. The data were pooled from at least 2‒3 independent experiments and are presented as the means ± SEMs. *P ≤ 0.05, **P ≤ 0.01, ***P ≤ 0.001, ****P ≤ 0.0001, ns, not significant
Fig. 2
Fig. 2
IL-33-induced EoE is characterized by eosinophilia, epithelial hyperplasia, and increased number of esophageal ILCs. A Schematic representation of acute and chronic EoE. B H&E-stained sections of control (d0), acute (d7), and chronic (d28) EoE mouse esophagi. Scale bars = 50 µm. (Epi: epithelium, LP: lamina propria, Mus: muscle). Quantification of epithelial thickness (C) and basal cell layer thickness (D) in EoE model mice. E Immunohistochemistry images of major basic protein 1 (MBP1)+ cells in EoE mouse esophagi. Flow cytometry plots showing eosinophils (F) and frequencies of esophageal eosinophils (G) in the acute and chronic EoE mouse models. Comparison of CCR3+ eosinophils in acute and chronic EoE. Histogram (H) and CCR3 gMFI from eosinophils (I). J Comparison of CCR3-associated chemokine gene expression in whole esophageal tissues with EoE. Analysis of CCR3-associated chemokine gene expression (K) and epithelium-associated gene expression (L) in IL-33-overexpressing mouse esophageal public RNA sequencing data. Flow cytometry plots (M) and frequencies (N) of esophageal-resident ILCs. O Schematic representation of acute EoE in eosinophil-deficient dblGATA1 mice. P Representative H&E-stained sections of control and acute EoE from dblGATA1 mice. Quantification of epithelial thickness (Q) and basal cell layer thickness (R) in dblGATA1 EoE model mice. All scale bars = 50 µm. The data were pooled from at least 2‒3 independent experiments and are presented as the means ± SEMs. *P ≤ 0.05, **P ≤ 0.01, ***P ≤ 0.001, ****P ≤ 0.0001, ns, not significant
Fig. 3
Fig. 3
KLRG1+ ILC2 accumulation near the esophageal epithelium and promotion of epithelial thickening during EoE development. A H&E-stained sections of control and acute EoE from WT, Rag1KO, and DKO mice. Epithelial (B) and basal cell layer thickness (C) quantification in acute EoE model mice. D Flow cytometry analysis of tdTomato+ cells using ILC2 markers (KLRG1, CD25, and ST2) and T cells (CD3e) in Red5 (IL-5 tdTomato reporter, IL-5 deficient) mice. E Schematic representation of acute and chronic EoE in Red5 mice. F Representative H&E-stained sections showing control, acute, and chronic EoE in Red5 mice. Quantification of epithelial thickness (G) and basal layer thickness (H) in EoE-induced Red5 mice. I Immunofluorescence images of esophageal tdTomato+ immune cells in control, acute, and chronic EoE mice (yellow: IL-5 tdTomato; green: CD3e; blue: DAPI). The orange line denotes the boundary between the muscle and lamina propria; the green line indicates the boundary between the lamina propria and epithelium (Epi: epithelium; LP: lamina propria; Mus: muscle). J Quantification of CD3eIL-5+ ILC2s in the region of uncropped original images (x200) of control, acute, and chronic EoE esophagus. K Localization of CD3eIL-5+ ILC2s. All scale bars = 50 µm. The data were pooled from 2–3 independent experiments and are presented as the means ± SEMs. *P ≤ 0.05, **P ≤ 0.01, ***P ≤ 0.001, ****P ≤ 0.0001, ns, not significant
Fig. 4
Fig. 4
Areg expression by ILC2s in EoE development and its role in epithelial thickness and basal cell hyperplasia. A Representative flow cytometry plots of IL-5- and IL-13- producing esophageal ILCs. B Frequencies of IL-5- and IL-13-producing esophageal ILCs. C Flow cytometry analysis showing Areg production by esophageal ILCs. D Frequencies of Areg-producing esophageal ILCs (left) or CD4+ T cells (right). E Schematic illustration of the Areg-EGFR signaling cascade. F Immunofluorescence image analysis of the epithelium in the control, acute, and chronic EoE groups (red: p-EGFR; green: Ki67; blue: DAPI). (Epi: epithelium, LP: lamina propria, Mus: muscle). G Quantification of Ki67+ basal cells in the region of uncropped original images (magnification x200). H Comparison of the gene expression of EGFR ligands during EoE. I Schematic diagram of the intraperitoneal injection of recombinant murine Areg (rmAreg) in mice. J H&E-stained esophageal sections from control and rmAreg-treated mice. K Quantification of the esophageal epithelium (left) and basal cell layer (right) thickness in rmAreg-treated mice. L Immunofluorescence analysis of epithelial and basal cell hyperplasia in control and rmAreg-treated mice (red: p-EGFR; green: Ki67; blue: DAPI). M Quantification of Ki67+ basal cells in uncropped images of rmAreg-injected mice (magnification ×200). All scale bars = 50 µm. The data were compiled from at least 2‒3 independent experiments and are presented as the means ± SEMs. *P ≤ 0.05, **P ≤ 0.01, ***P ≤ 0.001, ****P ≤ 0.0001, ns, not significant
Fig. 5
Fig. 5
Areg-mediated stimulation of esophageal epithelial cell proliferation via the Areg-EGFR signaling pathway. A Schematic representation of the EGFR signaling pathway and the experimental design for EGF and Areg treatment of human esophageal epithelial cell lines (CP-A and HET-1A). B Total viable cell counts of CP-A and HET-1A cells treated with rmEGF (10 ng/ml) and rmAreg (100 ng/ml) for 3 days. C, D Western blotting (C) and densitometry quantification (D) of EGFR phosphorylation and downstream pathway activation induced by EGF and Areg in CP-A cell lines. E, F Western blotting (E) and densitometry quantification (F) of EGF- or Areg-treated HET-1A cells. G Experimental scheme for erlotinib (EGFR tyrosine kinase inhibitor) treatment of the CP-A and HET-1A cell lines. H Total viable counts of CP-A and HET-1A cells treated with rmAreg (100 ng/ml) for 3 days in the presence or absence of erlotinib (200 ng/ml). I Western blot analysis of EGFR phosphorylation and activation of downstream pathways (ERK1/2 and AKT) induced by Areg in CP-A and HET-1A cells treated with or without erlotinib. The data were pooled from at least 2‒3 independent experiments and are presented as the means ± SEMs. *P ≤ 0.05, **P ≤ 0.01, ***P ≤ 0.001, and ****P ≤ 0.0001; ns, not significant
Fig. 6
Fig. 6
Epithelial remodeling and inflammation in EoE are attenuated by blockade of Areg-EGFR signaling. A Experimental design for the in vivo administration of αAreg and erlotinib to C57BL/6 mice with acute EoE. B H&E-stained sections showing the esophagus of control and acute EoE mice treated with or without αAreg and erlotinib. C Immunofluorescence image analysis of the esophageal epithelium and basal cell hyperplasia in EoE mice following EGFR signaling blockade (red: p-EGFR; green: Ki67; blue: DAPI, X200). D Quantification of Ki67+ basal cells in the uncropped original images of (C). E Schematic representation of mouse esophageal organoid and ILC2 coculture. F Frequencies of Sox2+ and Ki67+ basal cells. G Representative phase contrast images of the esophageal epithelial organoids in each group, along with quantification of organoid diameter. Scale bars = 50 µm. H Immunofluorescence image analysis of the esophageal epithelium and basal cell hyperplasia in EoE from WT, Rag1KO, and DKO mice (red: p-EGFR; green: Ki67; blue: DAPI, X200). I Quantification of Ki67+ basal cells in the uncropped original images of (H). The data were pooled from at least 2‒3 independent experiments and are presented as the means ± SEMs. *P ≤ 0.05, **P ≤ 0.01, ***P ≤ 0.001, and ****P ≤ 0.0001; ns, not significant
Fig. 7
Fig. 7
Amphiregulin from ILC2s in human EoE patients. A Differential expression of AREG among ILC2s, Tregs, and Th2 cells, with adjusted P values indicated by the dot color, expression levels represented by the dot size (y-axis), and fold change shown on the x-axis. B Proportions of cells expressing key markers (KLRG1, GATA3, and IL1RL1) across different immune cell types in patients with EoE. C Proportion of epithelial cells expressing marker genes in EoE patients. All processed gene count matrices and embeddings were derived from EoE patient data (healthy: n = 12; remission: n = 11; active: n = 14). D Study design for human esophageal biopsies, including healthy controls (n = 6), GERD patients (n = 10), and EoE patients (n = 22) from two cohorts. E Representative immunohistochemistry analysis of p-EGFR (blue: nuclei; DAB brown: p-EGFR). Scale bar = 50 µm. F Immunofluorescence images from healthy controls, GERD patients, and EoE patients (Amphiregulin: Orange; KLRG1: Magenta; CD3e: Green; Hoechst: Blue). The green arrows indicate CD3+ T cells, whereas the orange arrows indicate KLRG1+ ILC2s. Scale bar = 20 µm. The data were pooled from at least 2‒3 independent experiments and are presented as the means ± SEMs. *P ≤ 0.05, **P ≤ 0.01, ***P ≤ 0.001, and ****P ≤ 0.0001; ns, not significant

References

    1. Dellon ES, Hirano I. Epidemiology and natural history of eosinophilic esophagitis. Gastroenterology. 2018;154:319–32.e3. - PMC - PubMed
    1. Muir A, Falk GW. Eosinophilic esophagitis: a review. JAMA. 2021;326:1310–8. - PMC - PubMed
    1. Mulder DJ, Justinich CJ. Understanding eosinophilic esophagitis: the cellular and molecular mechanisms of an emerging disease. Mucosal Immunol. 2011;4:139–47. - PubMed
    1. Davis BP, Stucke EM, Khorki ME, Litosh VA, Rymer JK, Rochman M, et al. Eosinophilic esophagitis-linked calpain 14 is an IL-13-induced protease that mediates esophageal epithelial barrier impairment. JCI Insight. 2016;1:e86355. - PMC - PubMed
    1. DeWard AD, Cramer J, Lagasse E. Cellular heterogeneity in the mouse esophagus implicates the presence of a nonquiescent epithelial stem cell population. Cell Rep. 2014;9:701–11. - PMC - PubMed

MeSH terms