. 2024 Dec;30(12):3624-3633.
doi: 10.1038/s41591-024-03283-1. Epub 2024 Dec 9.

Data-driven cluster analysis identifies distinct types of metabolic dysfunction-associated steatotic liver disease

Affiliations

Data-driven cluster analysis identifies distinct types of metabolic dysfunction-associated steatotic liver disease

Violeta Raverdy et al. Nat Med. 2024 Dec.

Abstract

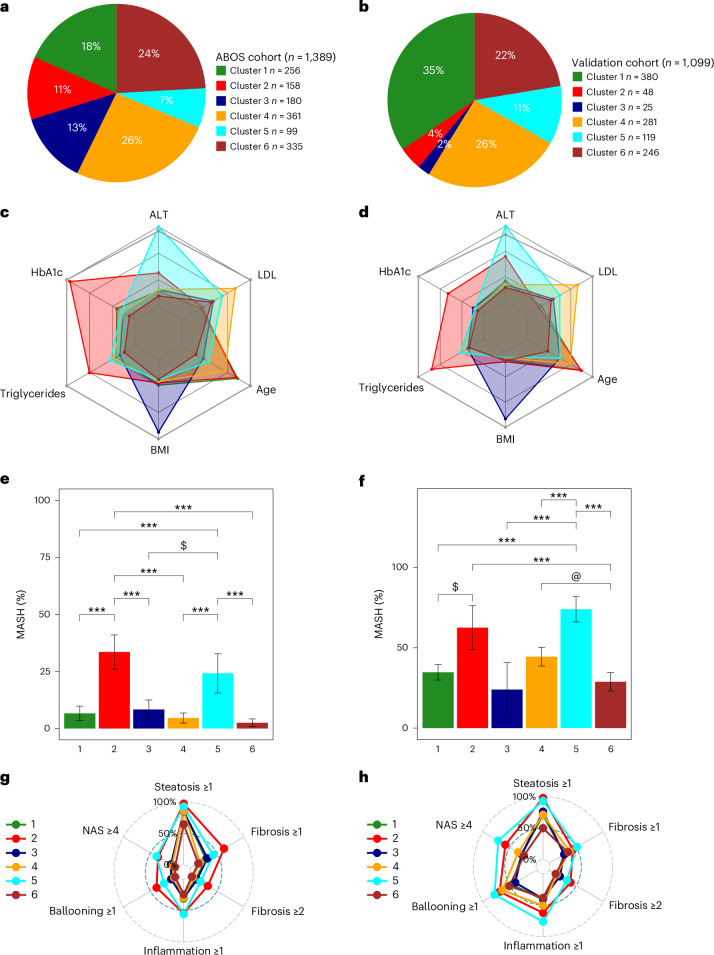
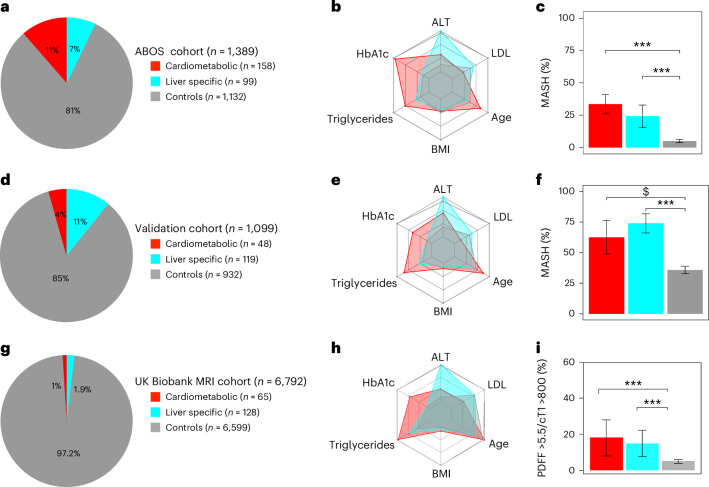
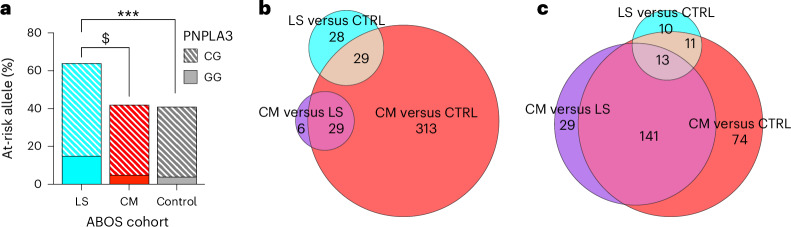
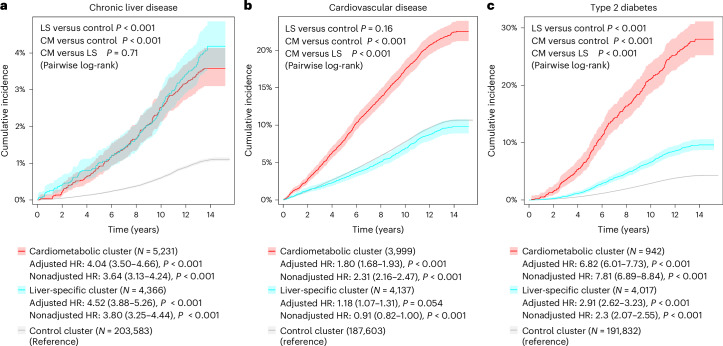
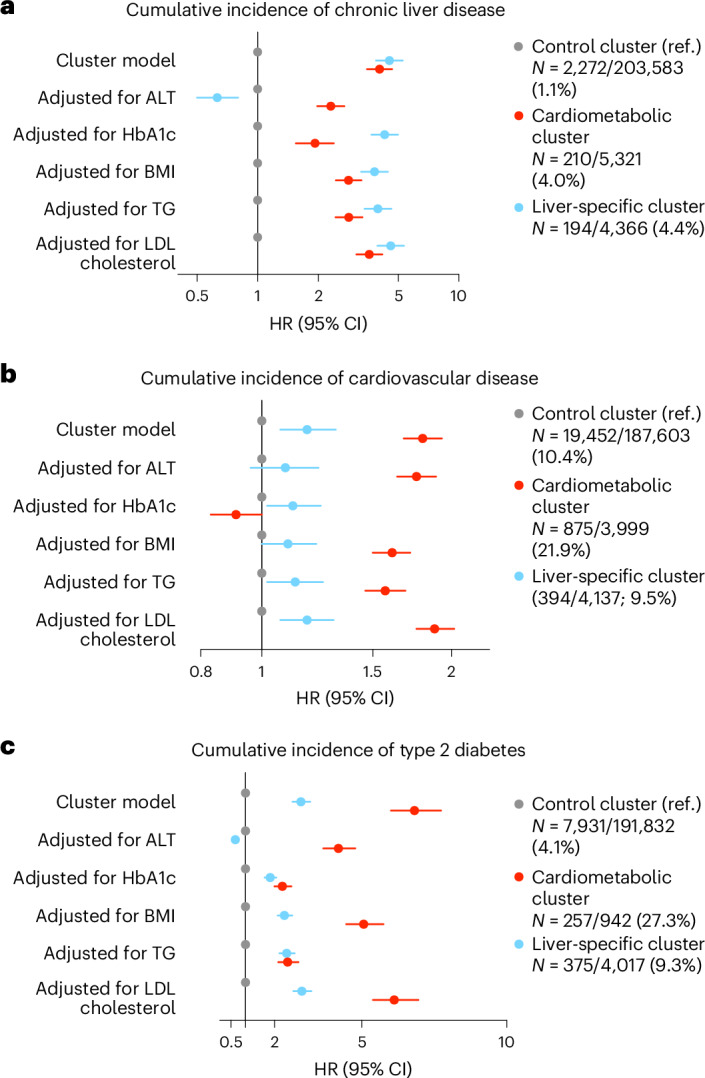
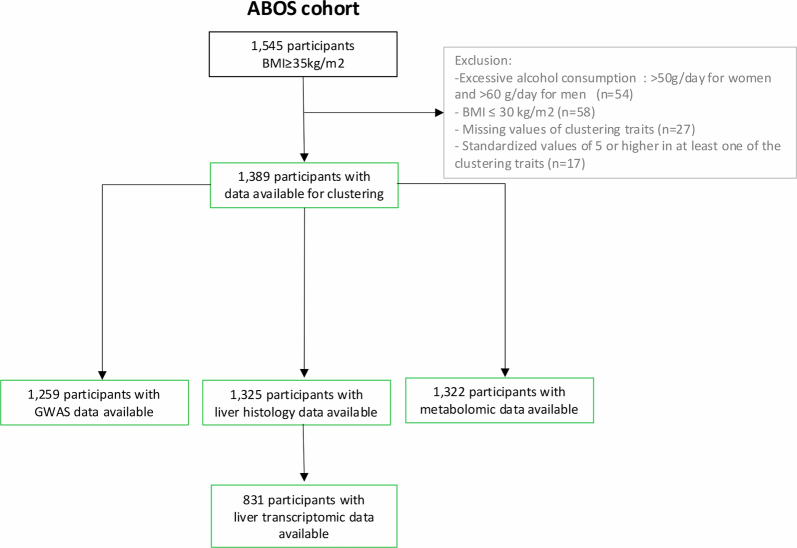
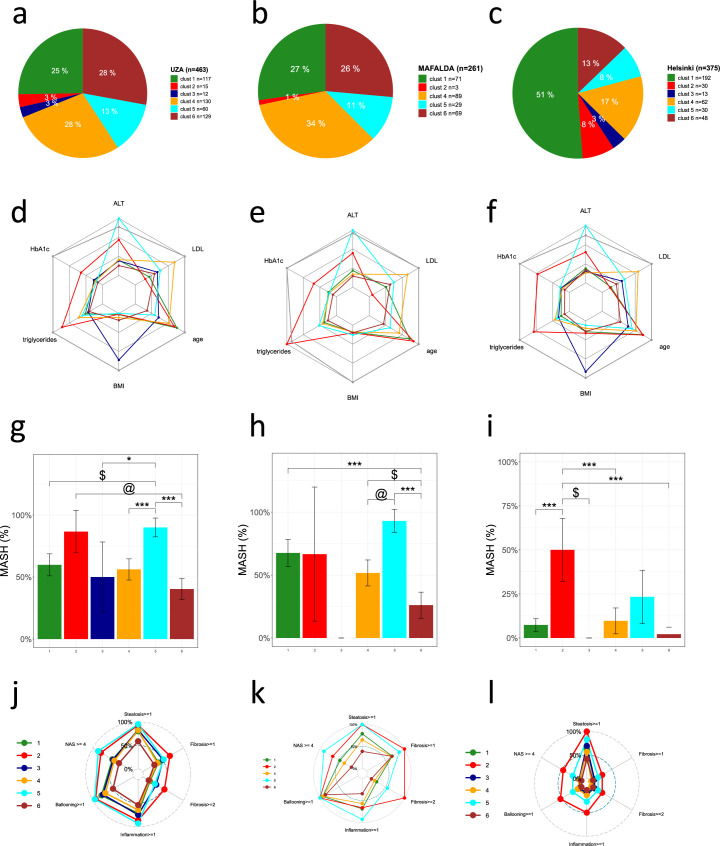
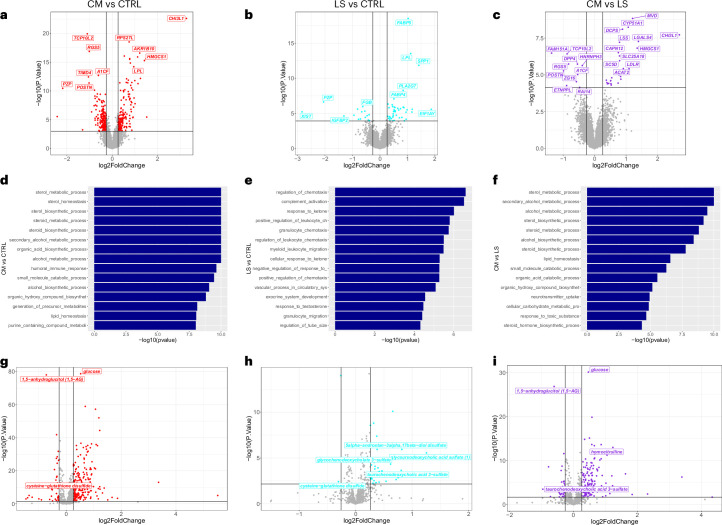
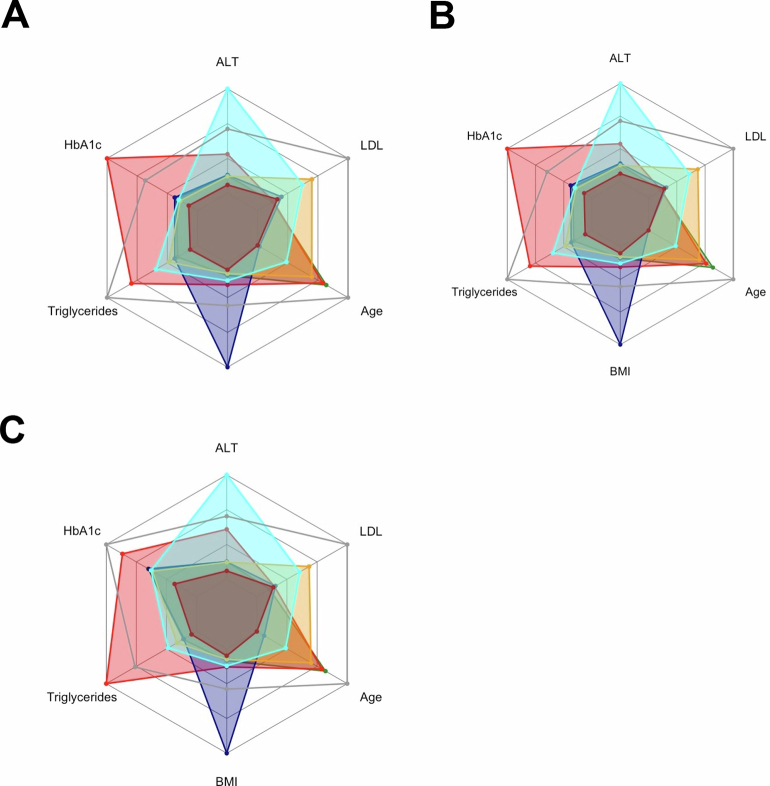
Metabolic dysfunction-associated steatotic liver disease (MASLD) exhibits considerable variability in clinical outcomes. Identifying specific phenotypic profiles within MASLD is essential for developing targeted therapeutic strategies. Here we investigated the heterogeneity of MASLD using partitioning around medoids clustering based on six simple clinical variables in a cohort of 1,389 individuals living with obesity. The identified clusters were applied across three independent MASLD cohorts with liver biopsy (totaling 1,099 participants), and in the UK Biobank to assess the incidence of chronic liver disease, cardiovascular disease and type 2 diabetes. Results unveiled two distinct types of MASLD associated with steatohepatitis on histology and liver imaging. The first cluster, liver-specific, was genetically linked and showed rapid progression of chronic liver disease but limited risk of cardiovascular disease. The second cluster, cardiometabolic, was primarily associated with dysglycemia and high levels of triglycerides, leading to a similar incidence of chronic liver disease but a higher risk of cardiovascular disease and type 2 diabetes. Analyses of samples from 831 individuals with available liver transcriptomics and 1,322 with available plasma metabolomics highlighted that these two types of MASLD exhibited distinct liver transcriptomic profiles and plasma metabolomic signatures, respectively. In conclusion, these data provide preliminary evidence of the existence of two distinct types of clinically relevant MASLD with similar liver phenotypes at baseline, but each with specific underlying biological profiles and different clinical trajectories, suggesting the need for tailored therapeutic strategies.


Conflict of interest statement

Competing interests: The authors declare no conflicts of interest related to this manuscript.

Figures

Fig. 1
Fig. 1. Characteristics of the six data-driven clusters in the ABOS cohort and in the validation cohort.
a,b, The distribution of data-driven clusters in the ABOS cohort (a) and the validation cohort (b). c,d, Radar charts representing the median values of age, BMI, HbA1c, LDL, triglycerides and ALT for each cluster in the ABOS cohort (n = 1,389) (c) and the validation cohort (n = 1,099) (d). The dark gray line represents the 95th percentile observed in the ABOS cohort. e,f, Bar plots representing the proportion of patients with MASH at histology in the ABOS cohort (n = 1,325) (e) and the validation cohort (n = 1,099) (f). Statistical tests used include either a chi-squared test or Fisher’s exact test, both two-sided with Bonferroni correction. Significance levels are indicated as follows: ***P < 0.001, $ indicates P = 0.011 (e); $ indicates P = 0.0052, @ indicates P = 0.0046, ***P < 0.001 (f). g,h, Radar charts represent the proportion of patients with NAS ≥4, steatosis grade ≥1, lobular inflammation grade ≥1, ballooning grade ≥1, and fibrosis stage ≥1 and ≥2 for each cluster in the ABOS cohort (g) and the validation cohort (h).
Fig. 2
Fig. 2. Characteristics of the three clusters across the ABOS cohort, validation cohort and UK Biobank.
ai, Characteristics of the liver-specific, cardiometabolic and control clusters in the ABOS cohort (ac), in the validation cohort (df) and in the UK Biobank (gi). In a, d and g, the distribution of data-driven clusters is presented. The radar charts represent the median values of age, BMI, HbA1c, LDL, triglycerides and ALT for each cluster in the ABOS cohort (b), validation cohort (e) and UK Biobank (h). The dark gray line represents the 95th percentile observed in the ABOS cohort. The bar plots represent the proportion of patients with MASH at histology in the ABOS cohort (n = 1325) (c) and the validation cohort (n = 1,099) (f), or at-risk MASH on MRI in the UK Biobank (n = 6,792) (i). Statistical tests used include either a chi-squared test or Fisher’s exact test, both two-sided with Bonferroni correction. Significance levels are indicated as follows: ***P < 0.001 (c); $ P = 0.0011, ***P < 0.001 (f); ***P < 0.001 (i). cT, iron-corrected T1; adj-p, adjusted P value.
Fig. 3
Fig. 3. Genotype distribution of the PNPLA3 rs738409 C > G stratified by clusters in the ABOS cohort and UK Biobank and differential hepatic gene expression and plasma metabolomics across clusters in the ABOS cohort.
a, Genotype distribution of the PNPLA3 rs738409 C > G stratified by clusters in the ABOS cohort. The bar graph shows the percentages of homozygotes (GG) and heterozygotes (CG) patients at risk across liver-specific (LS), cardiometabolic (CM) and control clusters. Statistical tests were chi-squared test or Fisher exact test as appropriate, two-sided with Bonferroni correction. Significance levels are indicated as follows: $ indicates P = 0.0079, ***P < 0.001. b,c, Differential hepatic gene expression and plasma metabolomics across clusters. The Euler diagrams illustrate the differential gene expression in liver tissue (b) and plasma metabolomics (c), across the three clusters: cardiometabolic (CM), liver-specific (LS) and control (CTRL). The sizes of the areas in the Euler diagram are proportional to the number of differentially expressed features they represent.
Fig. 4
Fig. 4. Cumulative incidence of chronic liver disease, cardiovascular disease and type 2 diabetes across clusters in the prospective UK Biobank.
ac, Cumulative incidence of chronic liver disease (a), cardiovascular disease (b) and type 2 diabetes (c) across clusters in the prospective UK Biobank. In each panel, the lines represent the cumulative incidence in the different clusters (cardiometabolic (CM) in red, liver-specific (LS) in blue and control in gray), with the shaded area representing 95% CI. HRs with 95% CIs and corresponding P value were calculated by Cox proportional hazards models for cardiometabolic (in red) and liver-specific (in blue) clusters versus control cluster (in gray), adjusted for age, sex and alcohol intake (g per day). Survival curves were compared using the pairwise log-rank test, with Holm correction.
Fig. 5
Fig. 5. Added value of the clustering model to predict cumulative incidence of chronic liver disease, cardiovascular disease and type 2 diabetes, among UK Biobank participants.
ac, Added value of the clustering model to predict cumulative incidence of chronic liver disease (a), cardiovascular disease (b) and type 2 diabetes (c), among UK Biobank participants. Multivariable analyses evaluating the predictive value of the clustering model adjusted for age/sex/alcohol, independently of each additional individual variable, are included in the clustering. TG, triglycerides. The dots represent the HR estimates, and the error bars represent the 95% CIs.
Extended Data Fig. 1
Participant flowchart for the ABOS cohort.
Extended Data Fig. 2
Extended Data Fig. 2. Cluster characteristics in UZA, MAFALDA and HELSINKI cohorts.
Distribution of data-driven clusters: UZA (a), MAFALDA (b), and HELSINKI (c). Radar charts representing the median values of age, BMI, HbA1c, LDL, triglycerides and ALT in UZA (d), MAFALDA (e), and HELSINKI (f). The dark gray line represents the 95th percentile of the ABOS cohort. Bar plots represent the proportion of patients with MASH in: UZA (g), MAFALDA (h), and HELSINKI (i). Radar charts represent the proportion of patients with NAS ≥ 4, steatosis grade ≥1, lobular inflammation grade ≥1, ballooning grade ≥1, fibrosis stage ≥ 1 and ≥2 in: UZA (j), MAFALDA (k), and HELSINKI (l). Statistical tests used include either a Chi-squared test or Fisher’s exact test, both two-sided with Bonferroni correction. Significance levels are indicated as follows: (g) * p = 0,0496; @ p = 0.0253, $ p = 0.0011, *** p < 0.001; (h) $ p = 0.0202; @ p = 0.0016, *** p < 0.001; (i) $ p = 0.0196,*** p < 0.001. Abbreviations: ALT, alanine aminotransferase; BMI, body mass index; HbA1c, hemoglobin A1c; LDL, low-density lipoprotein cholesterol.
Extended Data Fig. 3
Extended Data Fig. 3. Differential Liver Gene Expression, Pathway Enrichment, and Plasma Metabolomics Across Cardiometabolic and Liver-Specific Clusters.
Upper volcano plots illustrate the comparative liver gene expression in (a) the cardiometabolic cluster (CM; n = 97) vs control cluster (CTRL; n = 671), (b) the liver-specific cluster (LS; n = 63) vs control cluster, and (c) the cardiometabolic cluster vs liver-specific cluster. Horizontal and vertical lines represent adjusted p-value with Benjamin Hochberg correction (0.05) and log2FoldChange (0.26) significance thresholds respectively. Bar plots representing Gene Ontology Biological Processes (GO-BP) enrichment analysis for differentially expressed genes in the liver between (d) the cardiometabolic cluster (CM; n = 97) vs the control cluster (CTRL; n = 671), (e) the liver-specific cluster (LS; n = 63) vs the control cluster, and (f) the cardiometabolic cluster vs the liver-specific cluster. Graphs were generated using the GSEA enrichment method from the R package clusterProfiler. Lower volcano plots illustrate the comparative metabolomics in (g) cardiometabolic cluster (CM; n = 151) vs control cluster (CTRL; n = 1076), (h) liver-specific cluster (LS; n = 95) vs control cluster, and (i) cardiometabolic cluster vs liver-specific cluster. Horizontal and vertical lines represent adjusted p-value of 0.05 with Benjamini-Hochberg correction and log2FoldChange (0.26) significance thresholds respectively. The statistical tests are based on Limma’s linear model, performing a two-sided moderated t-test for each variable. P-values are adjusted for multiple comparisons using the Benjamini-Hochberg method to control the False Discovery Rate (FDR).
Extended Data Fig. 4
Extended Data Fig. 4. Distribution of clustering variables in the UK Biobank cohort.
Distribution of clustering variables in the various subpopulations used for analyzing cumulative incidences of (a) liver outcome (n = 213,180), (b) cardiovascular disease (n = 195,739), and (c) type 2 diabetes (n = 196,791), in the UK Biobank cohort. Radar charts represent the median values of age, BMI, HbA1c, LDL, triglycerides, and ALT for each cluster. The dark gray line represents the 95th percentile observed in the ABOS cohort. ALT, alanine aminotransferase; BMI, body mass index; HbA1c, hemoglobin A1c; LDL, low-density lipoprotein cholesterol.

References

    1. Rinella, M. E. et al. A multi-society Delphi consensus statement on new fatty liver disease nomenclature. Hepatology78, 1966–1986 (2023). - PubMed
    1. Rinella, M. E. et al. AASLD Practice Guidance on the clinical assessment and management of nonalcoholic fatty liver disease. Hepatology77, 1797–1835 (2023). - PMC - PubMed
    1. Younossi, Z. M. et al. The global epidemiology of nonalcoholic fatty liver disease (NAFLD) and nonalcoholic steatohepatitis (NASH): a systematic review. Hepatology77, 1335–1347 (2023). - PMC - PubMed
    1. Romeo, S., Sanyal, A. & Valenti, L. Leveraging human genetics to identify potential new treatments for fatty liver disease. Cell Metab.31, 35–45 (2020). - PubMed
    1. Kantartzis, K. & Stefan, N. Clustering NAFLD: phenotypes of nonalcoholic fatty liver disease and their differing trajectories. Hepatol. Commun.7, e0112 (2023). - PMC - PubMed

MeSH terms