. 2024 Dec;30(12):3614-3623.
doi: 10.1038/s41591-024-03284-0. Epub 2024 Dec 9.

Partitioned polygenic risk scores identify distinct types of metabolic dysfunction-associated steatotic liver disease

Affiliations

Partitioned polygenic risk scores identify distinct types of metabolic dysfunction-associated steatotic liver disease

Oveis Jamialahmadi et al. Nat Med. 2024 Dec.

Erratum in

Abstract

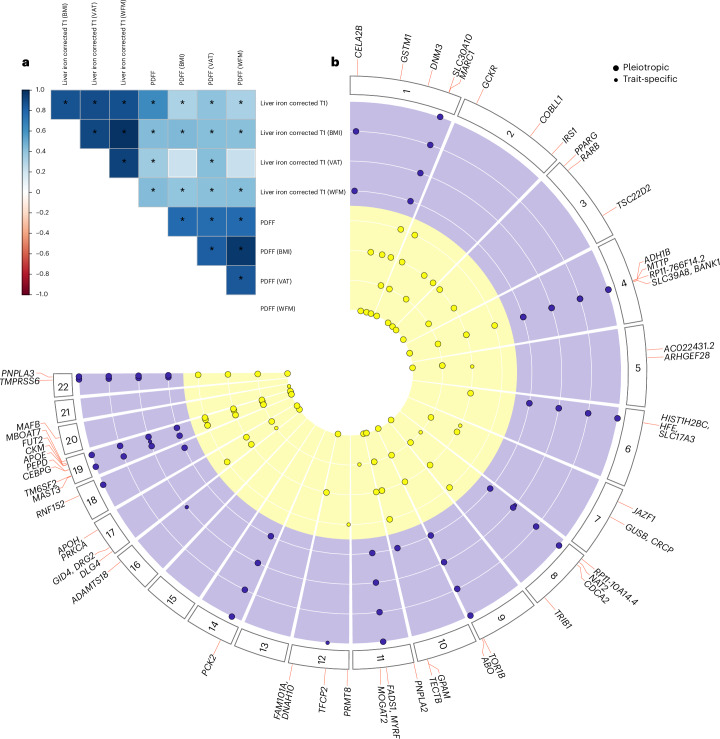
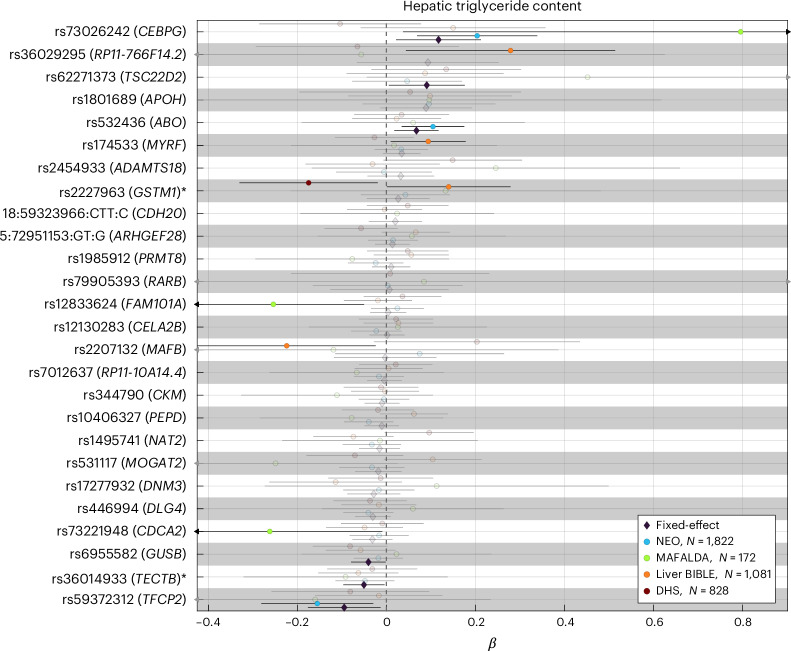
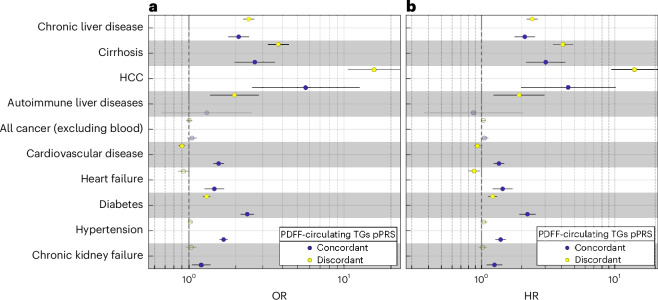
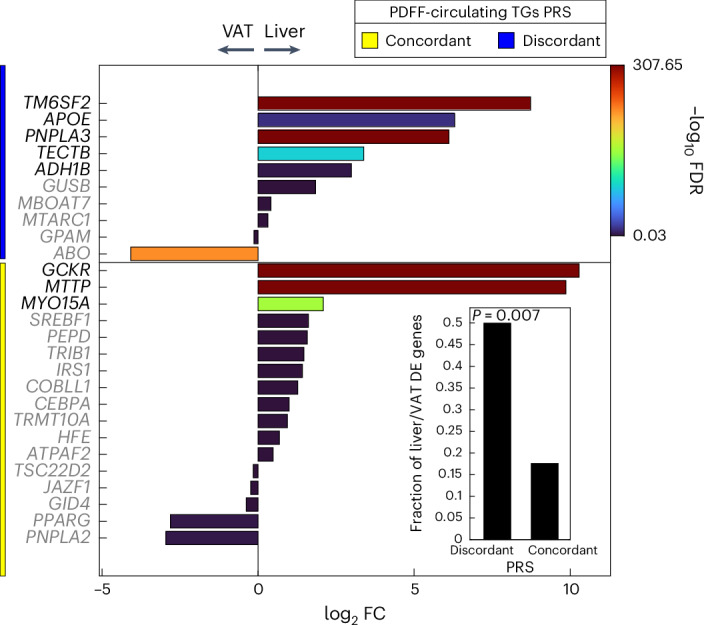
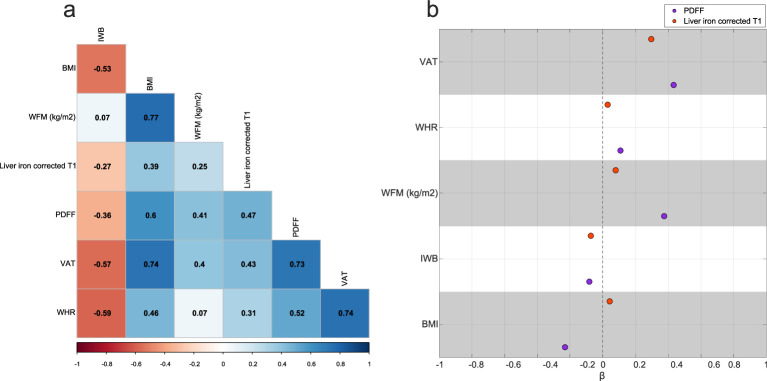
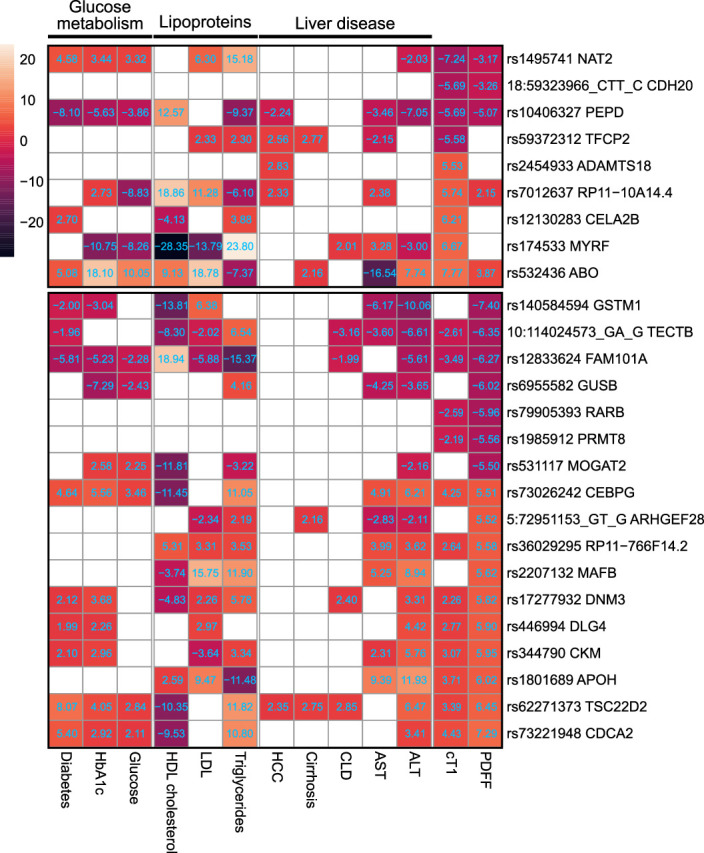
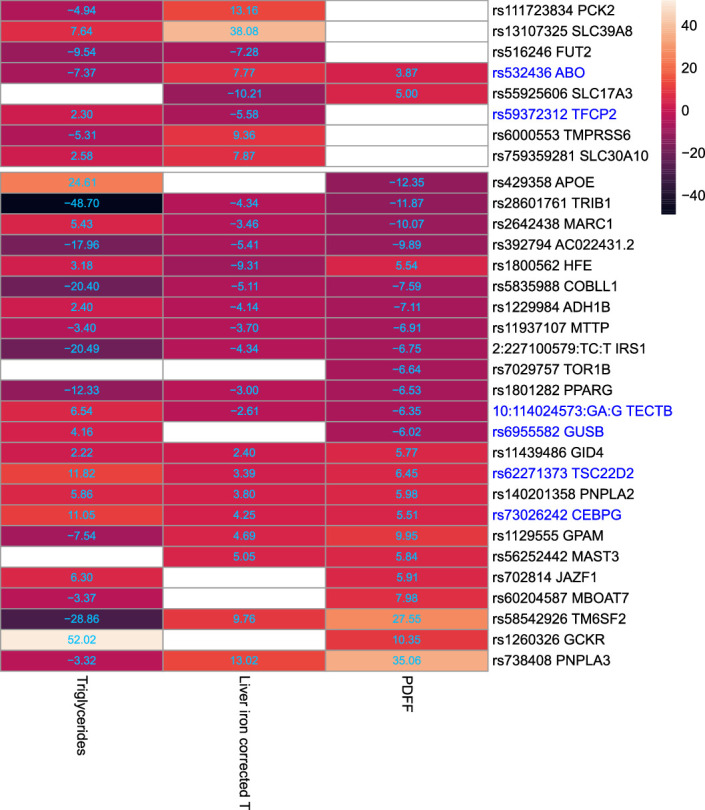
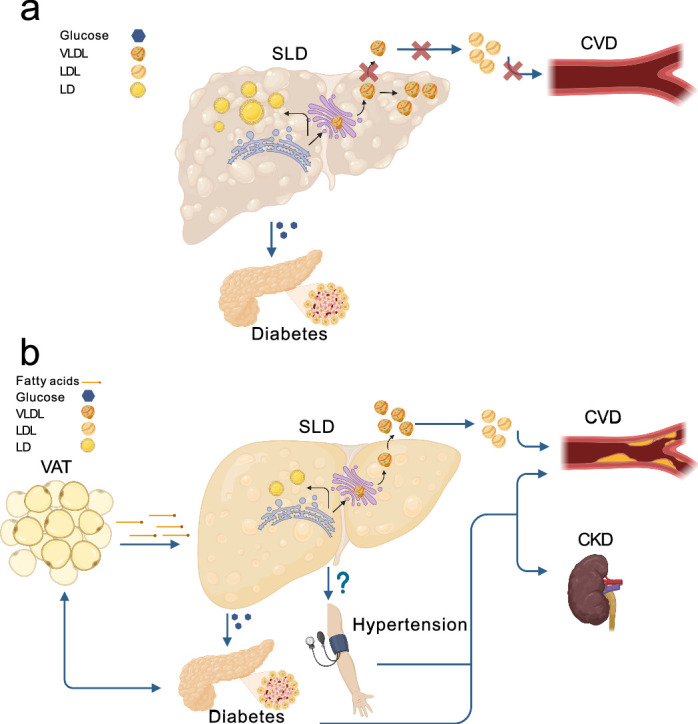
Metabolic dysfunction-associated steatotic liver disease (MASLD) is characterized by an excess of lipids, mainly triglycerides, in the liver and components of the metabolic syndrome, which can lead to cirrhosis and liver cancer. While there is solid epidemiological evidence that MASLD clusters with cardiometabolic disease, several leading genetic risk factors for MASLD do not increase the risk of cardiovascular disease, suggesting no causal relationship between MASLD and cardiometabolic derangement. In this work, we leveraged measurements of visceral adiposity identifying 27 previously unknown genetic loci associated with MASLD (n = 36,394), six replicated in four independent cohorts (n = 3,903). Next, we generated two partitioned polygenic risk scores based on the presence of lipoprotein retention in the liver. The two polygenic risk scores suggest the presence of at least two distinct types of MASLD, one confined to the liver resulting in a more aggressive liver disease and one that is systemic and results in a higher risk of cardiometabolic disease. These findings shed light on the heterogeneity of MASLD and have the potential to improve the prediction of clinical trajectories and inform precision medicine approaches.


Conflict of interest statement

Competing interests: S.R. has been consulting for AstraZeneca, GSK, Celgene Corporation, Ribo-cure AB and Pfizer in the last 5 years and received a research grant from AstraZeneca. The funders had no role in the design of the study; in the collection, analyses or interpretation of data; in the writing of the paper or in the decision to publish the results. L.V. has received speaking fees from MSD, Gilead, AlfaSigma and AbbVie, served as a consultant for Gilead, Pfizer, AstraZeneca, Novo Nordisk, Intercept, Diatech Pharmacogenetics, Ionis Pharmaceuticals, Boehringer Ingelheim and Resalis Therapeutics, and received unrestricted research grants from Gilead. R.L.G. is a part-time contractor for Metabolon. O.J. is a part-time consultant to Ribo-cure AB. The other authors declare no competing interests.

Figures

Fig. 1
Fig. 1. Overview of the identified loci for liver triglycerides and inflammation/fibrosis by the multi-adiposity-adjustment GWAS.
a, Genetic correlation among different multi-adiposity-adjusted PDFF and liver iron corrected T1 was estimated using LD score regression analysis. The asterisks denote Benjamini–Hochberg false discovery rate (FDR) <0.05. The color bar represents the genetic correlation values. Detailed summary statistics for genetic correlations have been reported in Supplementary Table 3. b, Circular Manhattan plot of PDFF and liver iron corrected T1 for different adiposity adjustments. The association analyses were performed using REGENIE adjusting for adiposity index, age, sex, age × sex, age2 and age2 × sex, first ten genomic principal components and array batch. Each dot represents an independent genetic locus. Yellow represents loci associated with liver PDFF and purple represents those associated with liver cT1. Large dots represent pleiotropic loci (where the association with either PDFF or liver cT1 was shared among two or more adiposity adjustments). Small dots show adiposity-trait specific associations. Loci in bold are shared among both traits irrespective of the adiposity adjustment. Only loci with a genome-wide significant P <5 × 10−8 calculated by a whole-genome regression model (Methods) are shown. P values were two-sided and not corrected for multiple testing among four different models (unadjusted, adjusted for BMI, WFM and VAT).
Fig. 2
Fig. 2. The association between six previously unknown loci and hepatic triglyceride content in independent cohorts.
The association between each genetic variant and rank-based inverse normal transformed hepatic triglyceride content was performed using a linear regression analysis adjusted for age, sex, age2, age × sex, age2 × sex (shown as circles). Proxy variants were used for variants not available in the replication cohorts (r2 > 0.4 within a window of 1.5 Mb around each lead variant in the UK Biobank) as marked with an asterisk. Pooled effect estimates were calculated using inverse-variance-weighted fixed-effect meta-analysis (shown as diamonds). Genomic loci in bold are those with a P value <0.05 in the fixed-effects model. Error bars represent the 95% confidence intervals from the regression models or meta-analysis. Full summary statistics have been reported in Supplementary Table 14. P values are two-sided and not adjusted for multiple testing. NEO, Netherlands Epidemiology of Obesity study; DHS, Dallas Heart Study.
Fig. 3
Fig. 3. Partitioned polygenic risk scores identify a steatotic liver-specific disease and a systemic MASLD.
a,b, The case–control (a) and prospective (b) association between two PDFF-circulating TGs pPRS and liver-related, cardiometabolic and chronic kidney failure traits in the UK Biobank. Effect plot of the association between concordant and discordant PDFF-circulating TGs PRS with each disease was tested using either logistic (a) or Cox proportional hazard (b) regression analysis adjusted for BMI, age, sex, age × sex, age2 and age2 × sex, first ten genomic principal components and array batch. The x axis shows either the odds ratio (OR) or hazard ratio. All association analyses have been performed after excluding individuals with available PDFF (n = 36,394). Error bars represent the 95% confidence intervals from the regression models. Full summary statistics have been reported in Supplementary Table 18. P values were two-sided and not corrected for multiple hypothesis testing. TG, triglyceride.
Fig. 4
Fig. 4. mRNA expression of loci from the liver-specific (discordant) polygenic risk score is more abundant in the liver compared to the visceral adipose tissue.
Differential expression analysis of paired liver and VAT bulk RNA-seq data for mapped gene sets of concordant and discordant pPRS. The lower right bar plot shows the fraction of upregulated differentially expressed (DE) genes in the liver compared to VAT. The enrichment of pPRS with upregulated DE genes in the liver was calculated using one-sided Fisher’s exact test. FC, fold change.
Extended Data Fig. 1
Extended Data Fig. 1. Measures of adiposity are highly correlated with liver triglycerides and inflammation/fibrosis, with VAT, WFM, and BMI being independent predictors of liver outcomes.
In (a), the phenotypic correlation between different measures of adiposity, liver triglyceride content measured by proton density fat fraction (PDFF), and inflammation/fibrosis measured by liver iron corrected T1 (cT1); pairwise Spearman’s correlation coefficients have been shown on the heatmap. All correlations had a Benjamini–Hochberg False Discovery Rate (FDR) <0.05. (b) penalized Ridge regression analysis of different adiposity indices in predicting PDFF and liver iron corrected T1. Each dot represents standardized coefficients, and dashed line represents the lack of contribution of each trait to the liver outcomes. Both target variables were rank-based inverse normal transformed before the regression analysis. VAT: visceral adipose tissue, WFM: whole-body fat mass, BMI: body mass index, IWB: impedance of whole body, WHR: waist-to-hip ratio.
Extended Data Fig. 2
Extended Data Fig. 2. Previously unknown genetic loci were associated with liver disease and metabolic traits.
Heatmap of the Z-score of associations for the effect (risk) allele between previously unknown genetic loci and liver or metabolic-related traits (columns) in n=397,780 UKBB participants after excluding individuals with available PDFF or liver iron corrected T1 (n=36,748). The association analyses were performed by linear or logistic regression analysis using REGENIE and adjusted for adiposity index, age, sex, age×sex, age2 and age2×sex, first 10 genomic principal components and array batch. Upper and lower boxes correspond to liver iron corrected T1 and PDFF genetic loci, respectively. Full summary statistics have been reported in Supplementary Table 11. P values were two-sided and not corrected for multiple hypothesis testing. VAT: Visceral adipose tissue; WFM: Whole-body fat mass (kg/m2); cT1: liver iron corrected T1; PDFF: proton density fat fraction; CLD: chronic liver disease.
Extended Data Fig. 3
Extended Data Fig. 3. Association between 26 previously known and 6 previously unknown replicated genetic loci and circulating triglycerides in the UK Biobank.
The heatmap shows the Z-score of associations for the effect (risk) allele in Europeans (n=397,780) after excluding individuals with available PDFF or liver iron corrected T1 (n=36,748). The association was performed by linear regression analysis using REGENIE and adjusted for adiposity index, age, sex, age×sex, age2 and age2×sex, first 10 genomic principal components and array batch. Upper and lower boxes correspond to liver iron corrected T1 and PDFF genetic loci, respectively. Previously unknown replicated genetic loci have been marked in blue. Full summary statistics have been reported in Supplementary Table 15. P values were two-sided and not corrected for multiple hypothesis testing.
Extended Data Fig. 4
Extended Data Fig. 4. Putative model of the two different types of MASLD.
a) In the steatotic liver-specific disease, the primary increase in the liver triglyceride content is due to the hepatic retention of very low-density lipoproteins (VLDL). This retention is causally related to liver inflammation, fibrosis, and hepatocellular carcinoma. In this type of MASLD, the higher risk of diabetes is due to the degree of liver fibrosis, while the lower risk of cardiovascular disease (CVD) to lipoprotein retention. b) In the systemic MASLD, the liver is entwined in the crosstalk among metabolic organs. In this type of MASLD, a dysfunctional visceral adipose tissue may increase the diabetes risk and may release free fatty acids that are incorporated into triglycerides in the hepatocytes causing liver steatosis. In turn, liver steatosis causes an overproduction of VLDL with a subsequent increase in circulating low-density lipoproteins (LDL) resulting in a higher risk of CVD. Additionally, the systemic MASLD associates with an increased blood pressure resulting in kidney failure and further increasing the CVD risk. This figure was created with BioRender.com. CKD: chronic kidney disease (failure); VAT: visceral adipose tissue; LD: lipid droplets.

Update of

References

    1. Sanyal, A. J. et al. Prospective study of outcomes in adults with nonalcoholic fatty liver disease. N. Engl. J. Med.385, 1559–1569 (2021). - PMC - PubMed
    1. Pais, R., Redheuil, A., Cluzel, P., Ratziu, V. & Giral, P. Relationship among fatty liver, specific and multiple-site atherosclerosis, and 10-year Framingham score. Hepatology69, 1453–1463 (2019). - PubMed
    1. Anstee, Q. M., Targher, G. & Day, C. P. Progression of NAFLD to diabetes mellitus, cardiovascular disease or cirrhosis. Nat. Rev. Gastroenterol. Hepatol.10, 330–344 (2013). - PubMed
    1. Toh, J. Z. K. et al. A meta-analysis on the global prevalence, risk factors and screening of coronary heart disease in nonalcoholic fatty liver disease. Clin. Gastroenterol. Hepatol.20, 2462–2473.e2410 (2022). - PubMed
    1. Romeo, S., Sanyal, A. & Valenti, L. Leveraging human genetics to identify potential new treatments for fatty liver disease. Cell Metab.31, 35–45 (2020). - PubMed

MeSH terms