. 2025 Feb;28(2):346-360.
doi: 10.1038/s41593-024-01830-0. Epub 2024 Dec 9.

Thermally induced neuronal plasticity in the hypothalamus mediates heat tolerance

Affiliations

Thermally induced neuronal plasticity in the hypothalamus mediates heat tolerance

Wojciech Ambroziak et al. Nat Neurosci. 2025 Feb.

Abstract

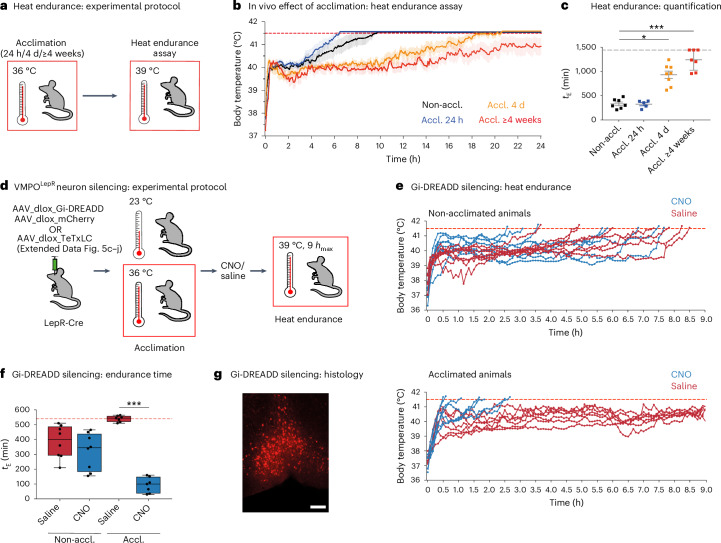
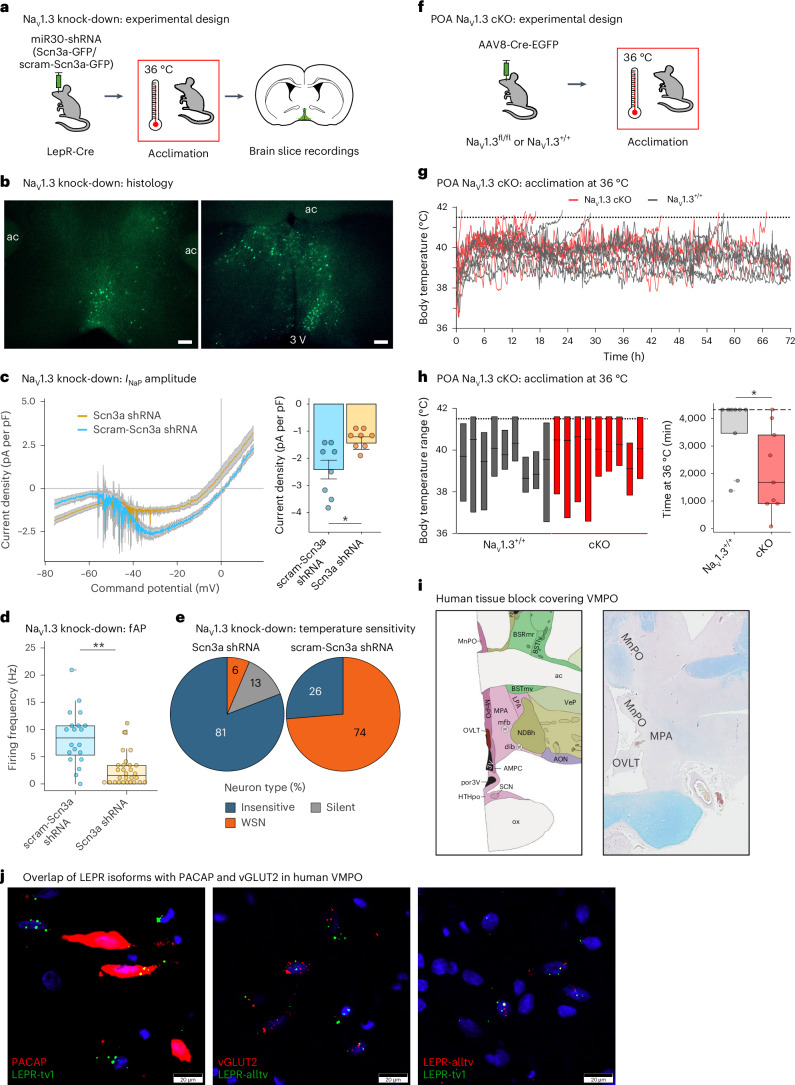
Heat acclimation is an adaptive process that improves physiological performance and supports survival in the face of increasing environmental temperatures, but the underlying mechanisms are not well understood. Here we identified a discrete group of neurons in the mouse hypothalamic preoptic area (POA) that rheostatically increase their activity over the course of heat acclimation, a property required for mice to become heat tolerant. In non-acclimated mice, peripheral thermoafferent pathways via the parabrachial nucleus activate POA neurons and mediate acute heat-defense mechanisms. However, long-term heat exposure promotes the POA neurons to gain intrinsically warm-sensitive activity, independent of thermoafferent parabrachial input. This newly gained cell-autonomous warm sensitivity is required to recruit peripheral heat tolerance mechanisms in acclimated animals. This pacemaker-like, warm-sensitive activity is driven by a combination of increased sodium leak current and enhanced utilization of the NaV1.3 ion channel. We propose that this salient neuronal plasticity mechanism adaptively drives acclimation to promote heat tolerance.


Conflict of interest statement

Competing interests: S.L. is a Novo Nordisk employee and minor shareholder as part of an employee-offering program. The other authors declare no competing interests.

Figures

Fig. 1
Fig. 1. Heat acclimation increases warm-sensitive tonic AP firing of VMPOLepR neurons.
a, FosTRAPping and acclimation protocol. b, Spontaneous AP frequency in neurons of short (4 h) and long (8 h) warm-TRAPped mice. Neuronal activity was recoded at the 36 °C bath temperature: one-way ANOVA: P < 0.0001; Tukey’s multiple-comparison test: P = 0.8364 (TRAP (8 h) non-acclimated (Non-accl.), TRAP (4 h) acclimated (Accl.)); ***P < 0.0001 (TRAP (8 h) Non-accl., TRAP (8 h) Accl.); ***P < 0.0001 (TRAP (4 h) Accl., TRAP (8 h) Accl.) (n = 28/3 (TRAP (8 h) Non-accl.); n = 22/2 (TRAP (4 h) Accl.) and n = 33/3 (TRAP (8 h) Accl.)). c, AP firing frequency in non-acclimated (n = 35/6) versus acclimated (n = 35/6) VMPOLepR and VMPOPacap neurons (n = 30/3 for non-acclimated and n = 37/3 for acclimated). Neuronal activity recoded at 36 °C bath temperature. Unpaired two-tailed Student’s t-test: ***P < 0.0001 (VMPOLepR and VMPOPacap neurons). d, Distribution of temperature-insensitive, CSN (≤−0.6 Hz per °C), WSN (≥0.75 Hz per °C) and silent neurons in VMPOLepR (n = 81/9 non-acclimated, n = 85/10 acclimated) and VMPOPacap (n = 17/3 non-acclimated, n = 31/3 acclimated) neurons, recorded at 33 °C, 36 °C and 39 °C. e, Left: firing frequencies of non-acclimated (n = 81/9) and acclimated (n = 85/10) VMPOLepR neurons recorded at three bath temperatures as indicated. Individual cells plotted in gray and red points represent group averages. Right: temperature coefficient (Hz per °C; mean ± s.e.m.) comparison between the non-acclimated and acclimated VMPOLepR neurons. Unpaired, two-tailed Student’s t-test: ***P < 0.0001. f, Example traces of a non-acclimated and an acclimated VMPOLepR neuron. g, Heatmaps displaying in vivo single-cell VMPOLepR neuron responses at 22 °C and 36 °C, before (left) and after (right) 30 d of heat acclimation. h, Pie charts showing fractions of VMPOLepR neurons increasing (WSN + WRN), decreasing (CRN + CRN) or not changing (insensitive) activity when ambient temperature was increased from 22 °C to 36 °C, before and after heat acclimation. Number of cells pre-acclimation: WSN + WRN, 22; CRN + CRN, 25; insensitive, 4; post-acclimation: WSN + WRN, 38; CRN, 6; insensitive, 5; N = 4 mice. Ex vivo recordings performed with fast synaptic transmission blockade. Box plots represent the median and IQR (Extended Data Figs. 2 and 3). CSN, cold-sensitive neuron.
Fig. 2
Fig. 2. Kinetics of VMPOLepR neuron acclimation, deacclimation and reacclimation.
a, Left: AP firing frequencies of VMPOLepR neurons recorded from non-acclimated mice and mice acclimated for 24 h, 4 d and 4 weeks (full acclimation). Kruskal–Wallis test (H = 69.51, degrees of freedom (d.f.) = 3, P < 0.0001) with Dunn’s pairwise comparisons and Bonferroni’s corrections: **P = 0.0062 (Non-accl.:Accl. 4 d), ***P < 0.0001 (Non-accl.:Accl. ≥4 weeks), ***P = 0.0005 (Accl. 4 d:Accl. ≥4 weeks; n = 42/5 per group). Right: representative traces of AP firing patterns as a function of heat acclimation duration, recorded in VMPOLepR neurons. Brain slices were recorded at 33 °C bath temperature (mean ± s.d.). b, AP firing frequency (Hz) measured in VMPOLepR neurons from LepR-Cre;HTB mice after different acclimation, deacclimation and reacclimation periods. Non-accl. control (black), 2-d Accl. (orange), full acclimation (≥4 weeks Accl., red), 5 or 7 d of deacclimation after full acclimation (≥4 weeks Accl. + 5 d OUT, green; ≥4 weeks Accl. + 7 d OUT, light blue, respectively) or reacclimation after removing fully (4–5 weeks) acclimated animals for 7 d from the 36 °C acclimation chamber to RT and reacclimating them for only 2 d at 36 °C (≥4 weeks Accl. + 7 d OUT + 2 d IN, dark blue). After full acclimation (4–5 weeks), AP firing returned to baseline after 7 d of deacclimation. Reacclimation for just 2 d significantly elevated AP firing to levels much higher than those achieved by a short 2-d acclimation in naive animals. One-way ANOVA (F(5, 189) = 26.85, P < 0.001) with Šidák’s multiple-comparison test: ***P < 0.0001 (≥4-week Accl.:≥4-week Accl. + 5 d OUT); ***P < 0.0001 (≥4-week Accl.:≥4-week Accl. + 7 d OUT); **P = 0.0061 (2-d Accl.:≥4-week Accl. + 5 d OUT + 2 d IN); **P = 0.0061 (Non-accl.:≥4-week Accl. + 5 d OUT + 2 d IN); **P = 0.004 (2-d Accl.:≥4-week Accl. + 7 d OUT + 2 d IN); **P = 0.0002 (Non-accl.:≥4-week Accl. + 7 d OUT + 2 d IN) (n = 38/3 cells per group; mean ± s.e.m.). NS, not significant.
Fig. 3
Fig. 3. Increased heat tolerance after heat acclimation is dependent on VMPOLepR neuron activity.
a, Heat endurance assay. b, Average body temperature (mean ± s.e.m.) of non-acclimated (black; N = 7), 24-h (blue; N = 5), 4-d (orange; N = 8) and 4- to 5-week (red; N = 7) acclimated animals in the heat endurance assay monitored for a maximum of 24 h or until the animal reached the cut-off temperature of 41.5 °C (dashed red line). c, Endurance time (tE; minutes) of mice shown on the left. The cut-off time is 24 h (dashed gray line). Kruskal–Wallis test: H = 20.78, d.f. = 3, P < 0.0001, with Dunn’s pairwise comparisons and Bonferroni’s corrections: *P = 0.0262 (Non-accl:Accl. 4 d), ***P = 0.0006 (Non-accl.:Accl. ≥4 weeks). The error bars represent the mean ± s.e.m. d, Schematic showing the two experimental strategies used to interfere with VMPOLepR neuron activity. hmax, assay cut-off time. e, Heat endurance assay of Gi-DREADD-expressing mice. Non-acclimated (top) or acclimated (bottom) animals were injected with either CNO (i.p. 0.3 mg kg−1) or saline 10 min before the assay and the body temperature was continuously monitored. Non-acclimated animals endured for similarly short times, independent of whether they received CNO or vehicle (saline). In acclimated mice, CNO injection (but not saline injection) eliminated acquired heat tolerance and the animals quickly reached the cut-off temperature (41.5 °C). f, The tE for the groups shown in e. Box plots show the median and IQR. Kruskal–Wallis test: H = 24.33, d.f. = 3, P < 0.0001, with Dunn’s pairwise comparisons and Bonferroni’s corrections: ***P < 0.0001 (Accl. saline:CNO); N = 8 animals for Non-accl. groups and N = 7 for Accl. groups. Note that, as a result of the assay cut-off time of 9 h, the heat tolerance capacity (tE) of the acclimated saline-treated group is underestimated. g, Representative image of VMPOLepR neurons showing mCherry labeling of the Gi-DREADD-mCherry fusion protein. Scale bar, 250 μm. Box plots show the median and IQR (Extended Data Figs. 4 and 5).
Fig. 4
Fig. 4. Thermoafferent LPBN pathway is required to trigger heat acclimation.
a, Schematic showing the viral injection strategy for TeTxLC-mediated silencing of excitatory (Vglut2-positive) presynaptic neurons located in the LPBN and innervating VMPO. b, Example images showing the expression of AAV-FRT-TeTxLC-EGFP (green) and retroAAV-dlox-FlpO-mCherry (red) in the VMPO (left) and in VMPO-projecting LPBN neurons (right). Scale bars, 250 μm. The histological labeling confirmed double infection of glutamatergic LPBN neurons in Vglut2-Cre mice expressing the recombinase FlpO (red; derived from the retroAAV injected into VMPO) and TeTxLC (green; derived from Cre- and FlpO-dependent AAV particles injected into the LPBN) (middle). Scale bar, 100 μm. Note that labeled neurons are mainly located in the dorsal lateral part of the LPBN; no TeTxLC is detectable in the POA (top left), assuring that inhibition happened at the level of the LPBN but not the POA. c, Body temperature traces of individual LPBN → VMPO silenced (Cre-positive, green, N = 5) and nonsilenced control (Cre-negative, gray, N = 5) animals during the initial 48 h of heat acclimation. In contrast to Cre-negative animals, all animals expressing TeTxLC failed to maintain their body temperature <41.5 °C during the first 2 d of acclimation (Extended Data Figs. 6 and 7).
Fig. 5
Fig. 5. Optogenetic conditioning of VMPOLepR neurons induces heat tolerance.
a, Experimental paradigm used for continuous optogenetic activation of VMPOLepR neurons before the heat endurance assay. LepR-Cre animals were injected with Cre-dependent ChR2 AAV particles into the rostral POA and either not stimulated or stimulated for 1 or 3 d by blue light at a low frequency (1 Hz) before the heat endurance assay. All animals were optogenetically stimulated during the heat endurance assay. b, Body temperature of individual mice subjected to optogenetic conditioning. Only those animals conditioned for 3 d had acquired heat tolerance and performed robustly in the heat endurance assay. Animals that reached the cut-off temperature of 41.5 °C were removed from the assay; assay duration was limited to 9 h. c, Endurance time (tE) of the differently conditioned groups shown in b. Box plots show the median and IQR. Kruskal–Wallis test: H = 8.649, d.f. = 2, P = 0.0019, with Dunn’s pairwise comparison test and Bonferroni’s corrections: **P = 0.0088 (Opto:3 d Opto) (N = 4 per group (Extended Data Fig. 8)).
Fig. 6
Fig. 6. Electrophysiological characterization of VMPOLepR neurons.
a, RMP in acclimated VMPOLepR neurons (n = 19/3) depolarized compared with the RMP of non-acclimated VMPOLepR (n = 17/3) cells. Unpaired, two-tailed Student’s t-test, ***P = 0.0001. b, Membrane input resistance (Rm) comparable between non-acclimated (n = 37/9) and acclimated (n = 41/10) VMPOLepR neurons. c, Left: membrane hyperpolarization in non-acclimated (n = 17/2) and acclimated (n = 19/2) VMPOLepR neurons caused by replacement Na+ for NMDG+ in aCSF. Right: the difference in membrane potential (Δ) between Na+-based aCSF and NMDG+-based aCSF is larger in acclimated VMPOLepR neurons. Unpaired, two-tailed Student’s t-test, *P = 0.0201. d, Left: AP phase plot of non-acclimated (gray, n = 9/4) and acclimated (red, n = 10/5) VMPOLepR neurons. Right: both AP 10–90% rise time (Wilcoxon’s test, **P = 0.0046) and 90% to 10% decay time (unpaired, two-tailed Student’s t-test, ***P = 0.0006) are significantly faster in VMPOLepR neurons after acclimation. e, Left: current–voltage relationship for VMPOLepR neuron peak transient NaV currents recorded in nucleated patches. Two-way ANOVA (effect of acclimation voltage, *P < 0.0001; Tukey’s multiple-comparison test, **P = 0.0016 (−25 mV), ***P = 0.0003 (−20 mV), ***P = 0.0002 (−15 mV), ***P < 0.0001 (−10 mV), ***P = 0.0005 (−5 mV) and **P = 0.0072 (0 mV); n = 6/2 (Non-accl.) and n = 6/2 (Accl.) cells). Right: example of transient NaV current recordings from VMPOLepR neurons. Inset: voltage step protocol used. f, Left: average INaP, revealed by slow depolarizing voltage ramp, enhanced after heat acclimation (n = 12/4 (Non-accl.) and n = 10/4 (Accl.) cells). Inset: ramp protocol used to record INaP. Right: quantification of INaP at −35 mV based on data shown on the left. Unpaired, two-tailed Student’s t-test, *P = 0.0055. g, Left: INaP in acclimated VMPOLepR neurons reduced by riluzole (10 µM) and completely blocked by TTX (1 µM). Right: quantification of INaP at −35 mV based on data shown on the left. One-way ANOVA, P < 0.0001; Tukey’s multiple-comparison test, ***P < 0.0001 (Accl.:Accl. + riluzole), ***P < 0.0001 (Accl.:Accl. + TTX), *P = 0.0170 (Accl. + riluzole:Accl. + TTX) (n = 9/2 (Accl.), n = 10/2 (riluzole) and n = 7/2 (TTX) cells). h, Left: firing frequency (fAP) of acclimated VMPOLepR neurons reduced by riluzole (10 µM) and ICA121431 (200 nM). One-way ANOVA, P < 0.0001; Tukey’s multiple-comparison test, ***P < 0.0001 (Accl.:Accl. + riluzole), ***P < 0.0001 (Accl.:Accl. + ICA121431); n = 40/10 (Accl.), n = 35/4 (riluzole) and n = 39/6 (ICA121431) cells. Right: example traces of the three conditions shown. i, Left: NaV1.3 antagonist ICA121341 blocking INaP in acclimated VMPOLepR neurons to a similar extent to riluzole. Right: quantification of INaP at −35 mV based on data shown on the left. One-way ANOVA, P = 0.0002; Tukey’s multiple-comparison test, **P = 0.0029 (Accl.:Accl. + ICA121431), ***P = 0.0001 (Accl.:Accl. + ICA121431 + riluzole); n = 8/3 (Accl.), n = 12/4 (ICA121431) and n = 10/2 (ICA121431 + riluzole). Part of the Accl. INaP data shown in g was repurposed for comparisons shown here. j, Distribution of temperature-insensitive, CSN, WSN and silent neurons within acclimated VMPOLepR neuron populations recorded with either riluzole (10 µM) or ICA121431 (200 nM) in perfusion fluid (n = 33/4 for riluzole and n = 24/4 for ICA121431). k, Firing frequencies of acclimated VMPOLepR control cells (n = 30/5), acclimated VMPOLepR cells recorded with riluzole (n = 33/4) and acclimated VMPOLepR cells recorded with ICA121431 (n = 24/4). Individual cells are plotted in color; black lines represent linear regression for each group Tcore (slope or temperature coefficient) = 1.9 for Accl. control, Tcore = 0.68 for riluzole and Tcore = 0.29 for ICA121431. Acclimated control cells were randomly sampled from the acclimated VMPOLepR cells plotted in Fig. 1e. Box plots in ac and h represent the median and IQR; elsewhere data are shown as mean ± s.e.m (Extended Data Fig. 9 and Supplementary Figs. 1 and 2). Neuronal activity and currents were recoded under fast synaptic transmission blockade and at 36 °C.
Fig. 7
Fig. 7. NaV1.3 is required for acclimation-induced, tonic warm-sensitive firing and heat tolerance.
a, LepR-Cre mice POA injected with Cre-dependent constructs encoding shRNAs against Scn3a or scrambled control (scram-Scn3a shRNA). b, Acclimated VMPOLepR neurons labeled with GFP encoded within the shRNA constructs. Scale bars, 250 μm. ac, anterior commissure. c, Left: average INaP in VMPOLepR neurons expressing Scn3a shRNA and scrambled control. Traces are presented as mean ± s.e.m. Right: quantification (mean ± s.e.m.) of INaP at −35 mV, showing a reduction of INaP in Scn3a shRNA expressing acclimated LepR+ neurons. Unpaired, two-tailed Student’s t-test, *P = 0.0174; n = 8/4 (Scn3a shRNA) and n = 8/3 (scram-Scn3a shRNA) cells. d, Firing frequency of acclimated VMPOLepR neurons significantly reduced by the functional shRNAs. Unpaired two-tailed Student’s t-test, **P = 0.0044; n = 30/5 (Scn3a shRNA) and n = 20/3 (scram-Scn3a shRNA) cells. e, Distribution of temperature-insensitive, WSN and silent neurons within the acclimated VMPOLepR neuron population expressing either Scn3a (n = 47/5) or scram-Scn3a (n = 19/3) shRNA. f, NaV1.3fl/fl and WT controls were injected with an AAV encoding the Cre recombinase into the POA (cKO). g, Most of the WT animals able to defend their body temperature within physiological range. In contrast, all but one of the NaV1.3 cKO animals were unable to maintain their body temperature <41.5 °C (N = 9 for each group). h, Left: range of body temperatures of animals shown in g. Right: quantification of endurance time at 36 °C acclimation temperature of mice shown in g. Cut-off time was 72 h (dashed line). Mann–Whitney U-test, *P = 0.0155 (N = 9 each). i, Left: Allen Brain Atlas annotation of human POAs. Right: human tissue block covering POAs MnPO/MPA/OVLT (LFB/H&E stain). j, LEPR coexpression in human VMPO with RNAscope ISH. Left: PACAP + LEPR-tv1 (long isoform; coexpression in yellow). Middle: vGLUT2 + LEPR-alltv (all isoforms; coexpression in yellow). Right: LEPR-alltv + LEPR-tv1 (coexpression in yellow). Electrophysiological recordings were performed with fast synaptic transmission blockade and at 36 °C. Box plots show the median and IQR (Extended Data Fig. 10 and Supplementary Figs. 4 and 5).
Fig. 8
Fig. 8. Summary.
Heat stimuli reach thermoregulatory neurons in the hypothalamic preoptic area (POA) via parabrachial thermoafferent pathways (LPBN: lateral parabrachial nucleus). Sustained, long-term heat exposure triggers an adaptive process that transforms LepR-expressing POA neurons to become tonically active and warm sensitive. This form of cellular plasticity, which is mediated in part by the activity of a voltage-gated sodium channel, increases heat tolerance in mice to protect the animals from the detrimental effects of hot environments.
Extended Data Fig. 1
Extended Data Fig. 1. VMPO neurons responding with a delay to a heat stimulus overlap with LepR-positive neurons and are receptive to becoming activated by heat acclimation.
a, Left: Brain sections revealing the VMPO of FosTRAP2;HTB mice that received z-4-hydroxytamoxifen (4-OHT; 50mg/kg i.p.) at room temperature (TRAP@RT) and after 2 hours of a 4-hour (TRAP@36 °C (4h)) or 8-hour (TRAP@36 °C (8h)) exposure to 36 °C,. Scale bar: 100 μm. Right top: Increasing the time of exposure to 36 °C increases the number of TRAPped GFP-positive cells in the VMPO. Kruskal-Wallis test, P <0.0001; Dunn’s multiple comparisons test, *P = 0.0110 (TRAP@RT: TRAP@36˚C (4h)), ***P < 0.0001 (TRAP@RT : TRAP@36˚C (8h)), **P = 0.0047 (TRAP@36˚C (4h) : TRAP@36˚C (8h)). n = 7 sections / 3 animals for TRAP@RT, n = 22/5 for TRAP@36˚C (4h) and n = 18/4 for TRAP@36˚C (8h). Right bottom: TRAPped neurons highly overlapped with Fos protein in animals exposed to warmth.; n = 22/5 for TRAP@36˚C (4h) and n = 18/4 for TRAP@36˚C (8h). b, Warm-stimulated (4 hours) and RT control brain sections of LepR-Cre;HTB mice show the rostral POA and MnPO, stained with GFP (LepR expression) and cFos. The overlap of LepR and cFos due to warm temperature exposure is quantified in the right panel graph (% of LepR-positive neurons, from 11 and 10 sections of N = 2 animals for RT and 36 °C, respectively; two-tailed T-test, ***P < 0.0001; scale bars: 100 μm). c, Expression of Pacap (Adcyap) and Bdnf transcripts assessed by bulk mRNA sequencing of FACS sorted LepR+ and LepR- cells obtained from POA tissue isolated from LepR-Cre;HTB mice. DWilcoxon test, ***P < 0.0001 (LepR+ : LepR-). n=18/3 (samples/mice); each data point represents expression of the respective gene in each sample plotted as a log2 normalized value. d, Core body temperature, BAT and tail temperature of ChR2-expressing and control mice before, during (blue shading) and after blue light stimulation (20 Hz, 10 msec pulses, 1min ON/3min OFF). n=4 mice per group. Data represent mean ± s.e.m. e, Right: Quantification of the number of neurons expressing cFos in VMPO of LepR-Cre;HTB kept at room temperature (RT), and stimulated at 36 °C and displayed as % of all cFos-positive neurons. Kruskal-Wallis test, P < 0.0001; Dunn’s multiple comparisons test, **P = 0.0047 (RT : 2h @ 36 °C), ***P < 0.0001 (RT : 4h @ 36 °C), **P = 0.0034 (2h @ 36 °C : 4h @ 36 °C). n = 7 sections / 2 animals for RT, 8 sections / 3 animals for 4h @ 36 °C, and 6 sections / 2 animals for 8h @ 36 °C. Left: Quantification of the absolute number cFos-positive cells. Kruskal-Wallis test, P = 0.0442; Dunn’s multiple comparisons test, P = 0.7224 (RT : 2h @ 36^C), P = 0.1709 (RT : 4h @ 36 °C), *P = 0.0381 (2h @ 36 °C : 4h @ 36 °C). f, Extent of VMPOLepR population. Representative images of 250 µm acute slices from LepR-Cre;HTB mice used for ex vivo electrophysiological experiments. Scale bar: 100 μm. Boxplots show median and interquartile range.
Extended Data Fig. 2
Extended Data Fig. 2. Heat acclimation-induced upregulation of tonic warm-sensitive AP firing is most robustly detected in the VMPOLepR population.
a, Comparison of membrane capacitances in acclimated neurons from various VMPO populations recorded in acute slices, selecting cells with similar soma sizes. b, On average, acclimated VMPOLepR neurons had a significantly higher firing frequency compared to acclimated VMPOVgat neurons, acclimated VMPOVglut2 neurons as well as randomly sampled VMPO acclimated neurons. Non-acclimated VMPOLepR neurons plotted for reference. One-way ANOVA, P < 0.0001; Sidak’s multiple comparison test, ***P < 0.0001 (LepR+ Accl. : LepR+ Non-accl.), ***P < 0.0001 (LepR+ Accl. : Vgat+ Accl.), *P = 0.0362 (LepR+ Accl. : Vglut2+ Accl.), ***P < 0.0001 (LepR+ Accl. : VMPO random Accl.). n = 40/7 (LepR+ Accl), n = 40/6 (LepR+ Non accl), n = 31/3 (Vgat+ Accl.), n = 39/4 (Vglut2+ Accl.) and n = 21/2 (VMPO Random Accl.) cells. c, VMPOLepR neurons (green) and DMHLepR neurons (orange) were recorded in whole-cell patch clamp configuration to assess acclimation-induced AP firing frequency increases in acclimated and non-acclimated animals (n=35/5 per group). Kruskal-Wallis test (H = 46.20, d.f. = 3, P < 0.0001); Dunn’s pairwise comparisons with Bonferroni corrections (p < 0.0001 for Non-Accl. : Accl.POA LepR). No change in the average AP firing frequency was observed in DMHLepR neurons. d, AP firing rates at 36 °C in both non-acclimated and acclimated VMPOLepR neurons in ex vivo brain slices are comparable in the presence and absence of the fast synaptic transmission blockers (CNQX 10 µM, APV 50 µM and Gabazine 5 µM). n = 12/2 (Non-accl. –Syn. block), n = 15/3 (Non-accl. +Syn. block), n = 11/2 (Accl. –Syn. block), n = 15/3 (Accl. +Syn. block) cells. e, Adding acetylcholine receptor antagonists tubocurarine (10 µM) and scopolamine (10 µM) to the solution with CNQX, APV, and Gabazine slightly (but insignificantly) reduced AP firing in non-acclimated VMPOLepR neurons and did not affect AP firing in acclimated VMPOLepR cells: n = 25/5 (Non-accl. / syn. block), n = 25/4 (Non-accl. / syn. block+tubocurarine+scopolamine), n = 25/6 (Accl. / syn. block), n = 25/4 (Accl. / syn. block+tubocurarine+scopolamine). Data recorded at 33 °C. f, Frequencies of VMPOLepR at sub-physiological and physiological temperatures: regression analysis (grey and red lines) of non-acclimated and acclimated VMPOLepR firing rates at 33 °C, 36 °C, and 39 °C (data in main Fig. 1e). The analysis predicted that firing rates would be indistinguishable at ~29.1 °C (intersection of red and grey lines), confirmed experimentally by recording at 27 °C and 30 °C. Data partially overlapping with Fig. 1e. g, Warm sensitivity (measured by the temperature coefficient Tc) of tested VMPO neuronal populations after heat acclimation. One-way ANOVA, P < 0.0001; Tukey’s multiple comparison test, ***P < 0.0001 (LepR+ : Vgat+), ***P < 0.0001 (LepR+ : Vglut2+), ***P < 0.0001 (LepR+ : Pacap+), ***P < 0.0001 (LepR+ : FosTRAP 4h), ***P < 0.0001 (LepR+ : FosTRAP 8h). n = 38/7 (LepR+), n = 31/3 (Vgat+), n = 36/4 (Vglut2+), n = 31/3 (Pacap+), n = 18/2 (FosTRAP 4h) and n = 26/3 (FosTRAP 8h) cells. h, Distribution of ex vivo recorded temperature-insensitive, cold-sensitive (CSN, temperature coefficient < −0.6 Hz/°C), warm-sensitive (WSN, temperature coefficient ≥ 0.75 Hz/°C) and silent neurons within the acclimated VMPO neuronal populations demarcated by the expression of Vgat (n = 31/3) and Vglut2 (n = 36/4) as well as ‘warm TRAPped’ neurons for either 4h (n = 18/2) or 8h (n = 26/3). Compare with Fig. 1d. i, Spontaneous activity pattern in representative non-acclimated and acclimated VMPOLepR differs not only by frequency but also regularity of action potential firing as evidenced by the different inter spike interval coefficient of variation (ISI CoV, a measure of AP firing regularity, is the standard deviation of the interspike interval (ISI) divided the mean ISI). Analysed recordings were performed at 36 °C bath temperature. j Interspike interval coefficient of variation (ISI CoV) for the indicated neuronal populations obtained from heat acclimated mice. One-way ANOVA, P < 0.0001; Tukey’s multiple comparison test, ***P < 0.0001 (LepR+ Non-accl. : LepR+ Accl.), *P = 0.0215 (LepR+ Accl. : Vgat+), **P = 0.0011 (LepR+ Accl. : FosTRAP 4h). n = 63/7 (LepR+ Non-accl.), n = 57/7 (LepR+ Accl.) n = 22/3 (Vgat+), n = 31/4 (Vglut2+), n = 30/3 (Pacap+), n = 16/2 (FosTRAP 4h), n = 28/3 (FosTRAP 8h) and n = 15/2 (Random) cells. Neuronal activity was recoded in brain slices under fast synaptic transmission blockade and using ‘high-K+ aCSF’ except for panels (c) and (e) where ‘low-K+ aCSF’ and 33 °C bath temperature were used. Boxplots in (a), (b), (d), (e), (f), (g), and (j) represent median and interquartile range; data in (c) are shown as mean ± s.e.m.
Extended Data Fig. 3
Extended Data Fig. 3. Microendoscopy reveals acclimation-induced VMPOLepR warm responsiveness in vivo.
a, Top: schematic of experimental configuration indicating AAV-mediated GCaMP6f delivery into VMPOLepR neurons and GRIN lens implantation. Bottom: experimental timeline. b, Representative images showing GCaMP6f expression in VMPOLepR neurons, and location of the GRIN lens implant. c, Left: maximal projection image from a representative imaging session and location of the regions of interest (ROI). Right: calcium dynamics from 6 representative neurons recorded from a non-acclimated mouse at RT (22 °C) and at 36 °C. Note that some cells increase (red traces), decrease (blue trace) and don’t change (grey trace) activity. d, Cumulative distribution plots of the activity (averaged z-scores) of all extracted neurons in 4 mice upon increasing ambient temperature acutely from RT (22 °C) to 36 °C, before and after acclimation for 30 days at 36 °C. Mann-Whitney U test, ***P < 0.0001 for cumulative fraction at 36 °C Pre vs Post acclimation. e, Cumulative distribution plots of the activity (averaged z-scores) of all extracted neurons in 2 time-matched control mice upon increasing ambient temperature acutely from RT to 36 °C, before and after sham acclimation. The time-matched controls did not undergo acclimation to temperature but stayed at at 22 °C for 30 days in between recording sessions. Mann-Whitney U test, P = 0.2273 (Sham #1) and P = 0.3624 (Sham #2) for cumulative fraction at 36 °C Pre vs Post sham acclimation. f, Representative calcium dynamics (ΔF/F) traces in 8 randomly selected cells from mouse #2 from panel d before (Pre-accl.) and after heat acclimation (Post-accl.). g, Representative VMPOLepR that could be reliably tracked and recorded before and after acclimation (30 days in between recording sessions) in 2 acclimated mice, and in a time-matched RT control mouse. Activity of single cells upon changes in ambient temperature from 22 °C to 36 °C. Cells were longitudinally recorded before (pre) and after (post) temperature acclimation. h, Summary plots of calcium transients in 2 mice (left, middle) before and after heat acclimation with the mouse kept at 22 °C during recordings and a non-acclimated mouse with matched inter-recording interval in between recording sessions (30 days) (right); related to panel h. Data based on N=4 acclimated animals and N=2 time-matched non-acclimated animals. Data shown as mean ± s.e.m.
Extended Data Fig. 4
Extended Data Fig. 4. Heat acclimation-induced heat tolerance is blocked by TeTxLC-mediated VMPOLepR silencing.
a, Body temperature of individual non-acclimated (Non-Accl., black, N = 7), 24hr-acclimated (Accl. 24hr, blue, N = 5), 4 days-acclimated (Accl. 4days, orange, N = 8), and ≥ 4 weeks acclimated (Accl. ≥ 4W, red, N = 7) mice during 24-hour heat endurance assay. b, Correlation plot between heat endurance time (tE) and average firing frequency of VMPOLepR neurons after varying duration of acclimation. Pearson's (r) correlation coefficient between the two parameters is shown. c, TeTxLC functionality was tested by measuring body temperature after CNO injection in mice with VMPOLepR neurons expressing Gq-DREADD or Gq-DREADD+TeTxLC (N = 4 per group). Only mice without TeTxLC showed a temperature decrease. d, Average body temperature over 24 hours at RT shows no difference between TeTxLC- (N = 6) and mCherry-infected (N = 4) animals. Two-way ANOVA (effect of treatment * time: F (144, 1152) = 2.236, P < 0.0001) with Sidak’s multiple comparisons (P = ns). Insets: Mean body temperature of the two groups during nighttime (left) and daytime (right). e, f, Average body temperature of TeTxLC- and mCherry-infected animals at day 2 (e) and day 30 (f) of heat acclimation, showing that TeTxLC-animals are hyperthermic. Note that during heat acclimation 6 of the 9 TeTxLC-animals dropped out. At day 2: N = 6 and N = 5 for TeTxLC and mCherry, respectively. At day 30: N = 3 and N= 5 for TeTxLC and mCherry, respectively. g, Quantification of the area under the curve (AUC) calculated for the two groups for the last day of acclimation. Mann-Whitney U test (two-tailed), *P = 0.0286. N = 3 mice for TeTxLC and N = 5 mice for mCherry control. h, Body temperature traces of individual TeTxLC-silenced LepR-Cre animals are shown for the first 3 days of heat acclimation (36 °C). 6 out of 9 animals with silenced VMPOLepR neuron outputs reached the Tcore cut-off. i, TeTxLC-silenced animals that completed the 30-day acclimation cycle (N = 3) were tested side-by-side with control animals (N = 5) in the heat endurance assay. Top: Body temperature traces of individual mice. Bottom: average body temperature traces for the TeTxLC- and mCherry-expressing groups. j, Quantification of the endurance time (tE) in the 9-hour (540 min) heat endurance assay for the two groups. Mann-Whitney U test (two-tailed); *P = 0.0262 (mCherry : TeTxLC). N = 3 for TeTxLC and N = 5 for mCherry control mice. Data presented as mean ± SD. k, Representative image of VMPOLepR neurons labelled with EGFP that is co-expressed with TeTxLC; Size bar = 250 μm. All data represent as mean ± s.e.m with the exception of panel (j).
Extended Data Fig. 5
Extended Data Fig. 5. Gi-DREADD-driven inhibition of acclimation-induced VMPOLepR activity prevents heat tolerance.
a, Schematic drawings representing different anatomical positions along the rostral caudal axis of the preoptic hypothalamic region with the 3 middle drawings (approx. bregma = 0.5 mm to bregma = 014) indicating the center of the VMPO region (top) with corresponding typical fluorescent images depicting the extent of virally (AAV) delivered Cre-dependent Gi-DREADD expression in a LepR-Cre mouse (bottom). b, Top: Schematic showing the protocol used for ex vivo verification of CNO triggered, Gi-DREADD mediated inhibition of VMPOLepR following heat acclimation. Bottom left: Representative electrophysiological traces showing the effect of CNO on the firing pattern of acclimated VMPOLepR neurons injected with either Cre-dependent Gi-DREADD-mCherry AAV or only a Cre-dependent mCherry control AAV. Bottom right: average (mean ± s.e.m.) tonic AP firing frequency of acclimation-induced VMPOLepR cells in the presence of 5 µM CNO. Mann-Whitney U test (one-tailed), ***P < 0.0001. n = 35/3 cells per group. c, Heat endurance assay: Average (mean ± s.e.m.) body temperature of non-acclimated (top) or acclimated (bottom) Gi-DREADD-positive and CNO-injected animals during the heat endurance assay. The same animals injected with saline instead of CNO were also plotted for comparison. N = 8 mice for the non-acclimated and N = 7 mice for the acclimated condition.
Extended Data Fig. 6
Extended Data Fig. 6. Effect of leptin signaling on VMPOLepR activity and on heat acclimation and heat endurance.
a, Body weight of acclimated animals decreased and remained significantly lower compared to that of non-acclimated counterparts during the entire acclimation period. Two-way ANOVA (effect of treatment * acclimation time: F (2, 12) = 29.14, P < 0.0001) with Tukey’s pairwise comparisons: *P = 0.0177 (Non-accl. : Accl. at 7 days), *P = 0.0366 (Non-accl. : Accl. at ≥4 weeks). N=4 per group. b, Blood plasma leptin measurements in non-acclimated and acclimated animals over the course of 30 days. Mann-Whitney U test (two-tailed), **P = 0.0070 for the non-acclimated condition and *P = 0.0142 for the acclimated condition. N = 7 for Non-accl. and N = 9 for Accl. c, Leptin content in the blood and frequency of action potential firing of VMPOLepR neurons were tested upon food-deprivation (48 h). Mann-Whitney U test (two-tailed), **P = 0.0079 for Leptin concentration and **P = 0.0050 for fAP. d, LepR-Cre;HTB mice received i.p. leptin injections twice daily for the last 3 days (short-term) or the entire 30-day acclimation (long-term). Controls received saline. Post-acclimation, mice underwent a 9-hour heat endurance test, followed by ex vivo recording of VMPOLepR neuron activity. e, Left: long-term leptin treatment slightly reduced fAP in acclimated VMPOLepR. Unpaired two-tailed t-test, **P = 0.0035. n = 38/5 (Accl.) and n = 39/3 (Accl. + Leptin) cells. Middle: long-term supplementation of leptin did not have an effect on warm-sensitivity of VMPOLepR neurons, measured by temperature coefficient. n = 38/5 (Accl.) and n = 39/3 (Accl. + Leptin) cells. Right: Distribution of temperature-insensitive, and warm-sensitive (WSN) within acclimated VMPOLepR control group (n = 38/5 cells) and VMPOLepR group (39/3 cells). Recordings were performed at at 36 °C using ‘high-K+ aCSF’ and in the presence of synaptic blockers CNQX, AP-V and gabazine. f, Short-term leptin treatment did not have any impact on fAP in acclimated VMPOLepR; non-acclimated VMPOLepR group was plotted for visual comparison. n = 51/5 (Accl.) and n = 51/5 (Accl. + Leptin 100 nM in aCSF) cells. Tonic neuronal activity was recoded without synaptic blockade, using ‘low-K+ aCSF’ and at 33 °C bath temperature. g, Body temperature traces of LepR-Cre;HTB animals during the heat endurance assay following long-term supplementation of leptin during 30d of heat acclimation at 36 °C. N = 5 mice. h, Body temperature traces of individual (left) LepR-Cre;HTB animals following short-term supplementation of leptin duringheat challenge. Group averages are presented in the right panel. N = 5 animals each. i, Db/db animals were pair-fed with littermate control mice for 1 week and kept at room temperature (22 °C/23 °C) before undergoing the 9-hour heat endurance assay. Middle: body weight was comparable between the two groups prior to the assay. Right: Both control and Db/Db mice reached the body temperature cut-off of 41.5 °C prior to the conclusion of the 9-hour period. N = 4 animals per group. All data presented as mean ± s.e.m. Boxplots represent median and interquartile range.
Extended Data Fig. 7
Extended Data Fig. 7. Thermo-afferent pathways via the PBN are required during the initial phase of heat acclimation but appear to become obsolete at late acclimation stages.
a, Spontaneous EPSC and IPSC in VMPOLepR neurons from non-acclimated, short-term (17 h), and long-term (30 days) acclimated LepR-Cre;HTB mice. Left: EPSC frequency increased after 17 hours of acclimation and returned to baseline after 30 days. Kruskal-Wallis test, P = 0.0017; Dunn’s multiple comparisons test, *P = 0.0328 (Non-accl. : Accl. 17h), **P = 0.0024 (Accl. 17h : Accl. 30d). n = 74/4 (Non-accl.), n = 82/4 (Accl. 17h) and n = 51/4 (Accl. 30d) cells. 2nd from left: EPSC amplitude did not change between the conditions tested. 3rd from left: IPSC frequency was found to decrease over the course of acclimation. One-way ANOVA, P = 0.0345; Tukey’s multiple comparison test, *P = 0.0497 (Non-ccl.:Accl. 30d). n = 57/3 (Non-accl.), n = 60/3 (Accl. 17h) and n = 46/3 (Accl. 30d) cells. 4th from left: IPSC amplitude did not change between the conditions tested. Data shown as mean ± s.e.m. b, Strategy for Gi-DREADD delivery into glutamatergic LPBN neurons that target VMPO using the Vglut2-Cre mouse line. c, Gi-DREADD mediated inhibition of PBN→POA projection neurons renders Cre-positive animals (orange), but not Cre-negative controls (grey), slightly hyperthermic after CNO injection at the end of acclimation. d, CNO-mediated inhibition of these PBN→POA projection neurons during the heat endurance assay did not perturb heat tolerance. Left: Body temperature traces of individual Cre-positive (orange, N = 4) and Cre-negative (grey, N = 4) mice during heat endurance assay. Right: Body temperature of mice expressing Gi-DREADD and AAV-injected controls during the assay. e, Electrophysiological traces showing the effect of CNO on the firing pattern of Gi-DREADD-expressing PBN neurons recorded from an acclimated mouse ex vivo. Right panel: average AP firing frequency (n=17) of control and CNO treated cells. Mann-Whitney U test (two-side); ***P < 0.0001. n = 17/2 cells each. f, Body temperature of individual V1-DTA ablated and wildtype littermate control animals (N = 4 per group) during the first three days of heat acclimation. g, Area under the curve (AUC) calculated from body temperature recordings for three consecutive days of acclimation (Day 1 = 0–24 h, Day 2 = 24–48 h and Day 3 = 48–72 h) for the V1-DTA ablated and control mouse groups. Mann-Whitney U test (two-tailed); *P = 0.0286. N = 4 animals per group. h, Body temperature traces of individual TRPM2-KO and control animals during the first 3 days of acclimation. N = 7 mice each. i, j, Individual (i) and average (± s.e.m.) (j) body temperature traces TRPM2-KO and control animals during the heat endurance assay. N = 7 mice per group. k, Quantification of the area under curve (AUC) for TRPM2-KO and control animals during the heat endurance assay. Unpaired two-tailed t-test, ***P = 0.0006. N = 7 mice per group. Boxplots represent median and interquartile range.
Extended Data Fig. 8
Extended Data Fig. 8. Long-term activation of VMPOLepR by chemogenetic (Gq-DREADD) or optogenetic (ChR2) conditioning is sufficient to induce heat tolerance in the heat endurance assay.
a, Viral injection of Cre-dependent Gq-DREADD into the rostral POA of LepR-Cre mice. VMPOLepR neurons were chemogenetically activated (conditioned) by daily injection of CNO (0.3 mg/kg i.p.) for 1, 5 or 10 consecutive days. CNO injections were terminated 24 hours prior to heat endurance assay. b, Chemogenetic conditioning of VMPOLepR cells via Gq-DREADD animals produced significant hypothermia that is protracted for up to 10 hours after CNO injection and could be repeated over multiple consecutive days. Traces represent group average (mean ± s.e.m.) for each day of CNO injection. N = 4 animals. c, All animals that were chemogenetically conditioned for 10 days passed the heat endurance assay. Animals that reached the cut-off temperature, demarcated by the dashed red line, were discontinued from the assay. d, Boxplots (median and IQR) showing endurance times (tE) before reaching 41.5 °C, corresponding to (c). The maximum tE was 9 hours (540 min, red dashed line). All chemogenetically conditioned animals for 10 days reached this maximum. Kruskal-Wallis test (H = 12.67, d.f = 3, P = 0.0006) with Sidak’s multiple comparison test, *P = 0.0312 **P = 0.0034. N = 5 for Control (animals that received saline injections for 10 days), N = 4 for ‘1 day’ (a single CNO injection), N = 4 for ‘5 day’ (5 days of CNO injections) and N = 5 for ‘10 day’ (10 days of CNO injections). e, Left: Representative traces of AP firing patterns of two VMPOLepR neurons recorded 24 hours after chemogenetic conditioning for 5 or 10 days. Right: average AP firing frequency (mean ± s.e.m.) of VMPOLepR neurons from non-stimulated control LepR-Cre;HTB animals and from animals chemogenetically conditioned for 5 or 10 days. Kruskal-Wallis test (H = 17.56, d.f = 2, P < 0.0001) with Dunn’s pairwise comparisons and Bonferroni corrections, ***P < 0.0001 (Control: 10d cond.). n = 42/4 cells per group. Neuronal recordings were performed without synaptic blockade, using ‘low-K+ aCSF’ and at 33 °C. f, Average body-, brown adipose- (BAT-) and tail temperature of LepR-Cre mice (N = 3) expressing Cre-dependent ChR2 and stimulated with blue light at a low frequency of 1 Hz at room ambient temperature (23 °C). g, Optogenetic control experiment: in the absence of ChR2, light stimulation of the POA/VMPO of up to 20 Hz continuously for 4 hours did not affect body temperature in freely moving mice (N = 4). h, Average body temperature (mean ± s.e.m.) during heat endurance of LepR-Cre mice expressing ChR2 in VMPOLepR neurons that were either not optogenetically conditioned (control, light blue trace), conditioned for 1 day (1d opto, blue trace) or 3 days (3d opto, dark blue trace). All mice were optically stimulated with light pulses at 1 Hz during the heat endurance assay. N = 4 animals each.
Extended Data Fig. 9
Extended Data Fig. 9. NaV channel current characteristics and gene expression in VMPOLepR neurons.
a, Left: example traces of resurgent NaV currents recorded in acclimated and non-acclimated VMPOLepR neurons. Inset: voltage step protocol used to record the resurgent current. Right: Current-voltage relationship for VMPOLepR resurgent NaV current (mean ± s.e.m.). Two-way ANOVA (effect of acclimation * voltage), P < 0.0001; Tukey’s multiple comparison test, **P = 0.0041 (Non-accl.:Accl. at -40 mV). n = 10/2 (Non-accl.), n = 11/2 (Accl.) cells. b, Left: Riluzole reduced and ICA121431 did not affect the TTX-sensitive resurgent NaV current present in acclimated VMPOLepR cells. One-way ANOVA, P < 0.0001; Tukey’s multiple comparison test, *P = 0.0409 (Accl. ctrl : Riluzole), ***P < 0.0001 (Accl. ctrl : TTX), **P = 0.0033 (Riluzole : TTX), ***P = 0.0002 (ICA121431 : TTX). n = 9/2 (Accl. ctrl), n = 10/2 (Riluzole), n = 7/2 (TTX), n = 9/2 (ICA121431). Shown as mean ± s.e.m. Right: Example traces of resurgent NaV currents at different potentials (-70 mV / blue, −40 mV / violet and +10 mV / beige) recorded in the acclimated condition and in the presence of Riluzole (10 µM), TTX (1 µM) or ICA121431 (200 nM). c, Left: Traces of INaP (mean ± s.e.m.) in non-acclimated VMPOLepR neurons whereby TTX reduced the current but Riluzole did not have a significant effect. Right panel: quantification of INaP at −35mV based on presented traces. One-way ANOVA, P = 0.015; Tukey’s multiple comparison test, *P = 0.0117 (Non-accl. : Non-accl.+TTX). n = 6/2 (Non-accl.), n = 6/2 (Non-accl.+Riluzole) and n = 6/2 (Non-accl.+TTX) cells. d, Quantification of peak amplitude (mean ± s.e.m.) and example traces of transient NaV currents recorded in acclimated VMPOLepR neurons (based on the initial depolarizing step used in resurgent NaV current recording protocol shown in (a)) with and without Riluzole. n = 12/2 (Accl.) and n = 11/2 (Accl. + Riluzole). Riluzole (10 µM) was found to not affect the amplitude of transient NaV currents. e, Firing frequency of non-acclimated VMPOLepR cells was not affected by Riluzole. n = 15/5 (Non-accl.) and n = 14/1 (Non-accl. + Riluzole). Boxplots represent median and interquartile range. f, Expression analysis of TTX-sensitive NaV channels after Fluorescence-Activated Cell Sorting (FACS) of VMPO LepR+ and LepR- cells obtained from non-acclimated and acclimated LepR-Cre;HTB mice; n = 5/3 (samples/mice); mRNA sequencing results of pooled cells are plotted as normalized log2 values. Boxplots represent median and interquartile range. g, Quantification of INaP amplitude (mean ± s.e.m.) at −35 mV recorded in acclimated VMPOLepR neurons in the presence of the selective NaV channel blockers Phrixotoxin-3 (100 nM), 4,9-Anhydrotetrodotoxin (50 µM), ProTx-II (30 nM) and PF-05089771 (150 nM). One-way ANOVA, P = 0.0471; Tukey’s multiple comparison test, P = 0.0676 (Accl.:PF-05089771). n = 10/2 (Accl.), n = 9/2 (Phrixotoxin-3), n = 6/2 (4,9-Anhydrotetrodotoxin), n = 8/2 (ProTx-II) and n = 10/2 (PF-05089771) cells. h, i, Neither PF-05089771 (h) nor NaV1.7 knock-down via shRNA AAV (i) affected AP firing frequency in acclimated VMPOLepR neurons. n = 20 cells each for PF-05089771 and respective controls; n = 11 and n = 15 cells for NaV1.7 shRNA and controls respectively. Boxplots represent median and interquartile range. Image in (i) demonstrates the AAV9-pCAG-FLEX-EGFP-mir30(Scn9a) viral construct expression in LepR-cre mouse VMPO; scale bar 100 um. Brain slice recordings were conducted at 36 °C bath temperature with the exception of panel (h) where ‘low-K+ aCSF’ and 33 °C bath temperature were used.
Extended Data Fig. 10
Extended Data Fig. 10. Validation and electrophysiological characterization of Nav1.3 knock-down.
a, Left: in order to test the efficacy of shRNA against the NaV1.3 mRNA, Cre-dependent shRNA-carrying AAVs were co-injected together with AAV encoding the Cre recombinase into the POA of C57/BL6 mice. Following 3 weeks of virus expression, mRNA was extracted from the POA tissue. Non-injected C57BL/6 mouse POA tissue served as control. Right: boxplot (median and interquartile range) of relative NaV1.3 mRNA expression normalized to the housekeeping genes Tubb3 and Ube2l3 in mouse POA. Unpaired two-tailed t-test, *P = 0.0226. N = 3 (WT) and N = 6 (Scn3a shRNA) mice. b, Firing frequencies of non-acclimated VMPOLepR neurons expressing either scrambled shRNA (scram-Scn3a shRNA; n = 27/2) or functional shRNAs against Nav1.3 (Scn3a shRNA; n = 27/3) at 36 °C. Shown as median and interquartile range. c, Left: plot showing AP firing frequency vs regularity of firing in VMPOLepR neurons expressing either functional shRNAs against NaV1.3 / Scn3a mRNA or scrambled control. Right: quantification of the firing regularity between the two groups (plotted as mean ± s.e.m.). Unpaired two-tailed t-test, *P = 0.0226. n = 30/5 (Scn3a shRNA) and n = 17/3 (scram-Scn3a shRNA) cells. d, Firing frequencies of acclimated VMPOLepR neurons expressing either scrambled shRNA (scram-Scn3a shRNA; n = 19/3) or functional shRNAs against NaV1.3 (Scn3a shRNA; n = 47/7) at the three indicated bath temperatures. Individual cells are plotted in color; black lines represent linear regression for each group. Slope=temperature coefficient (TC) = 1.2651 for scram-Scn3a shRNA and TC = 0.0474 for Scn3a shRNA, demonstrating that NaV1.3 knock-down significantly reduced warm sensitivity of acclimated VMPOLepR. e, Example traces of spontaneous warm-sensitive activity of acclimated VMPOLepR expressing either scrambled or functional shRNAs against NaV1.3 recorded at 33 °C, 36 °C and 39 °C.

References

    1. Armstrong, L. E. & Stoppani, J. Central nervous system control of heat acclimation adaptations: an emerging paradigm. Rev. Neurosci.13, 271–285 (2002). - PubMed
    1. Barry, H. et al. Improved neural control of body temperature following heat acclimation in humans. J. Physiol.598, 1223–1234 (2020). - PubMed
    1. Horowitz, M. Heat acclimation: phenotypic plasticity and cues to the underlying molecular mechanisms. J. Therm. Biol.26, 357–363 (2001).
    1. Pierau, F. K., Sann, H., Yakimova, K. S. & Haug, P. Plasticity of hypothalamic temperature-sensitive neurons. Prog. Brain Res.115, 63–84 (1998). - PubMed
    1. Machado, N. L. S. & Saper, C. B. Genetic identification of preoptic neurons that regulate body temperature in mice. Temperature10.1080/23328940.2021.1993734 (2021). - PMC - PubMed

LinkOut - more resources