. 2025 Jan;28(1):105-121.
doi: 10.1038/s41593-024-01819-9. Epub 2024 Dec 9.

Dissociable control of motivation and reinforcement by distinct ventral striatal dopamine receptors

Affiliations

Dissociable control of motivation and reinforcement by distinct ventral striatal dopamine receptors

Juan Enriquez-Traba et al. Nat Neurosci. 2025 Jan.

Abstract

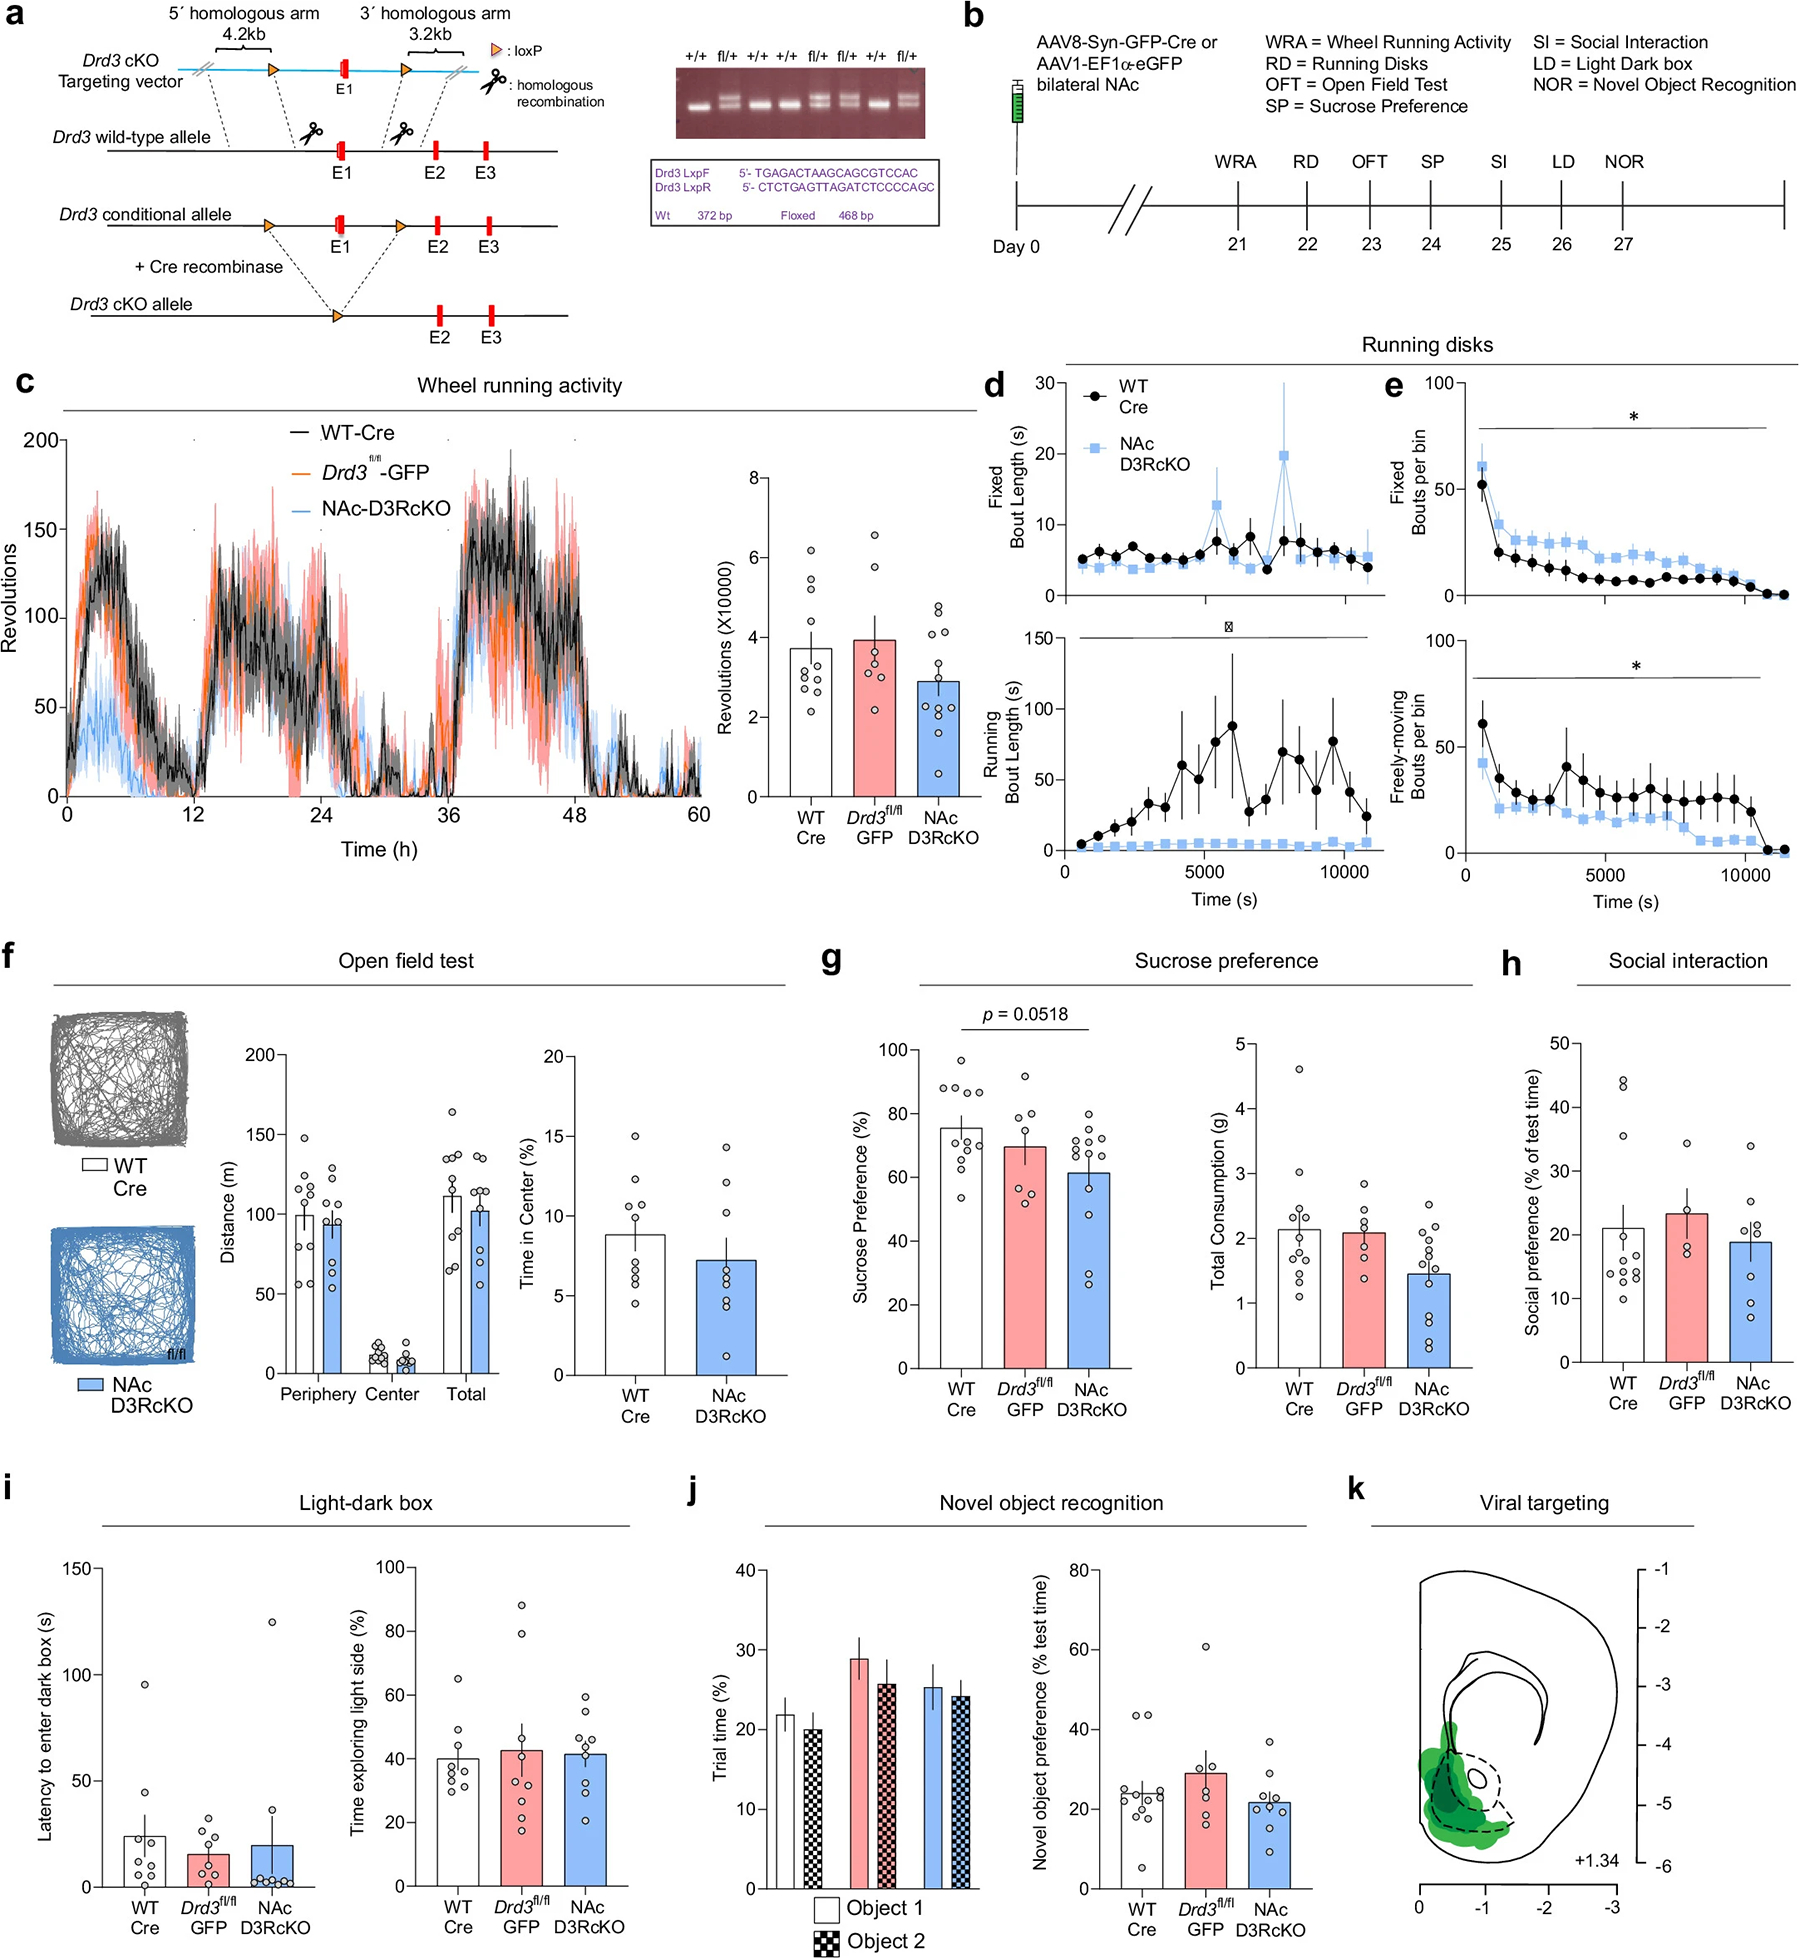
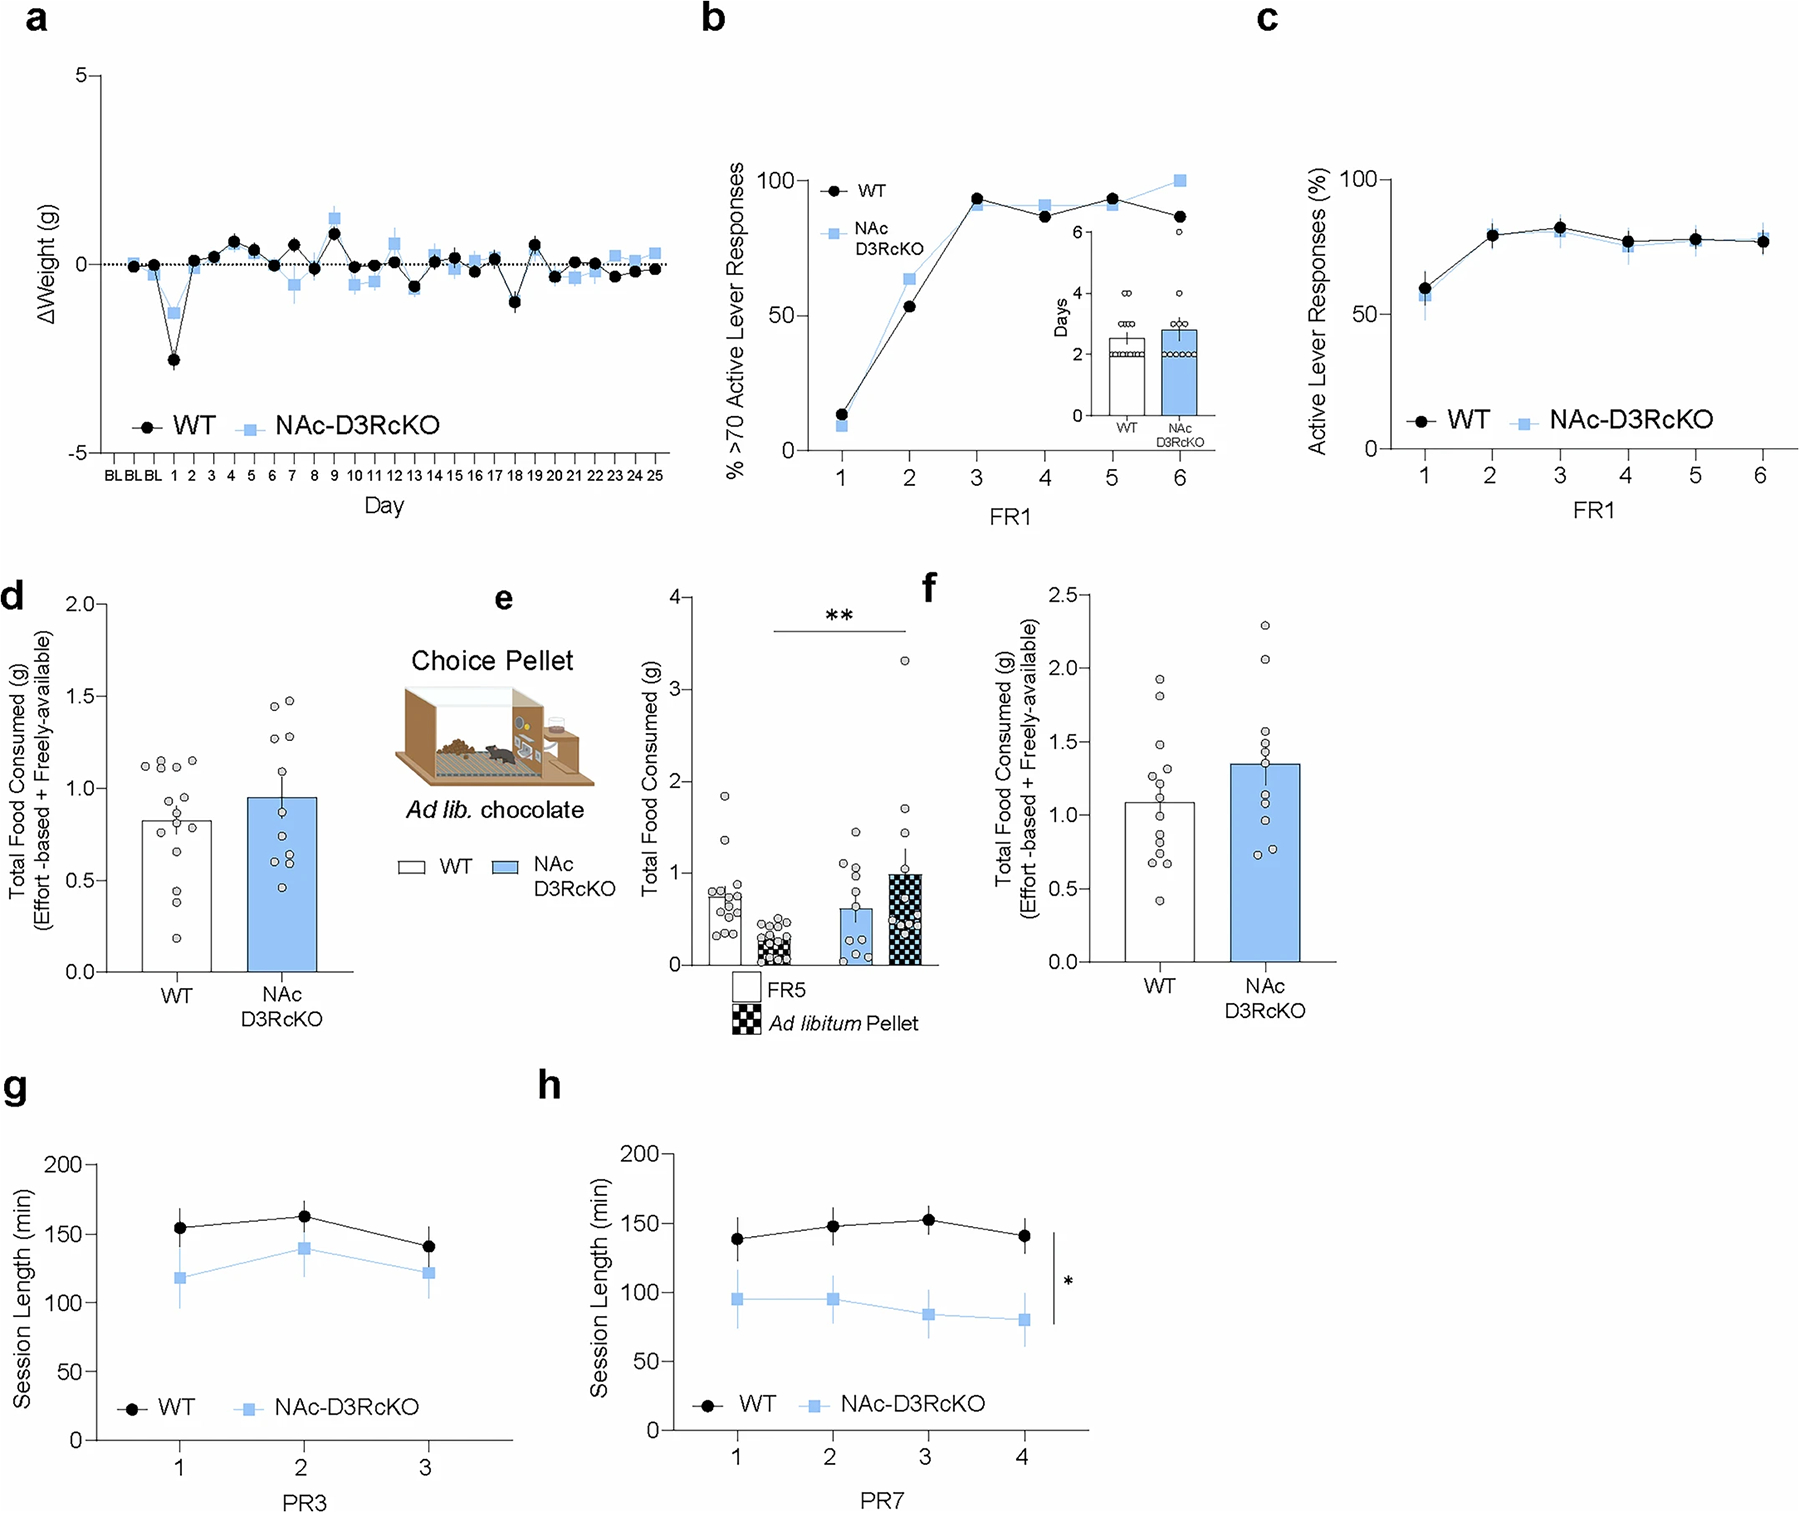
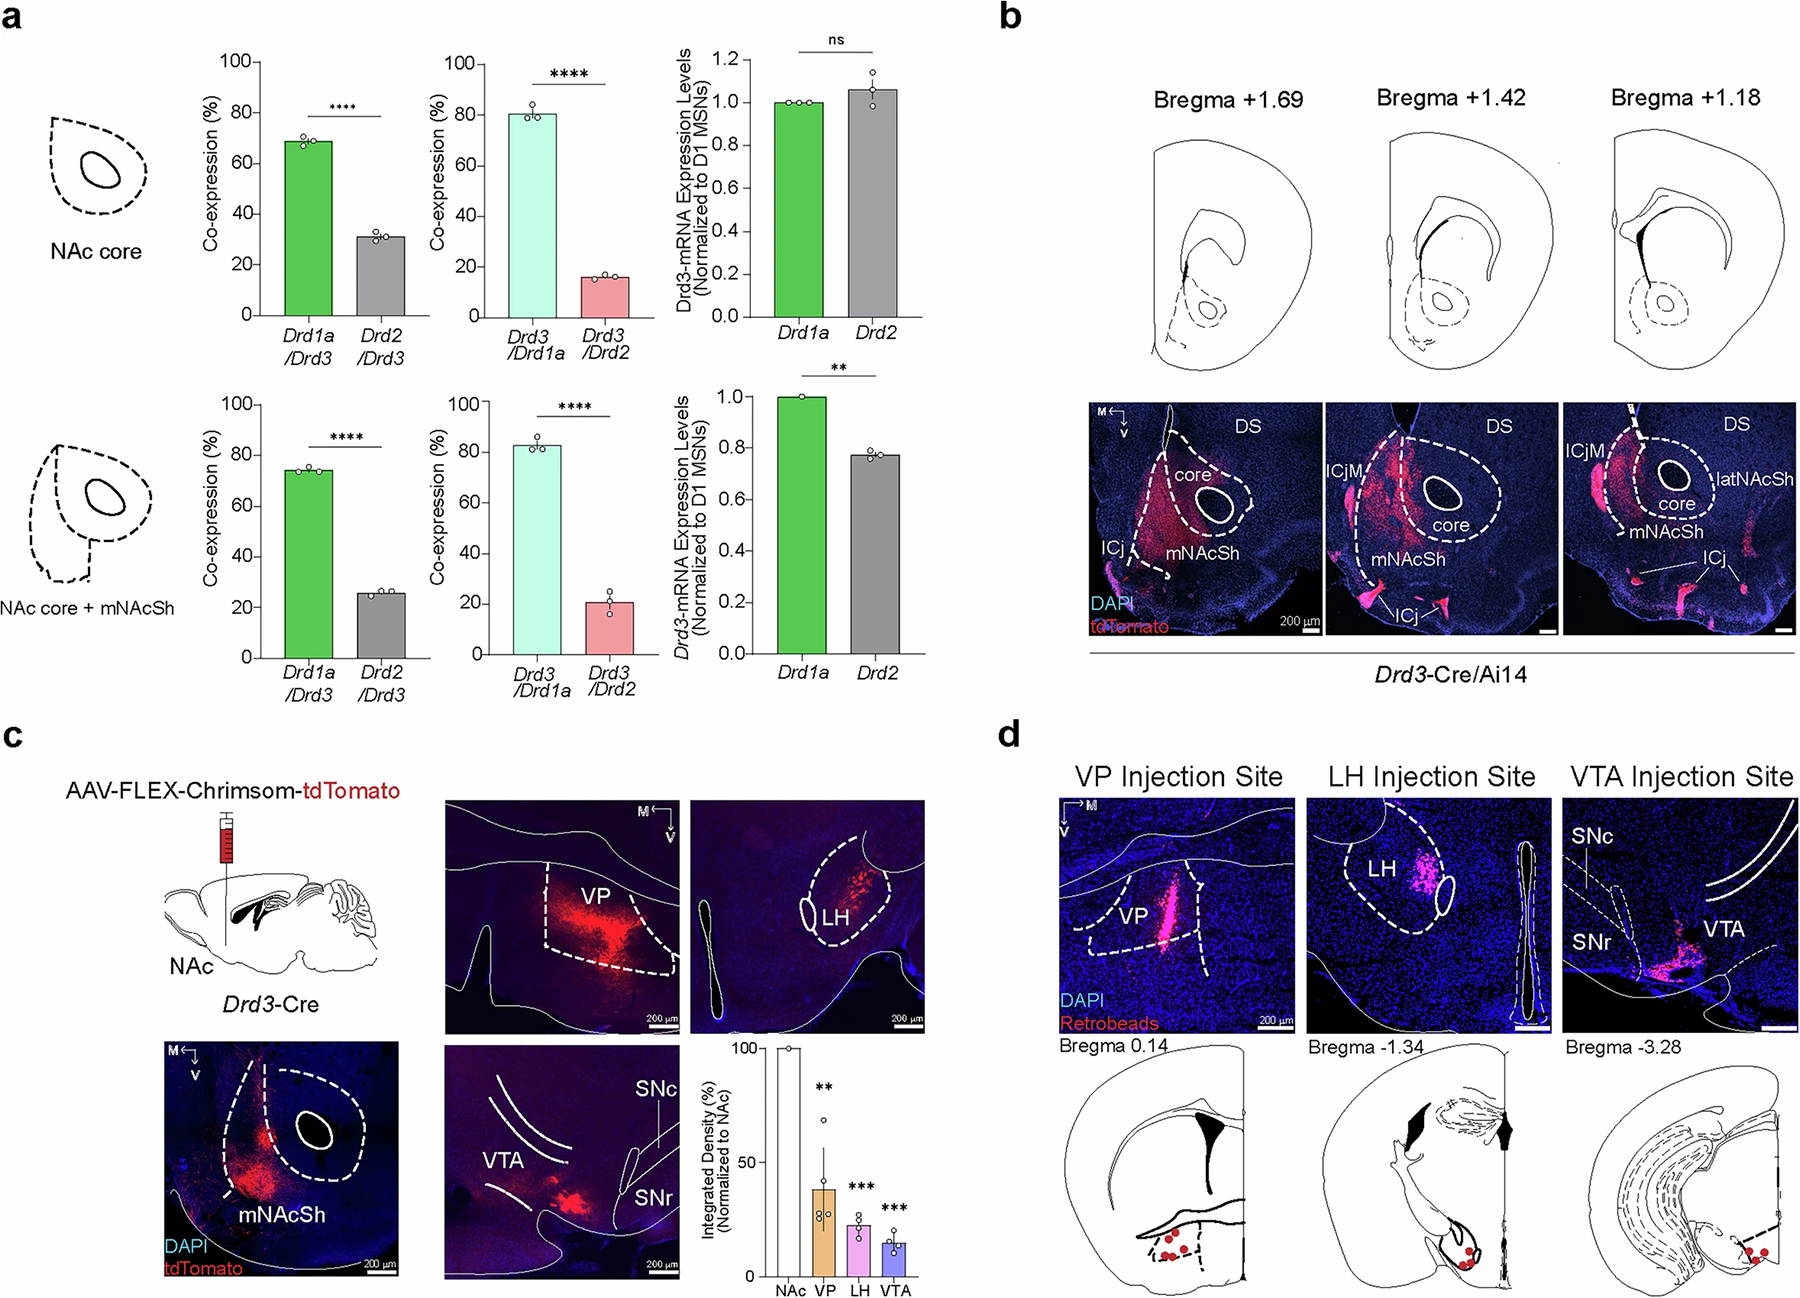
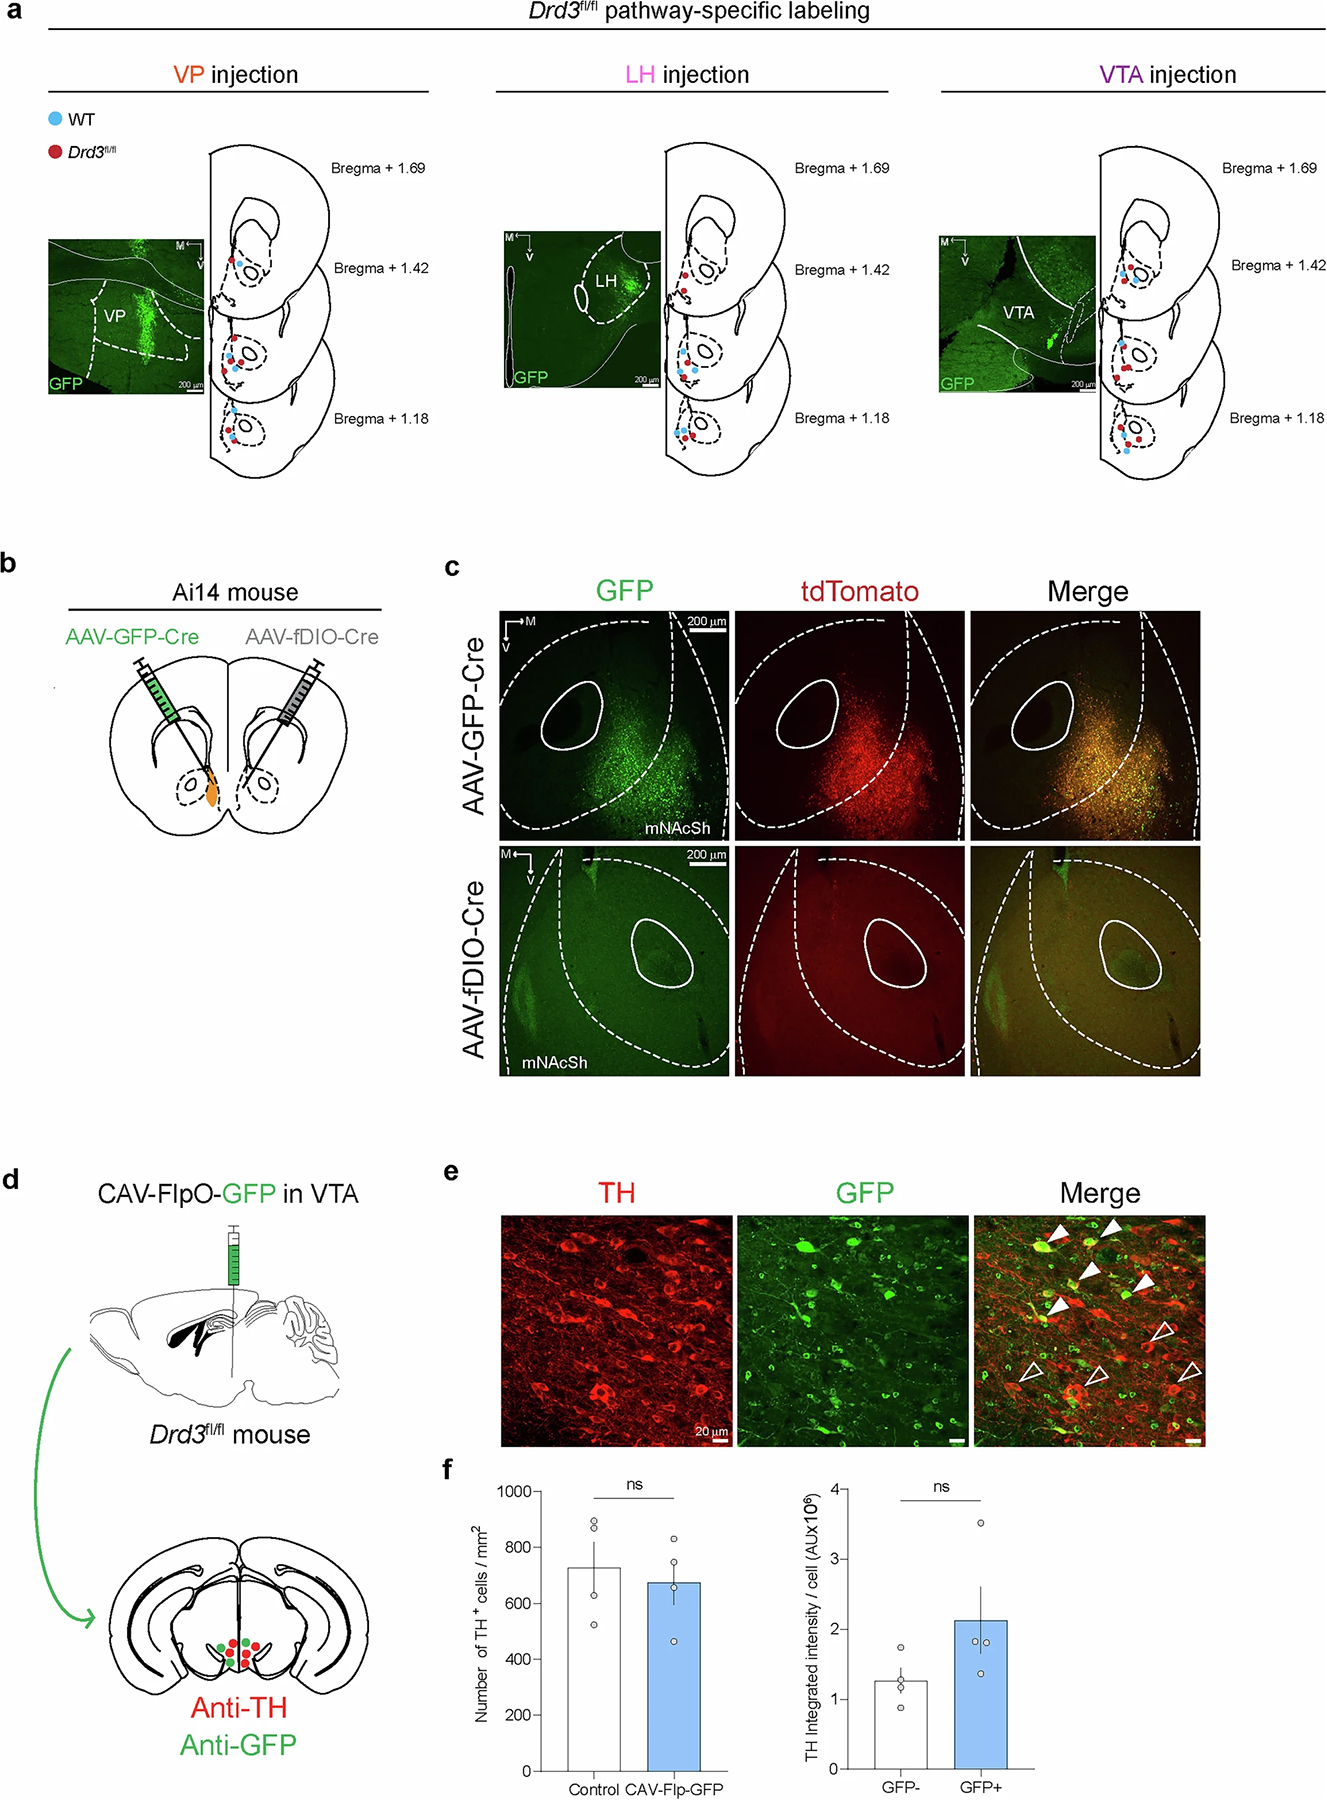
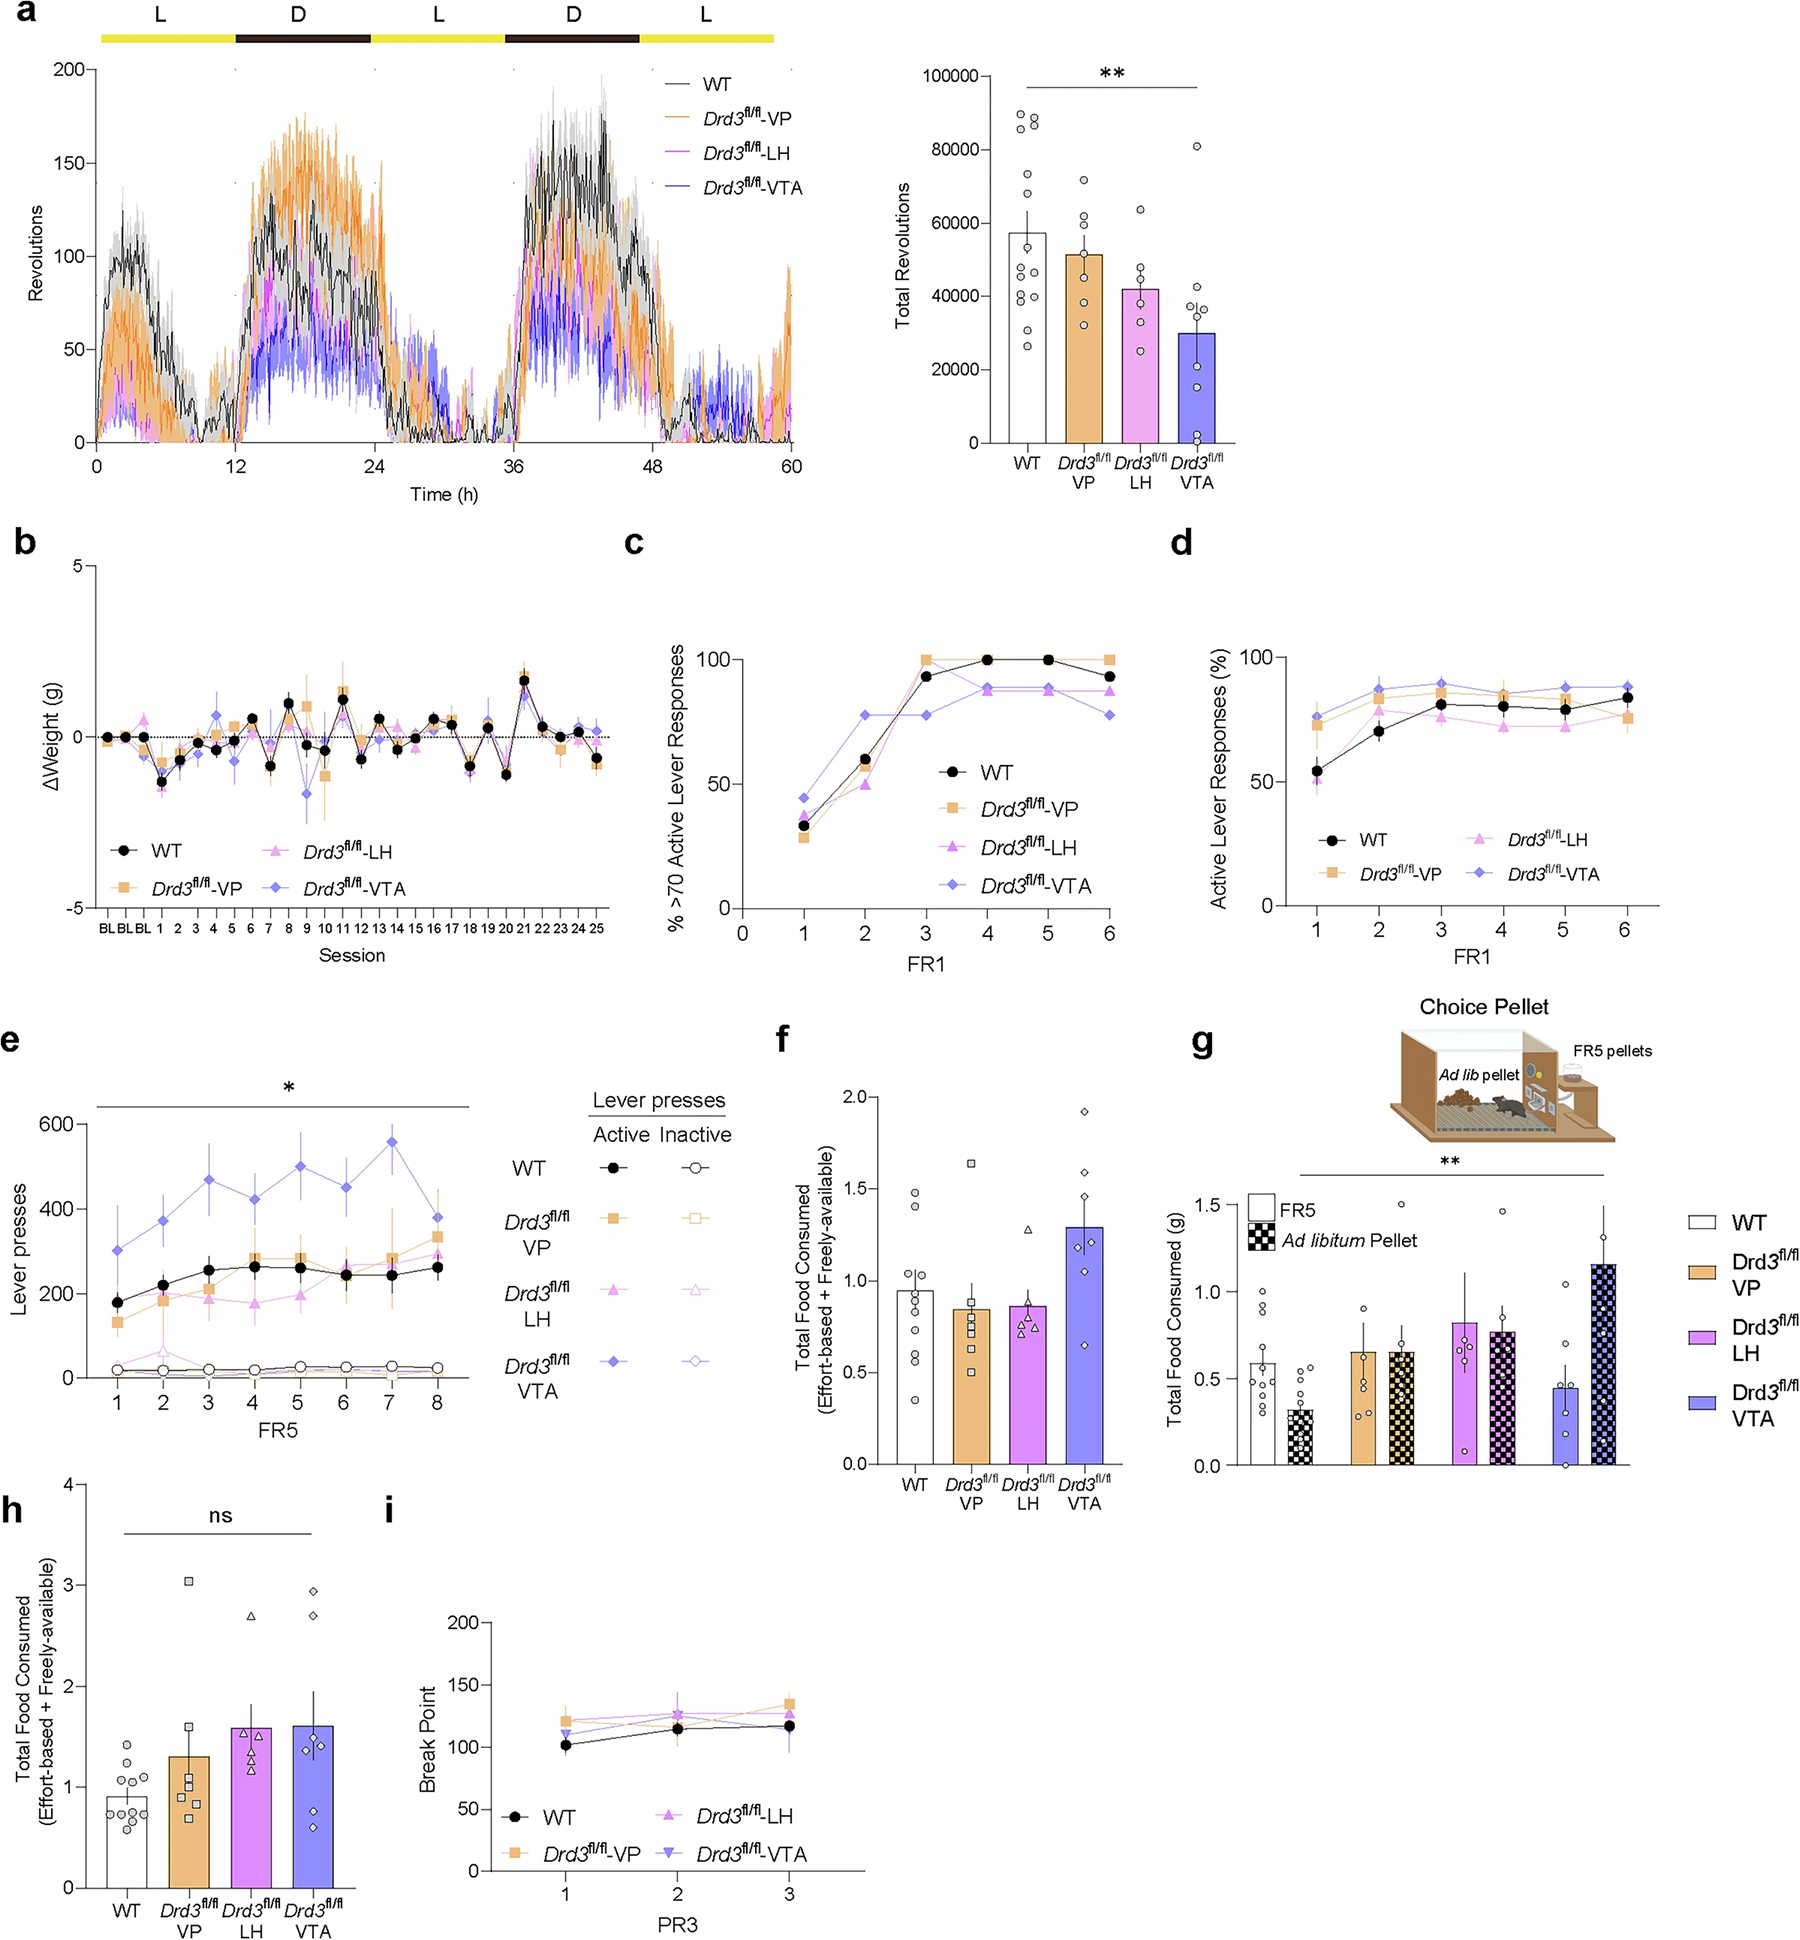
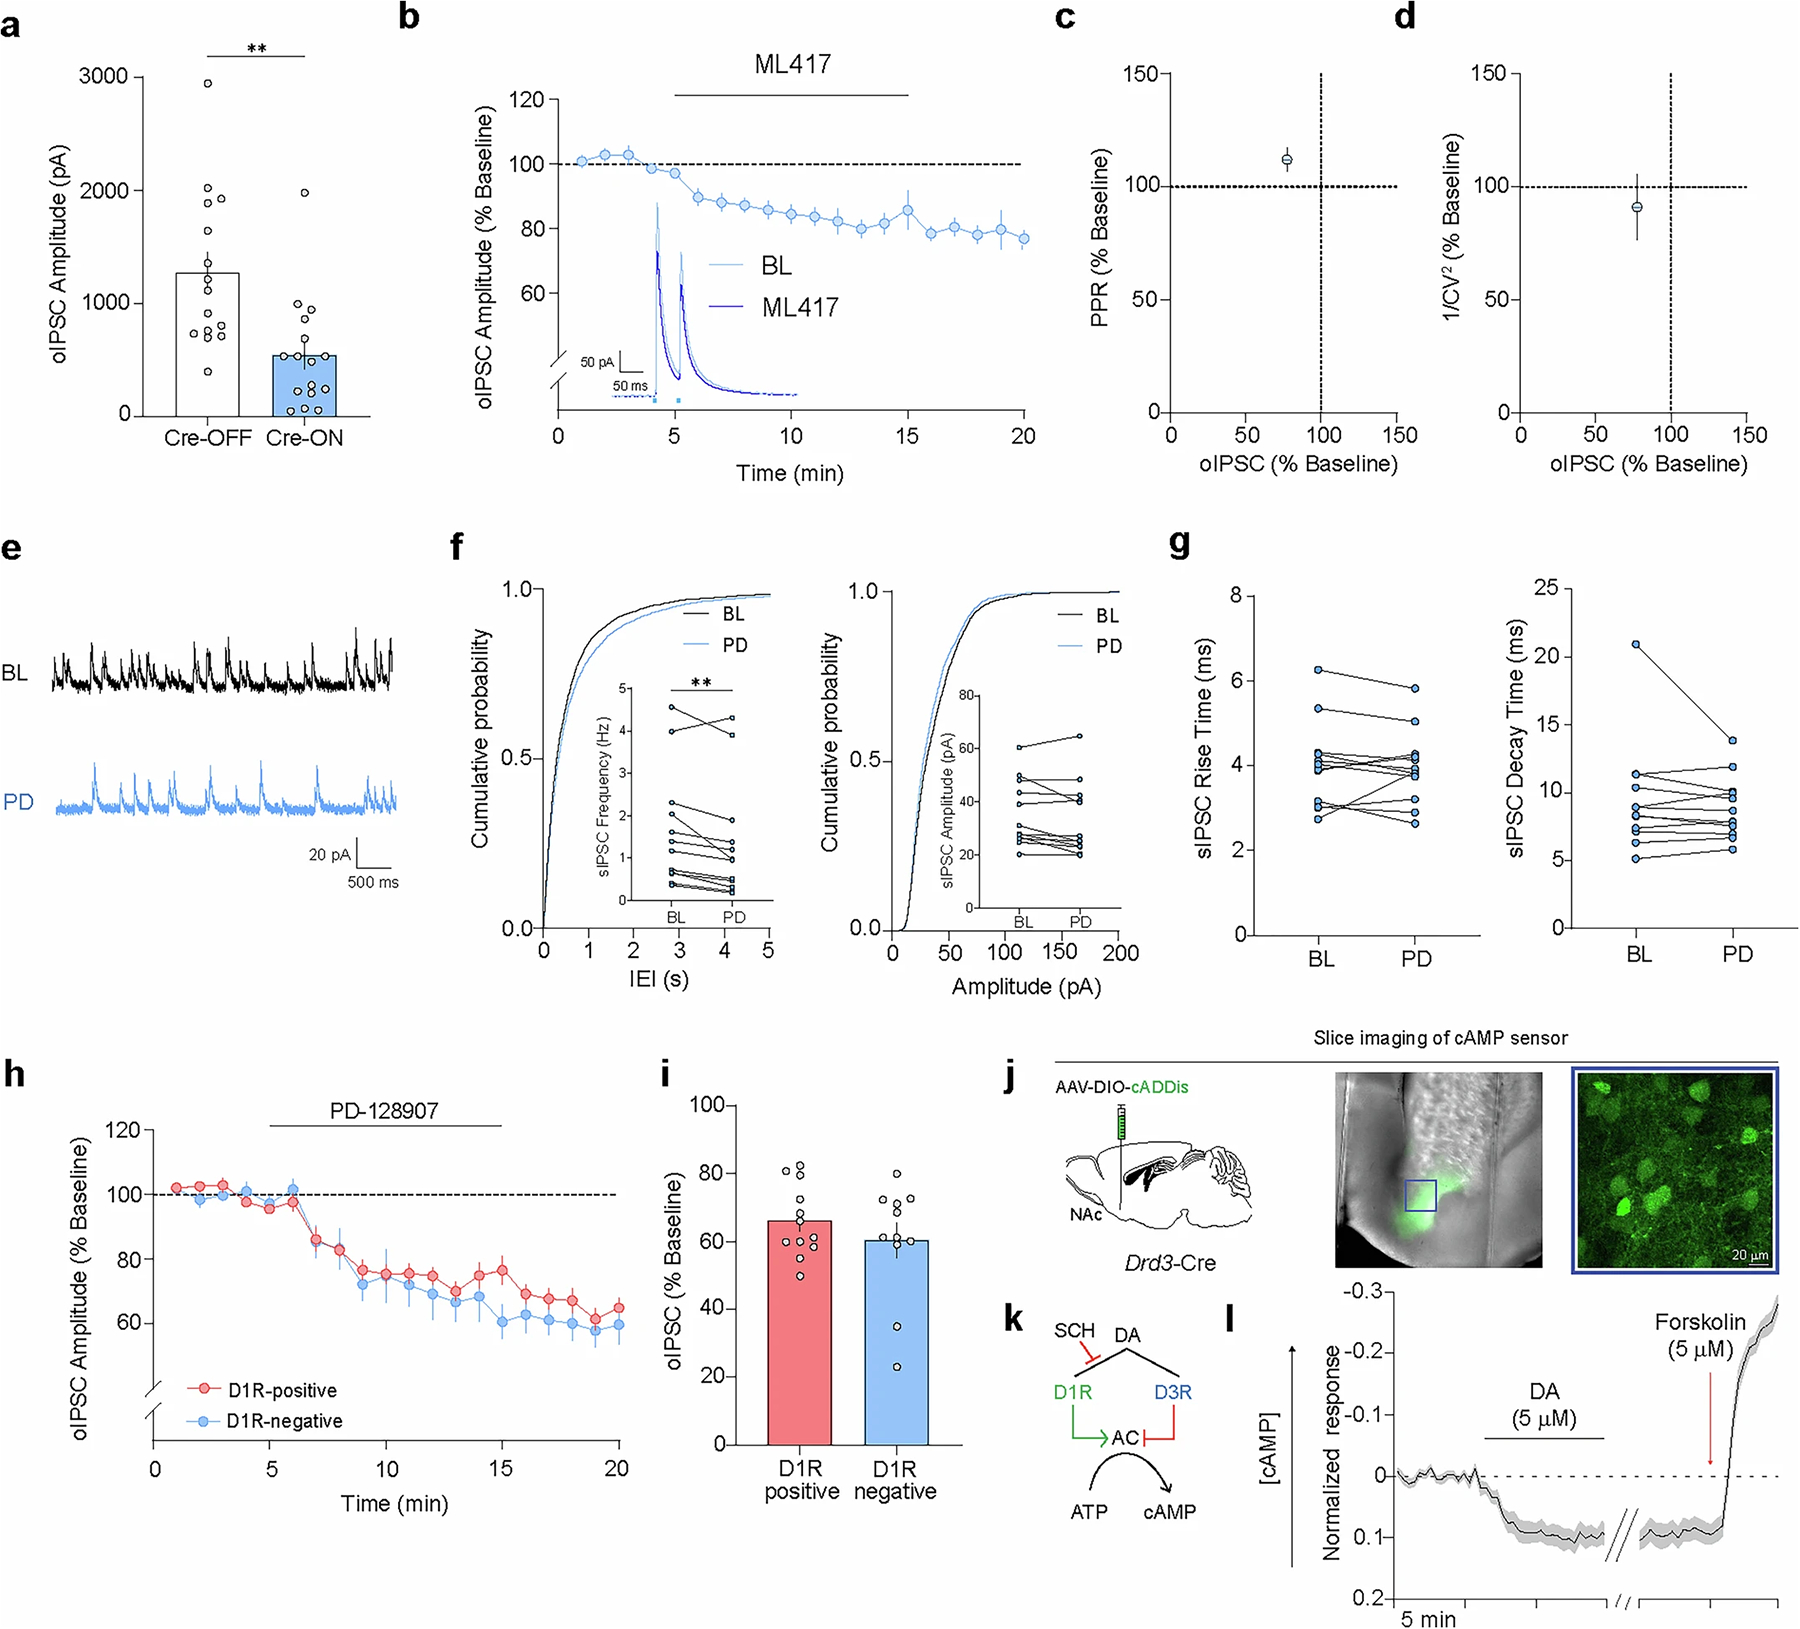
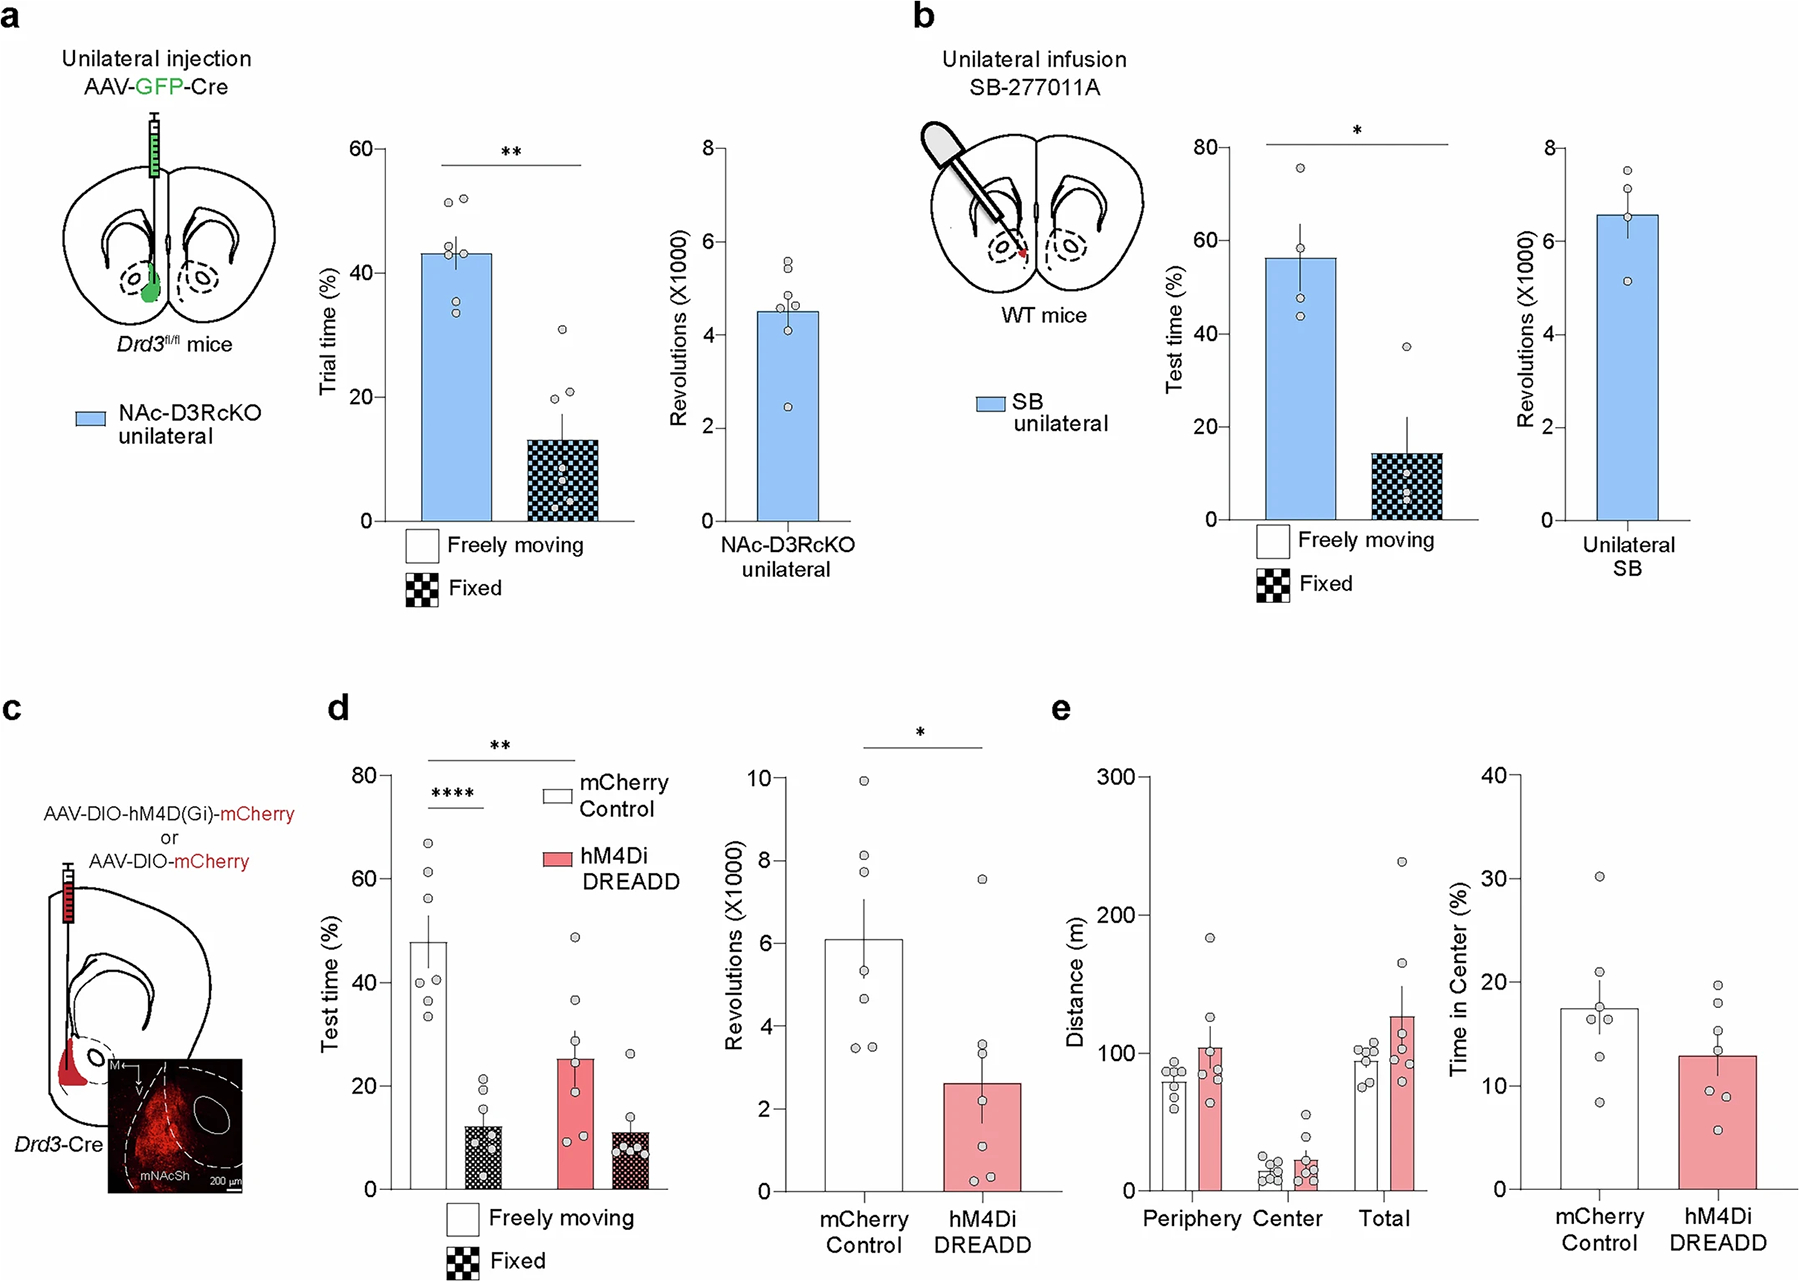
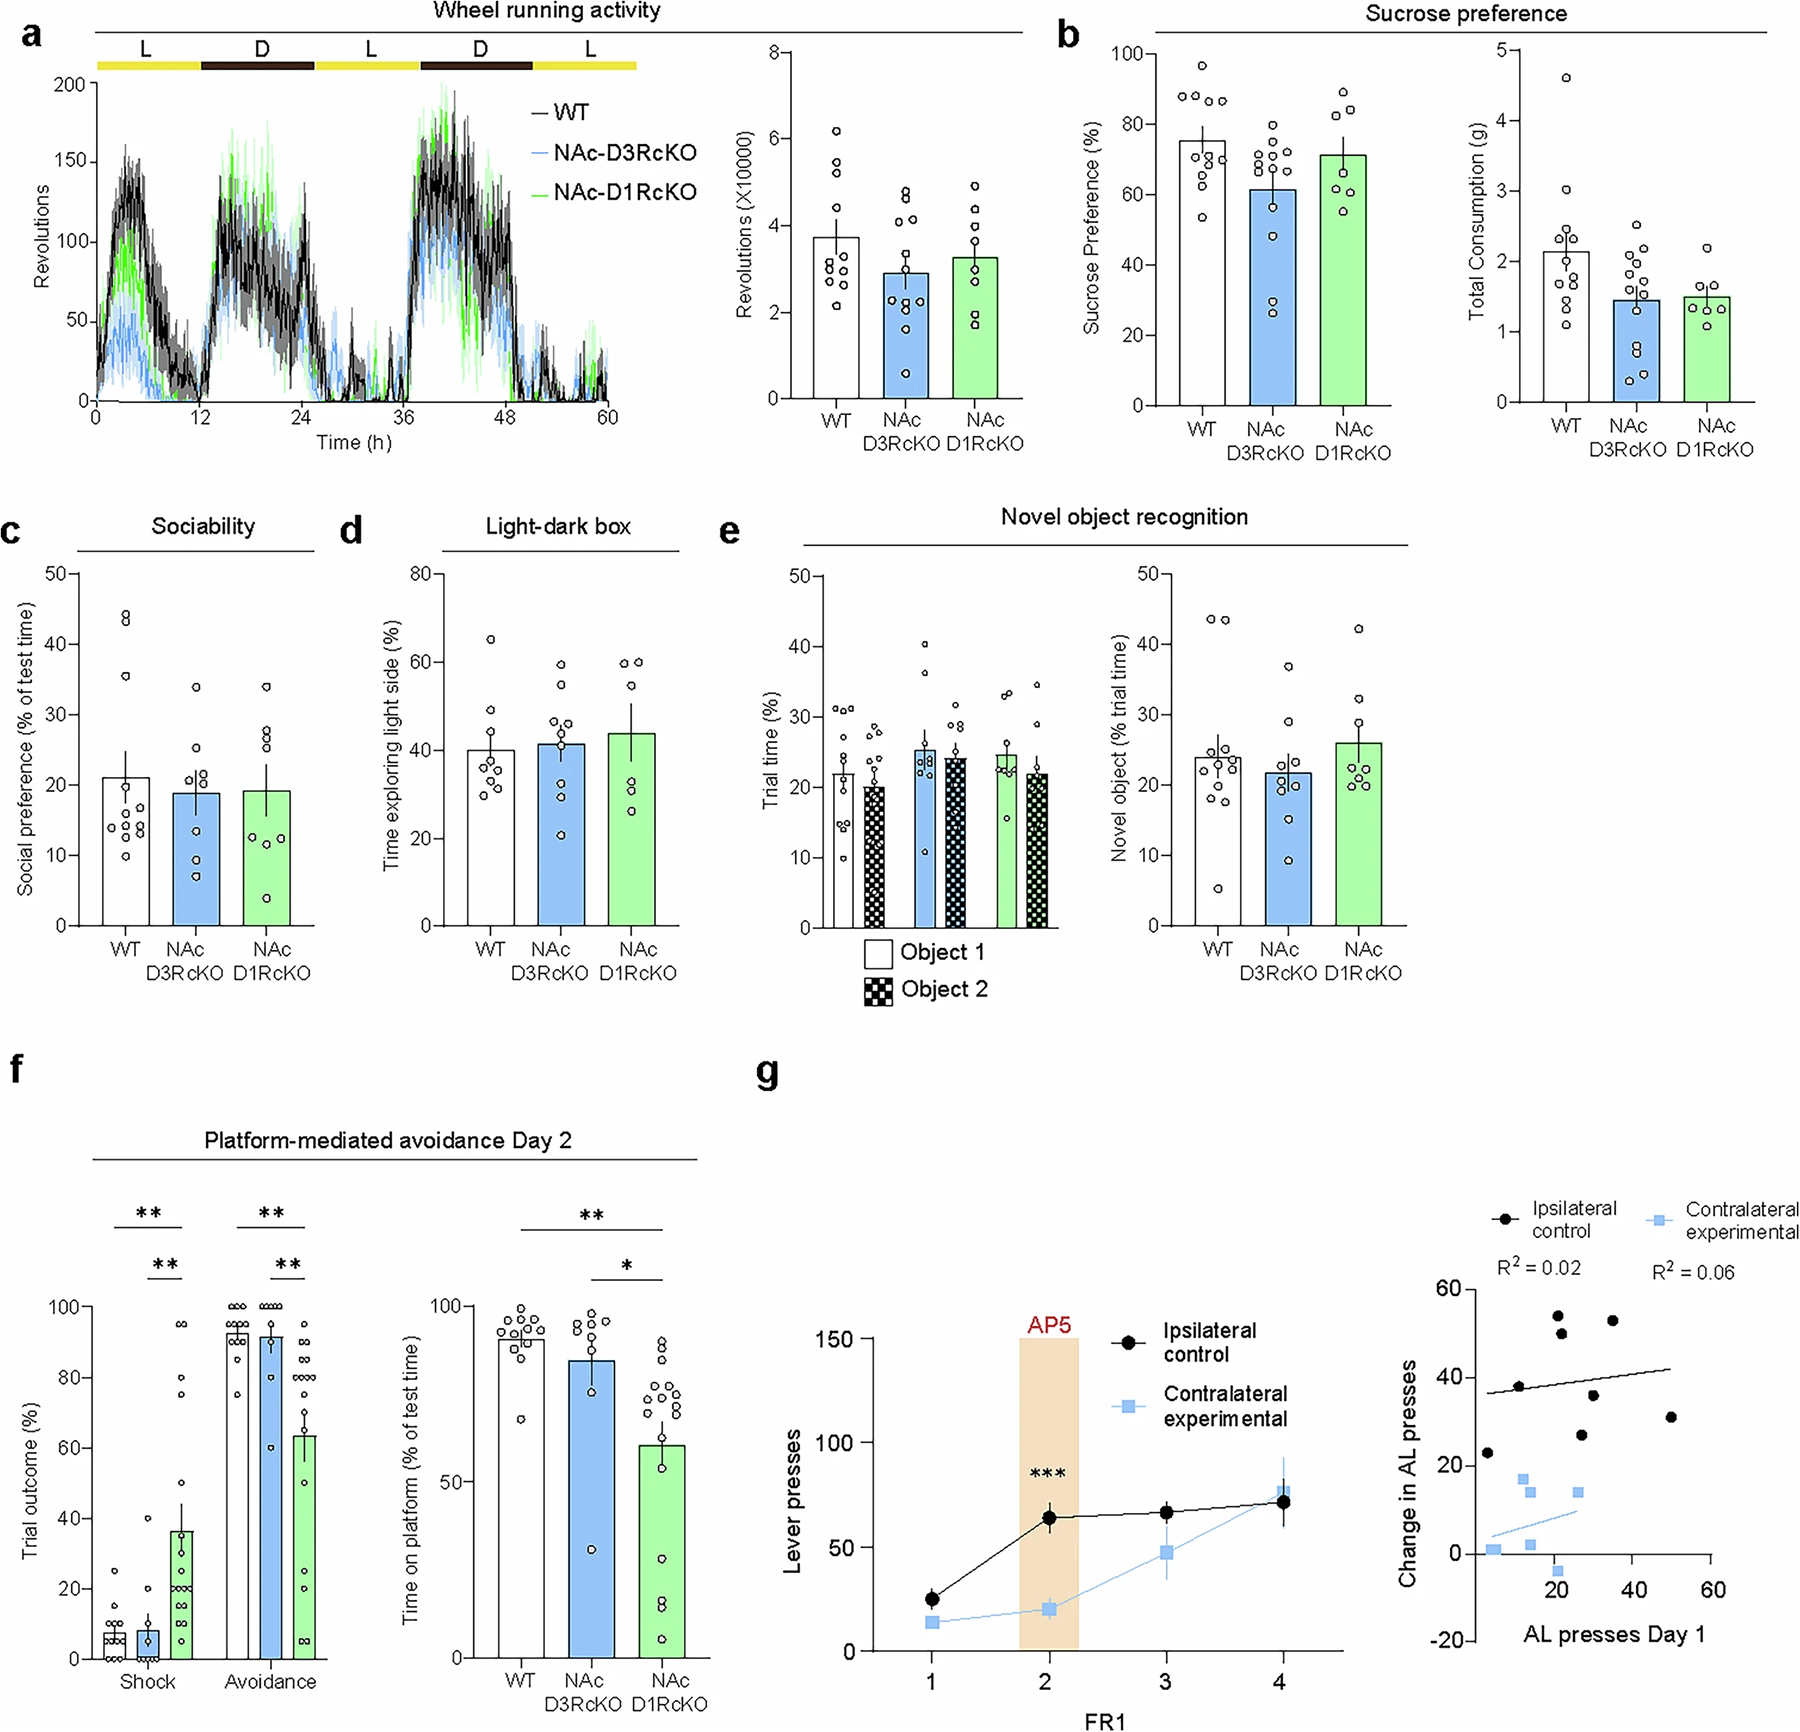
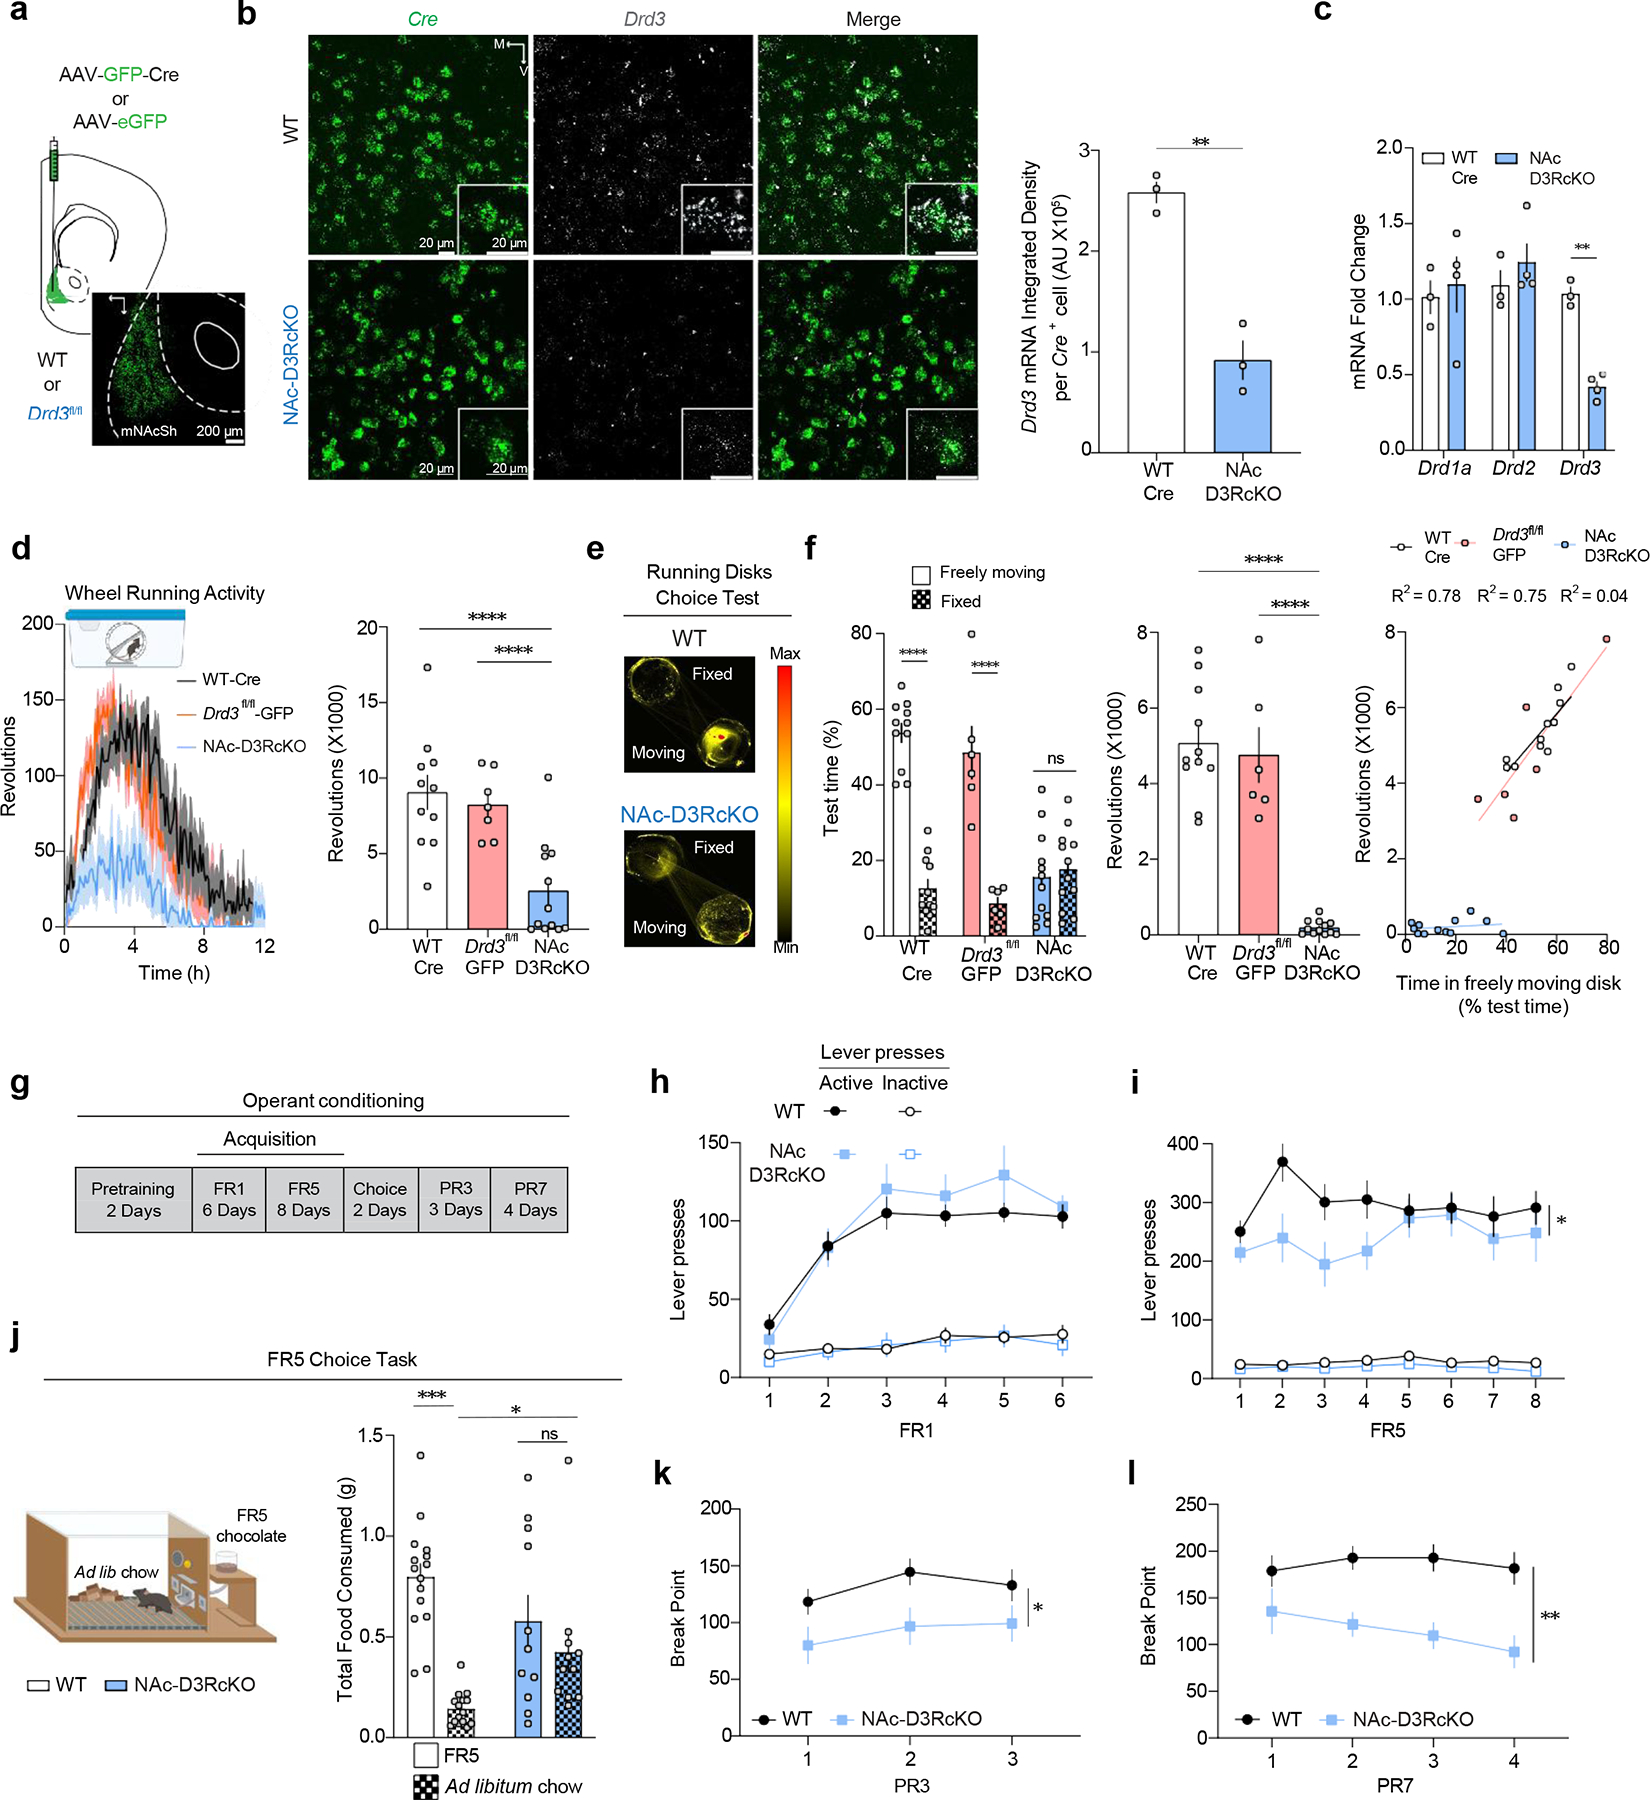
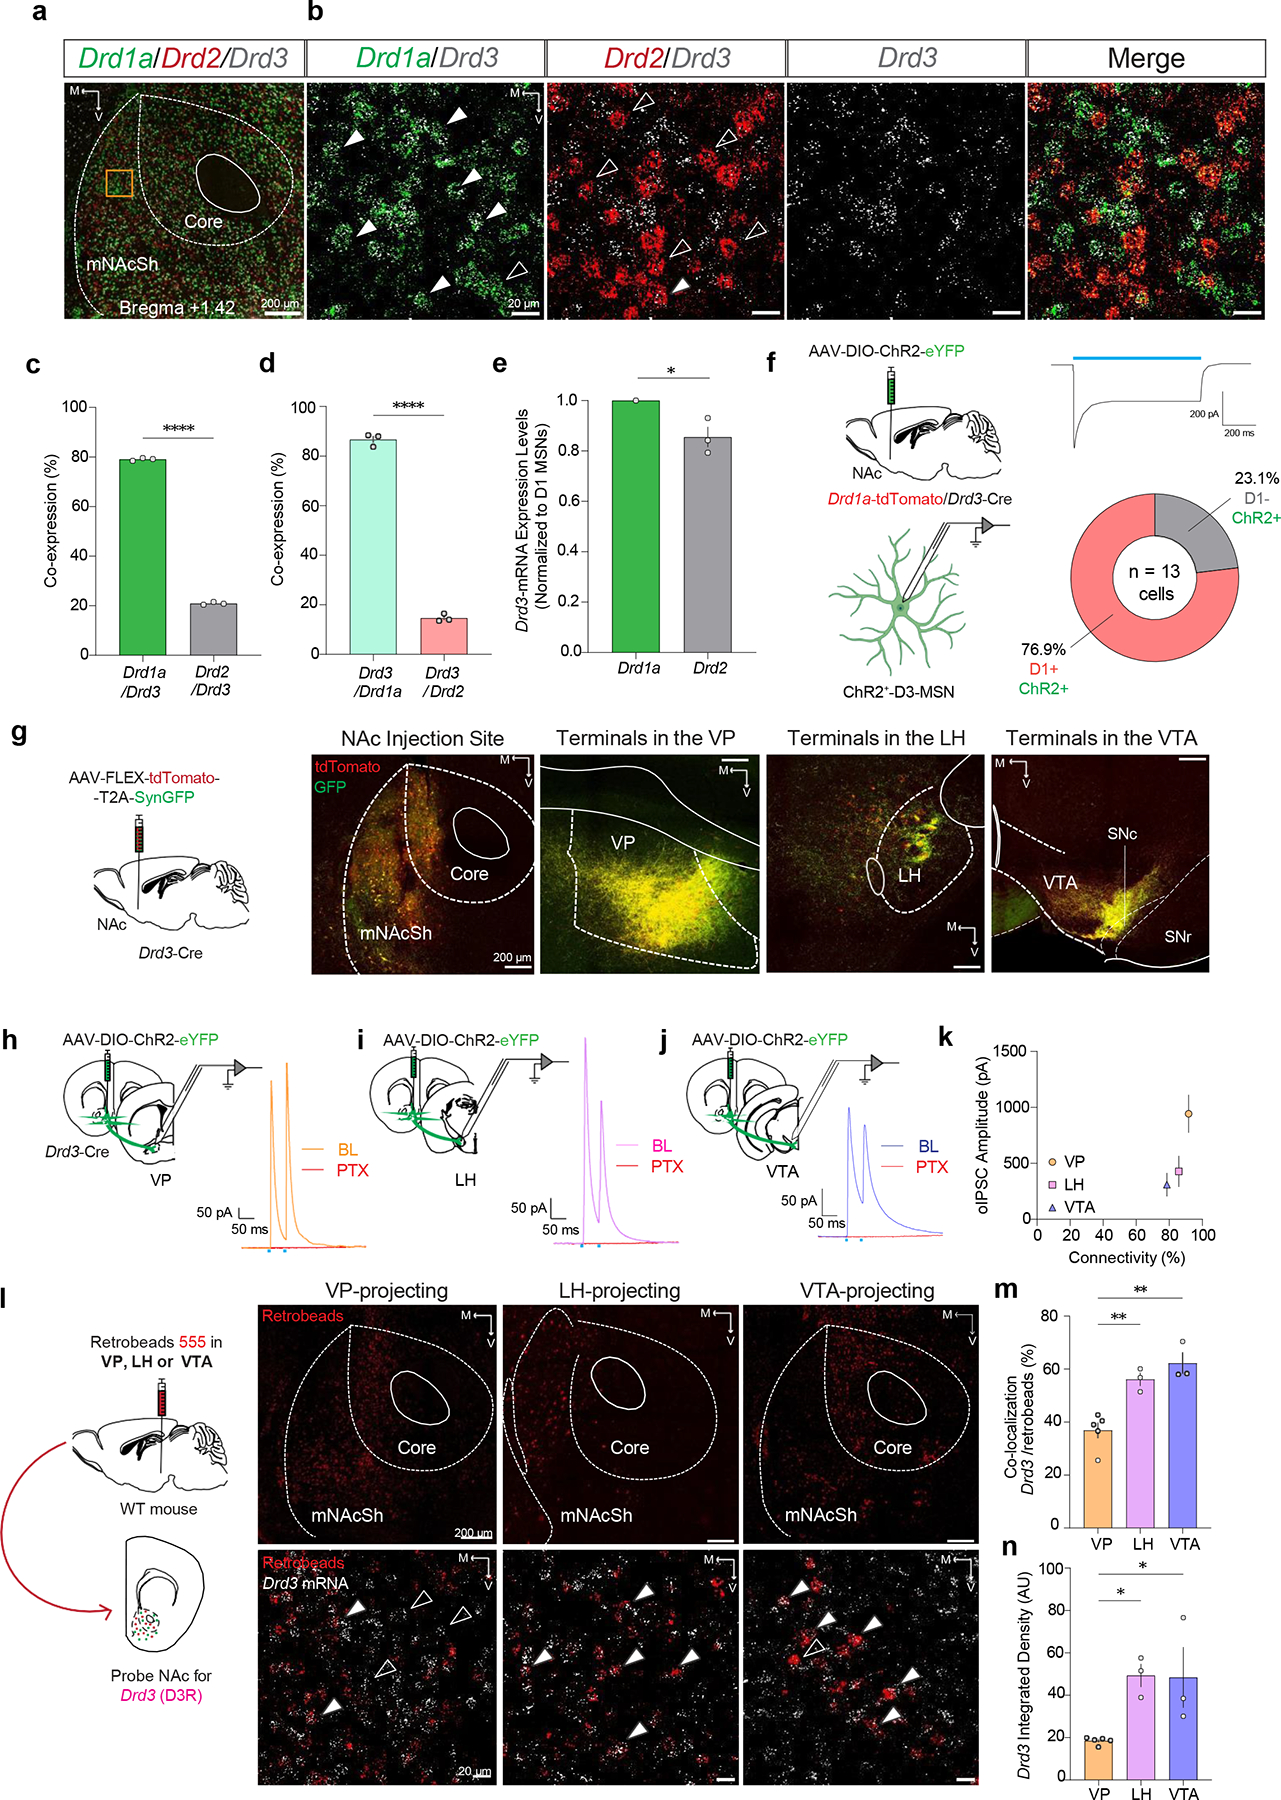
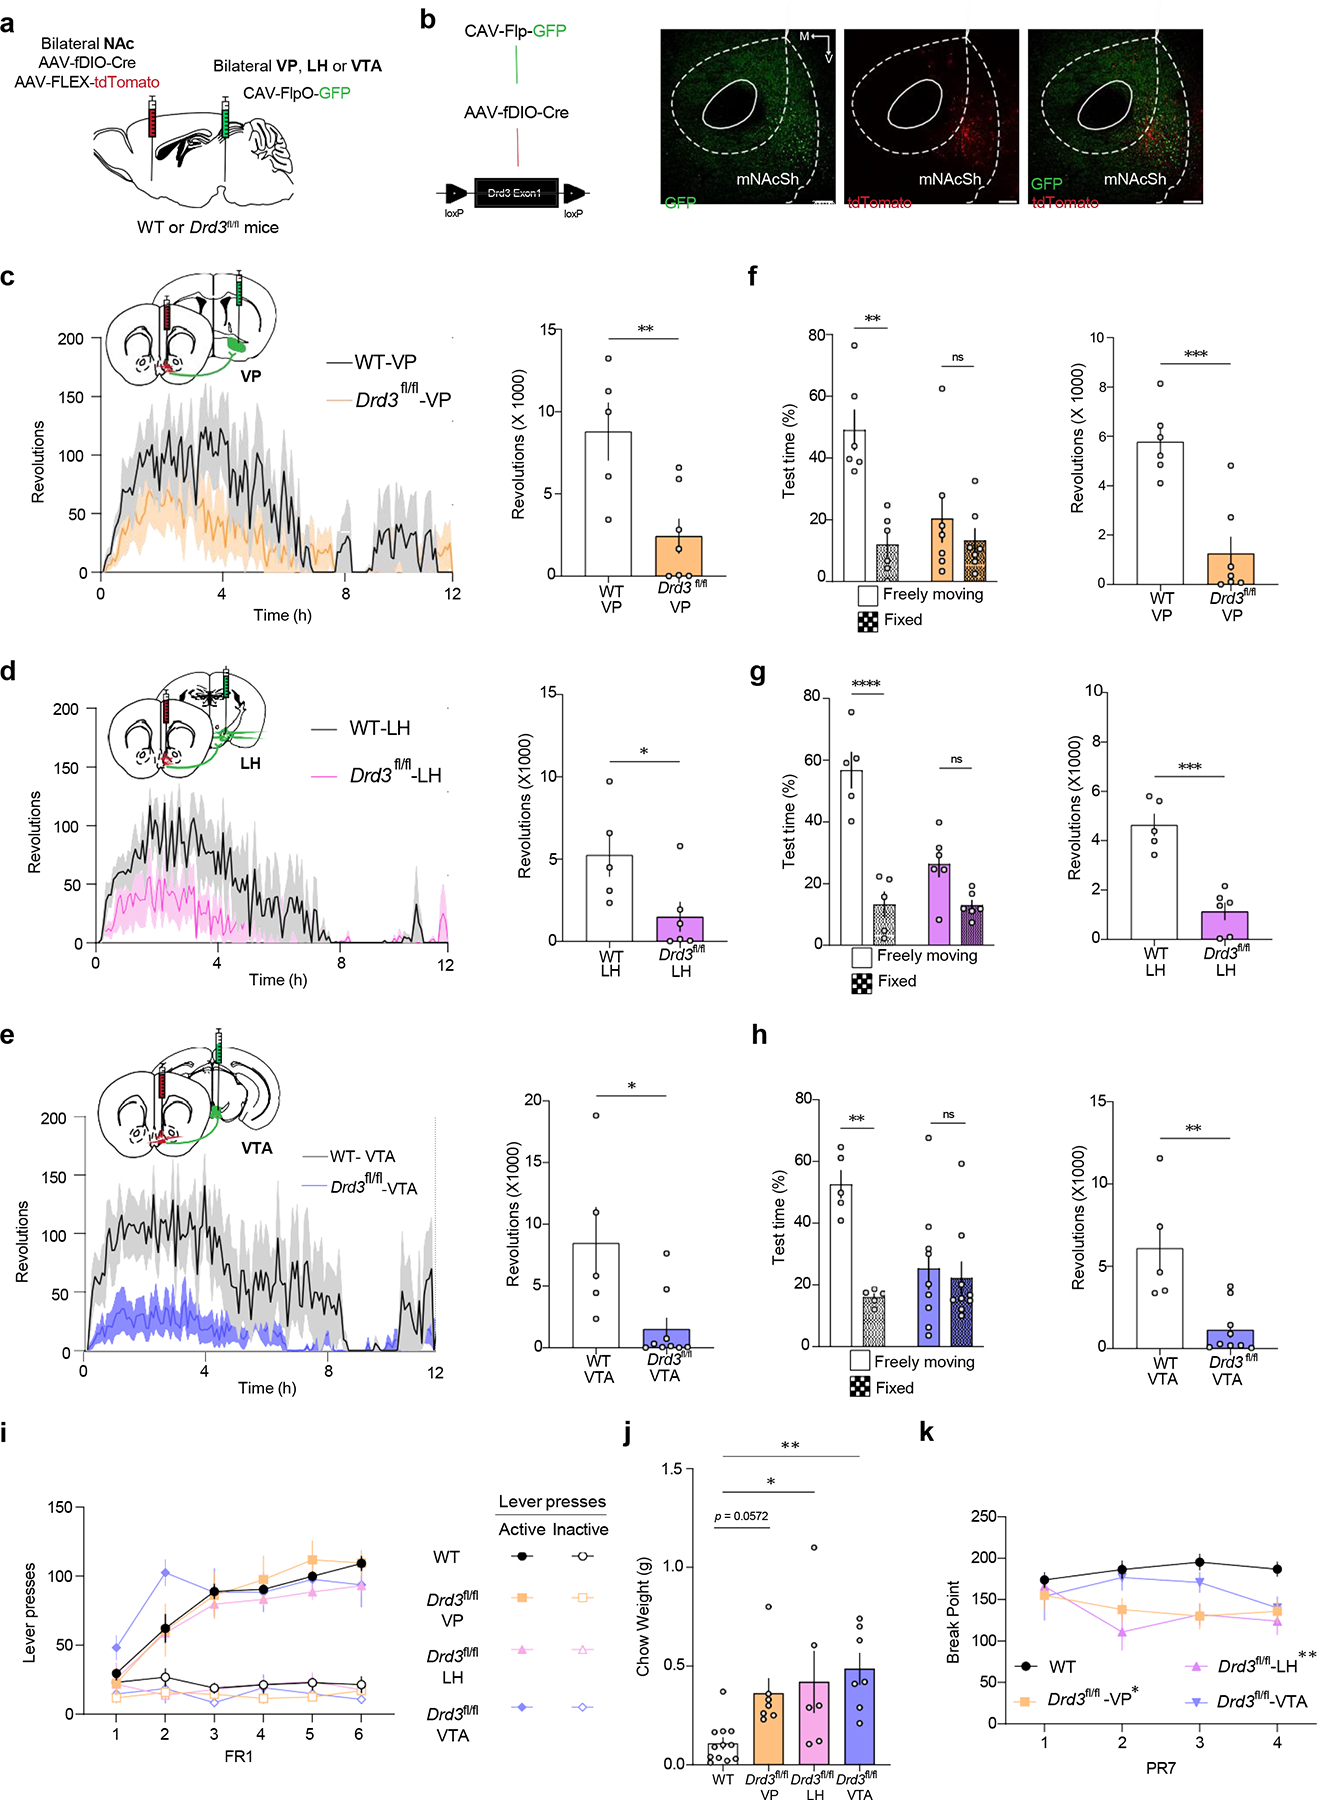
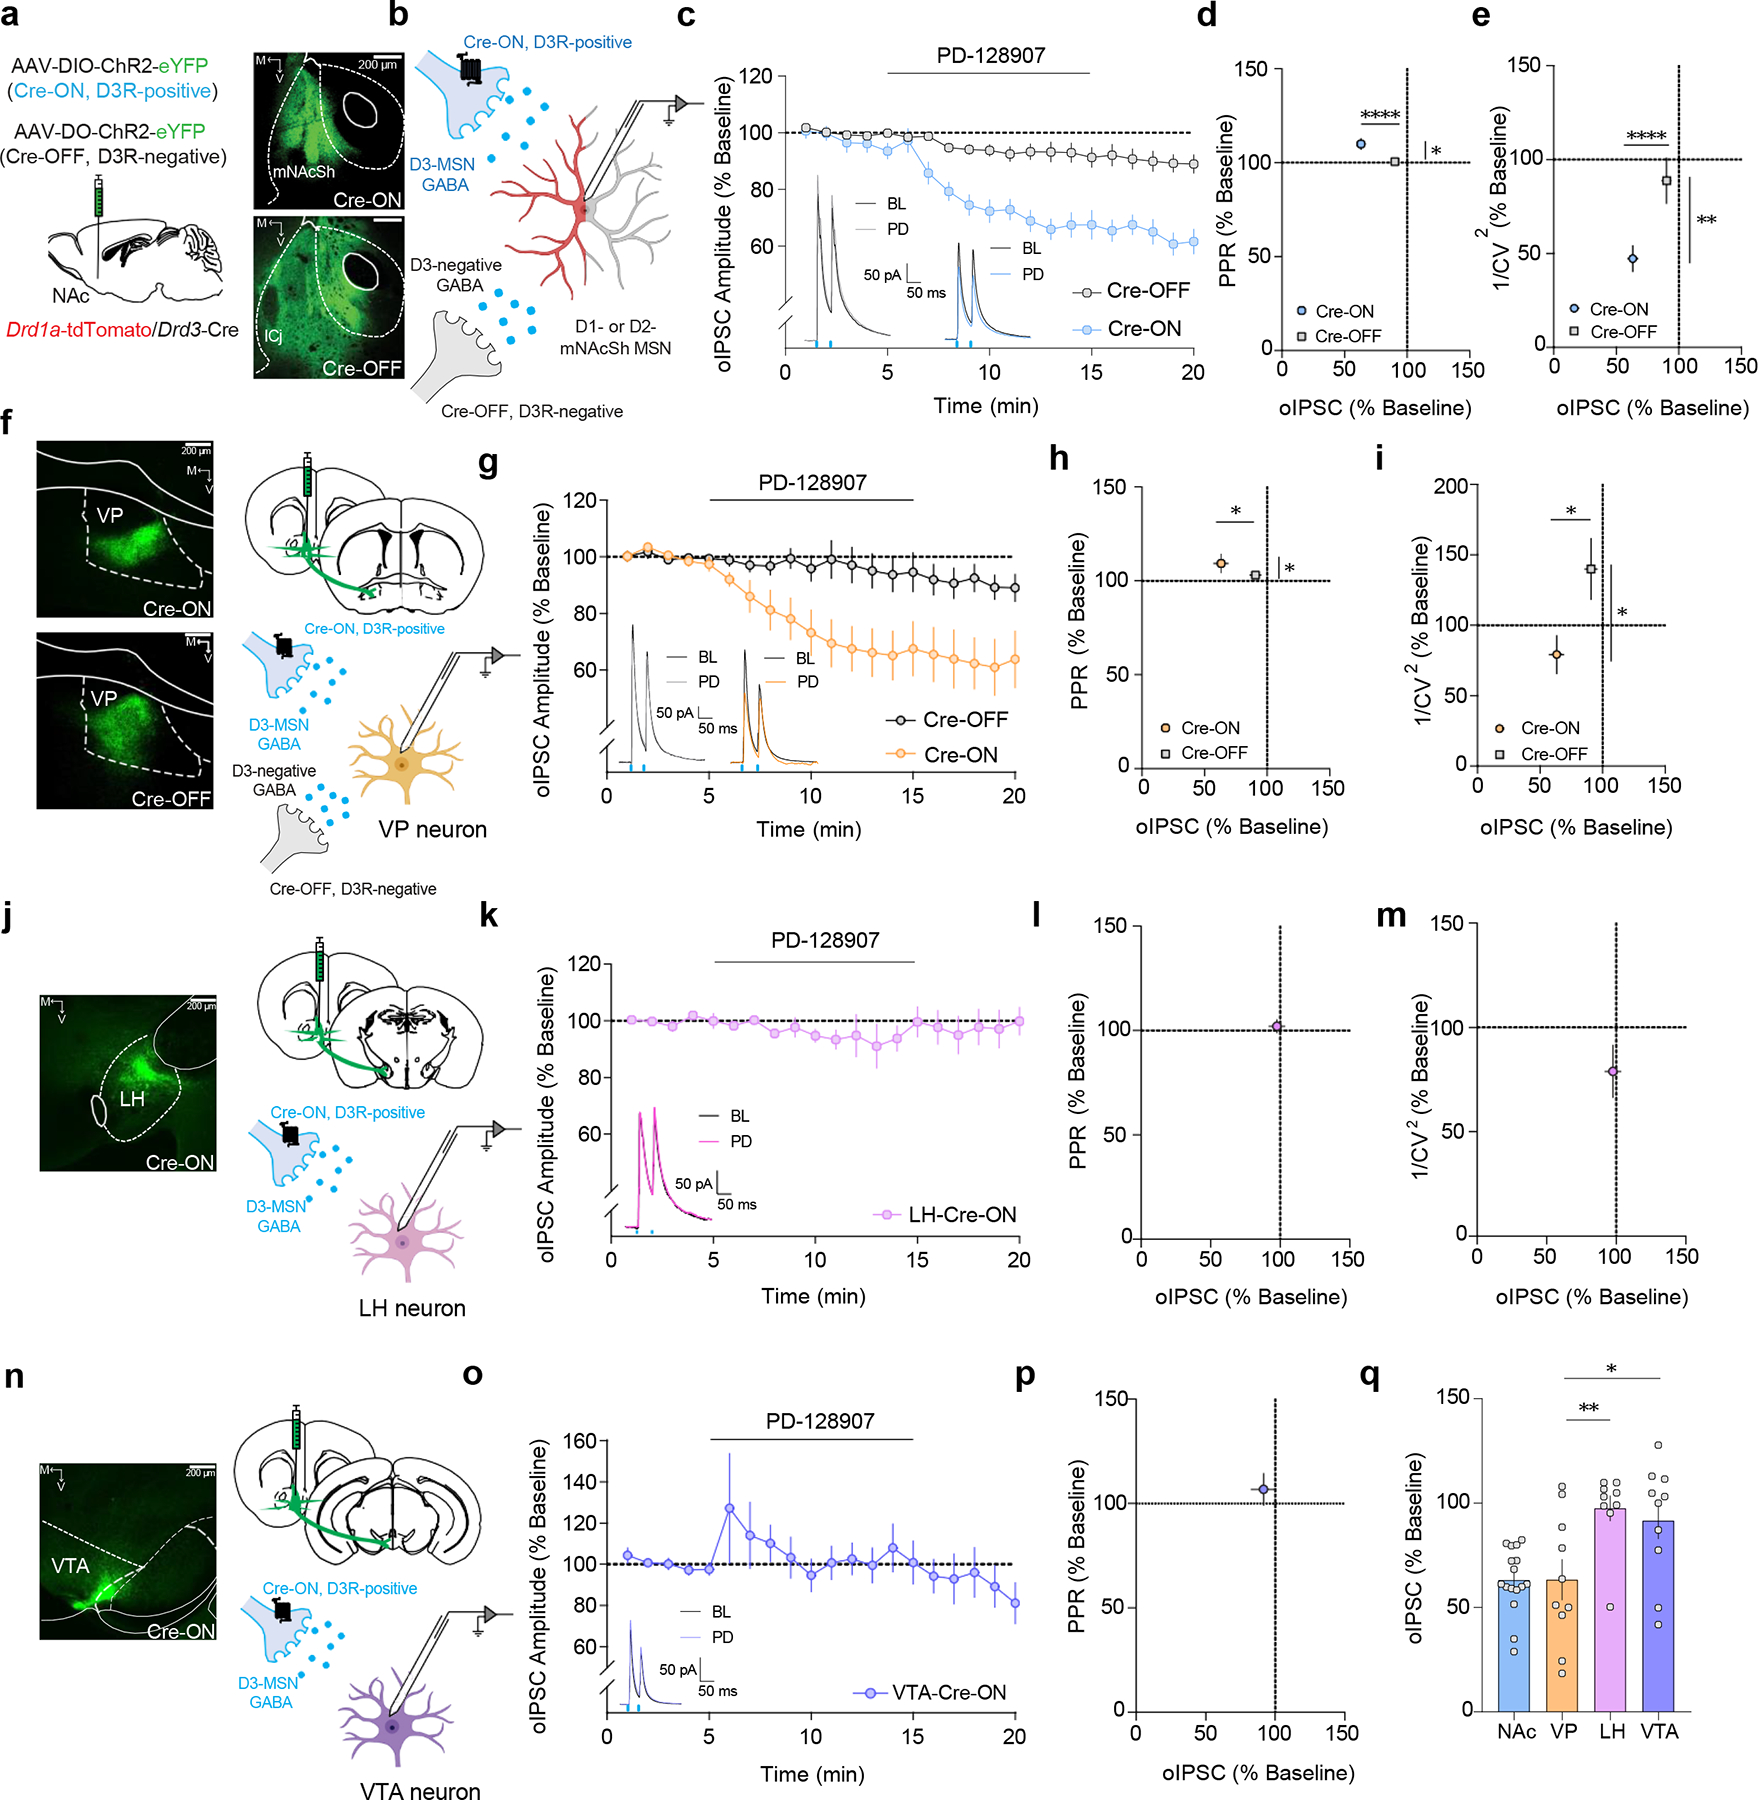
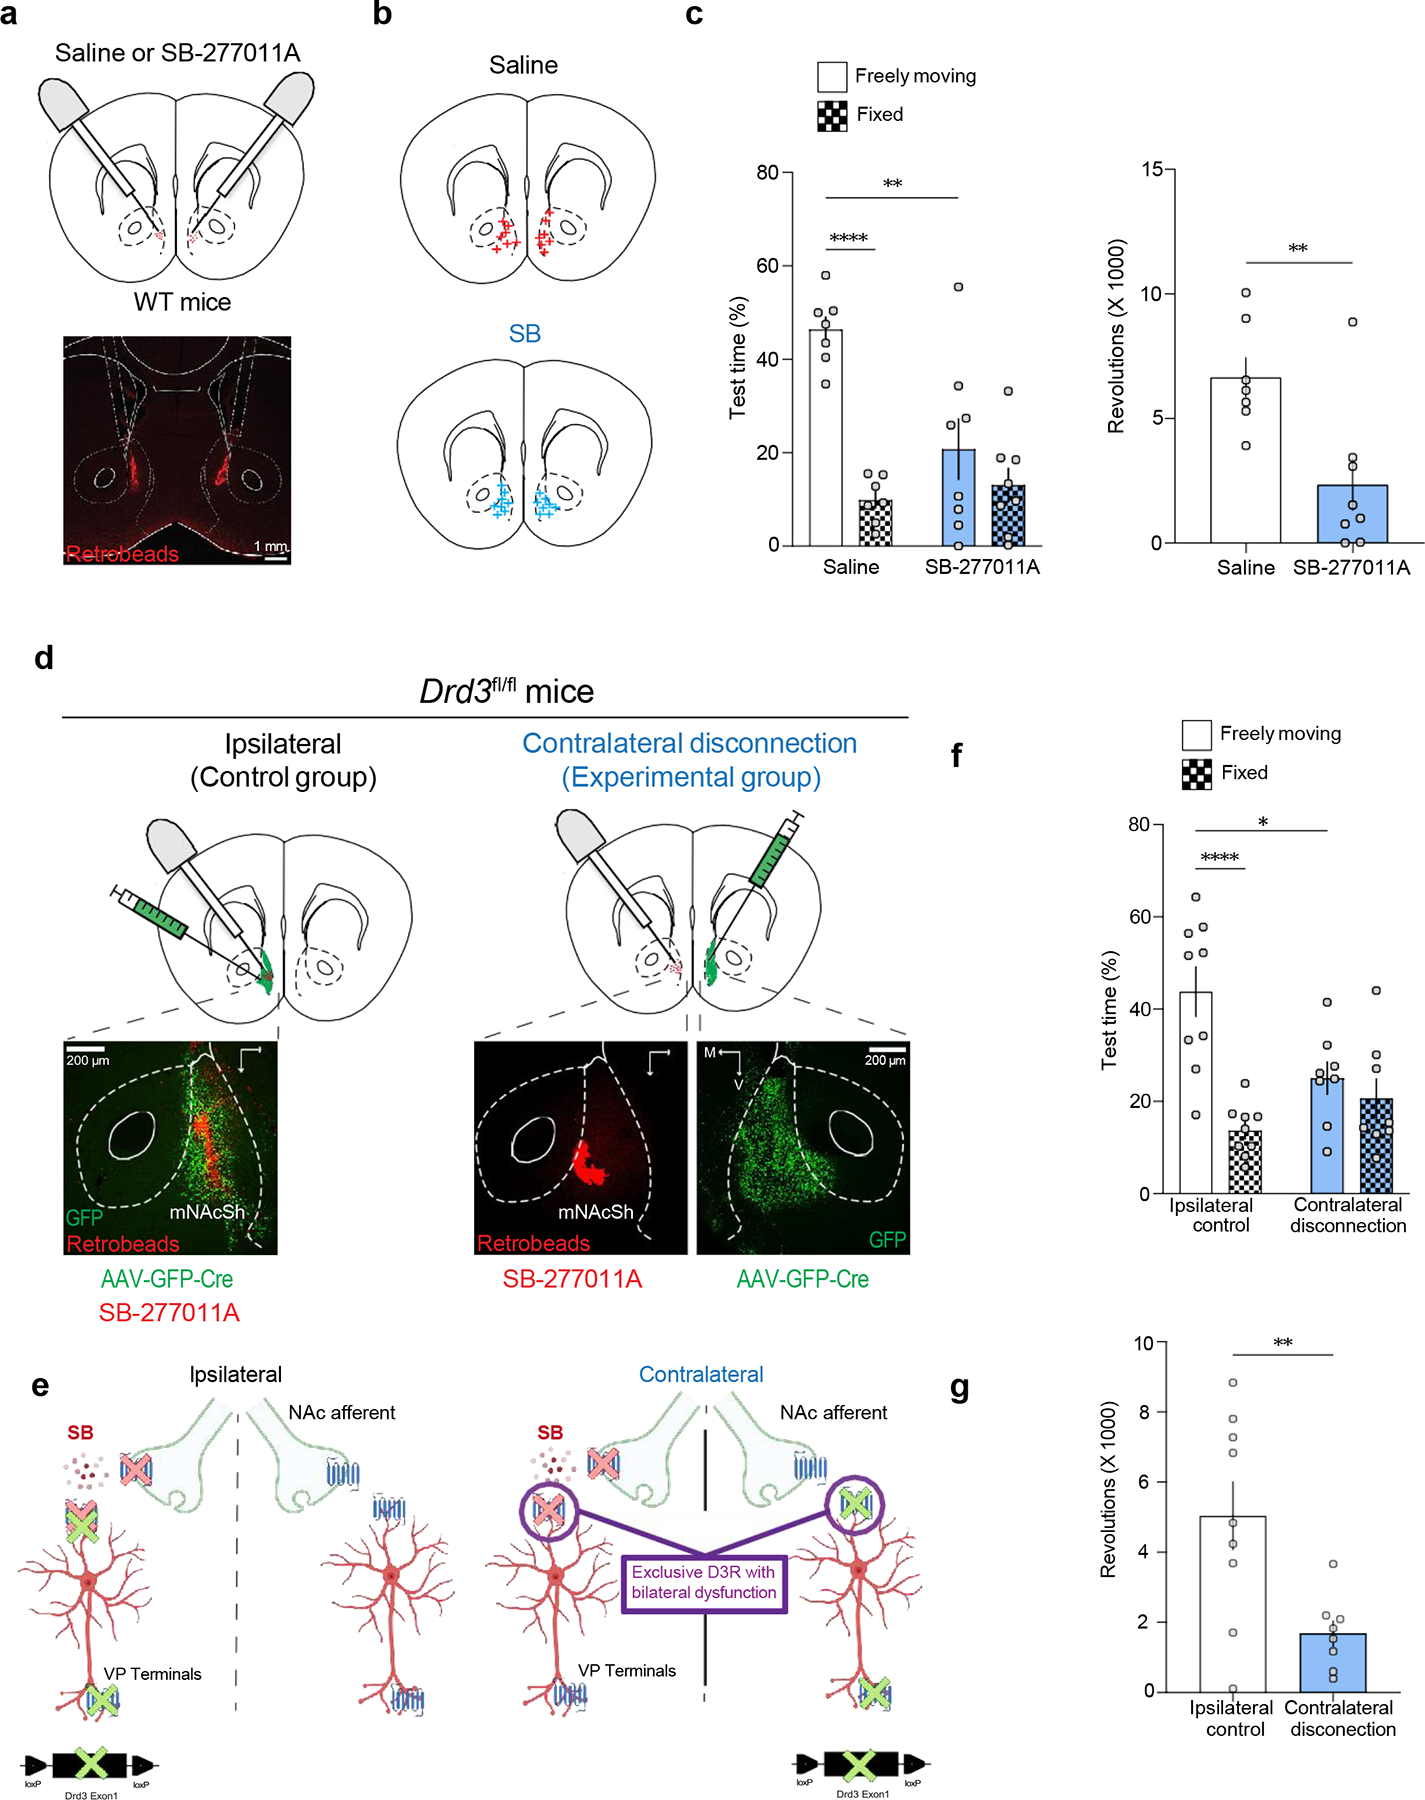
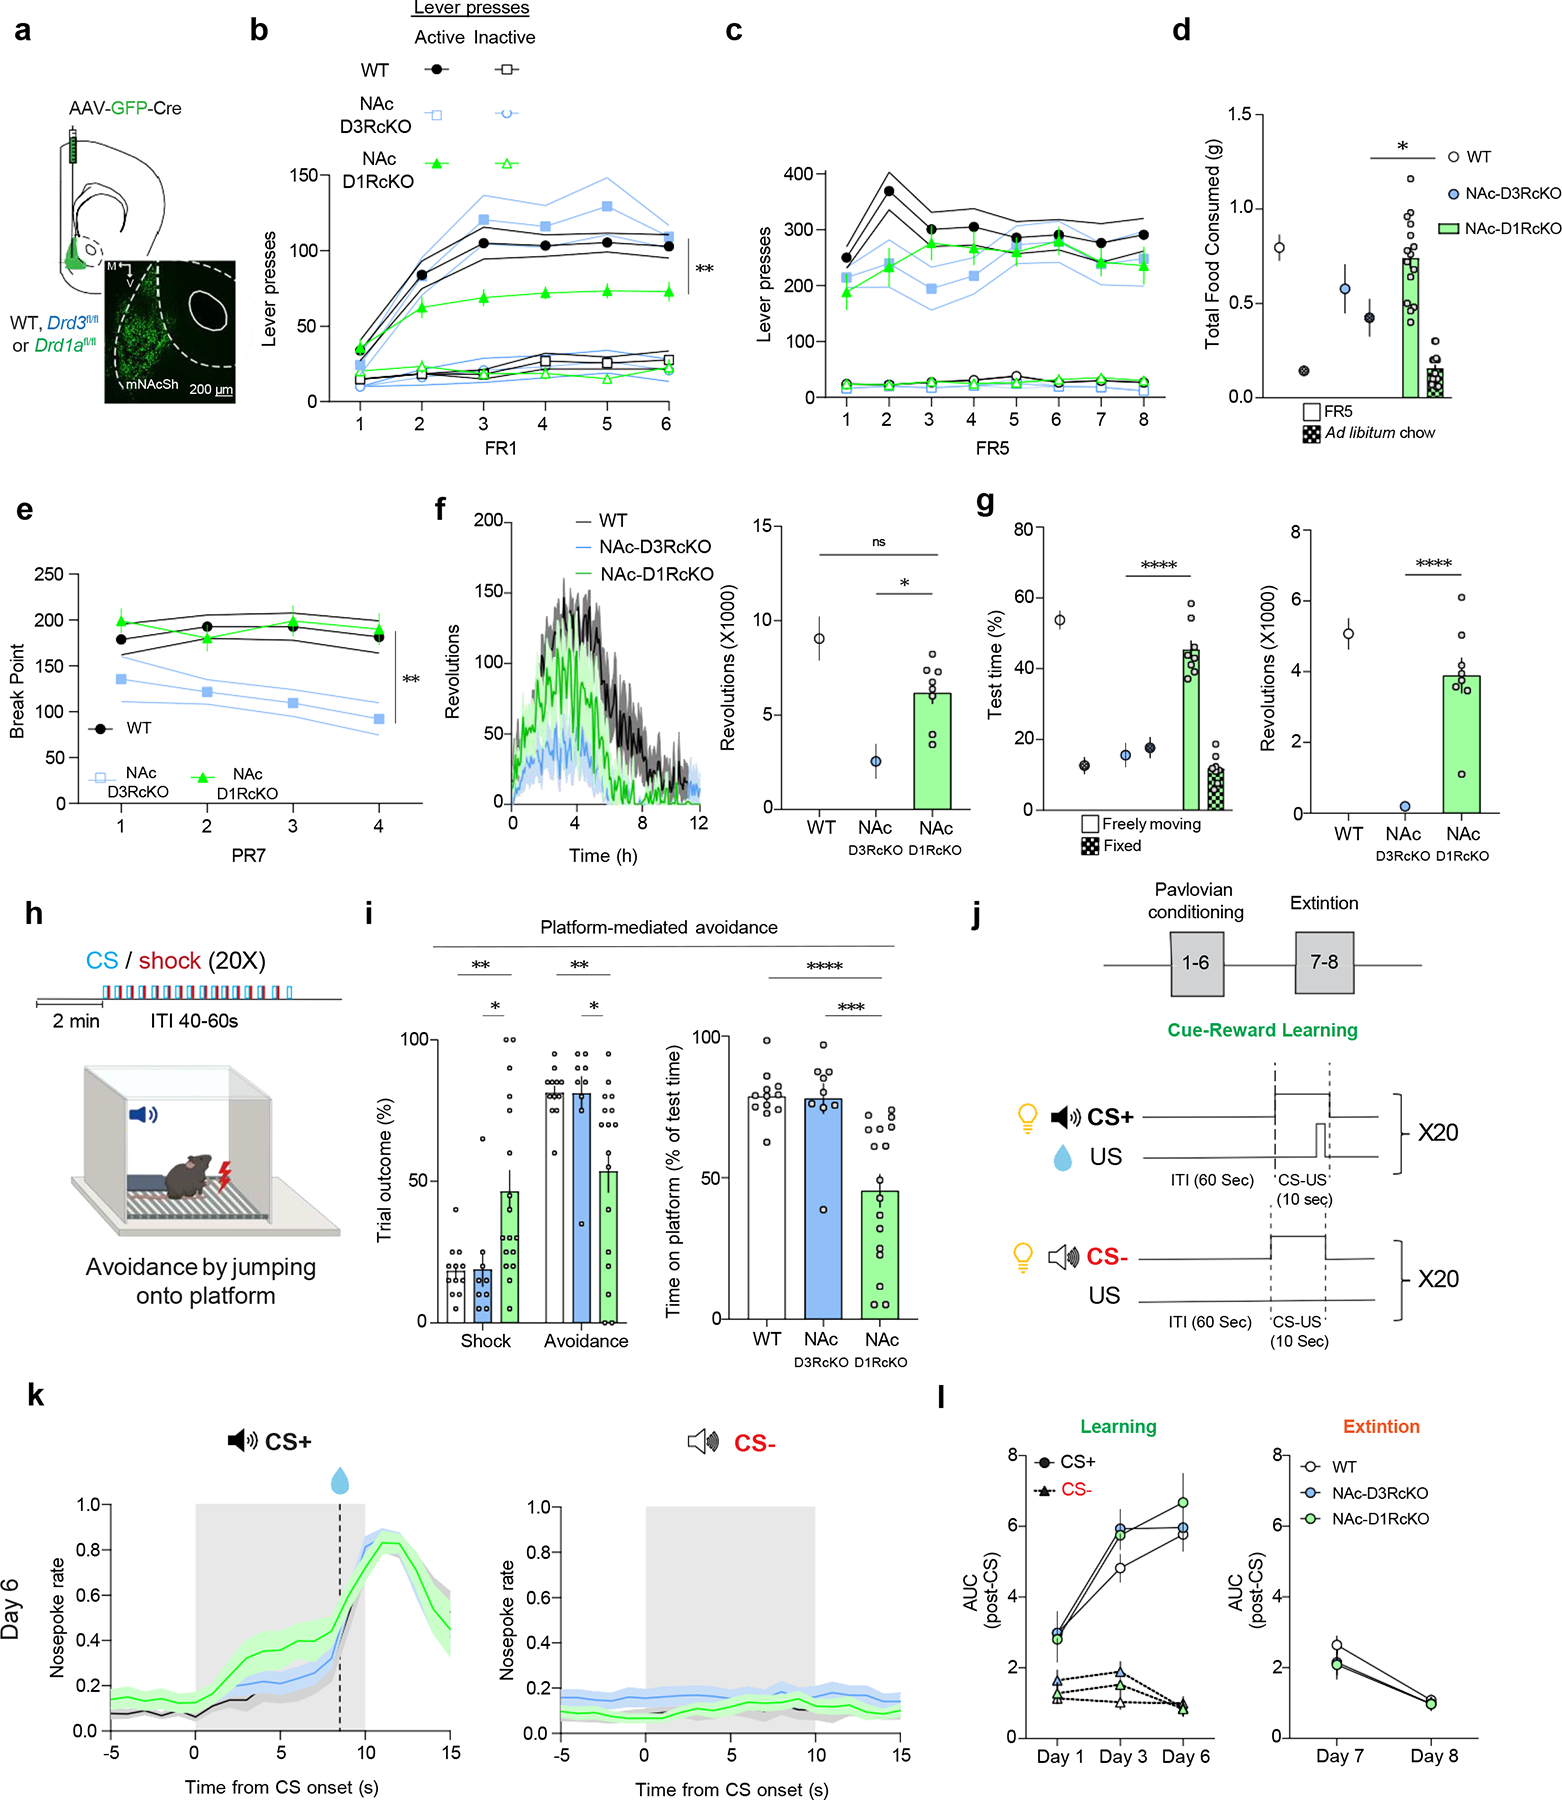
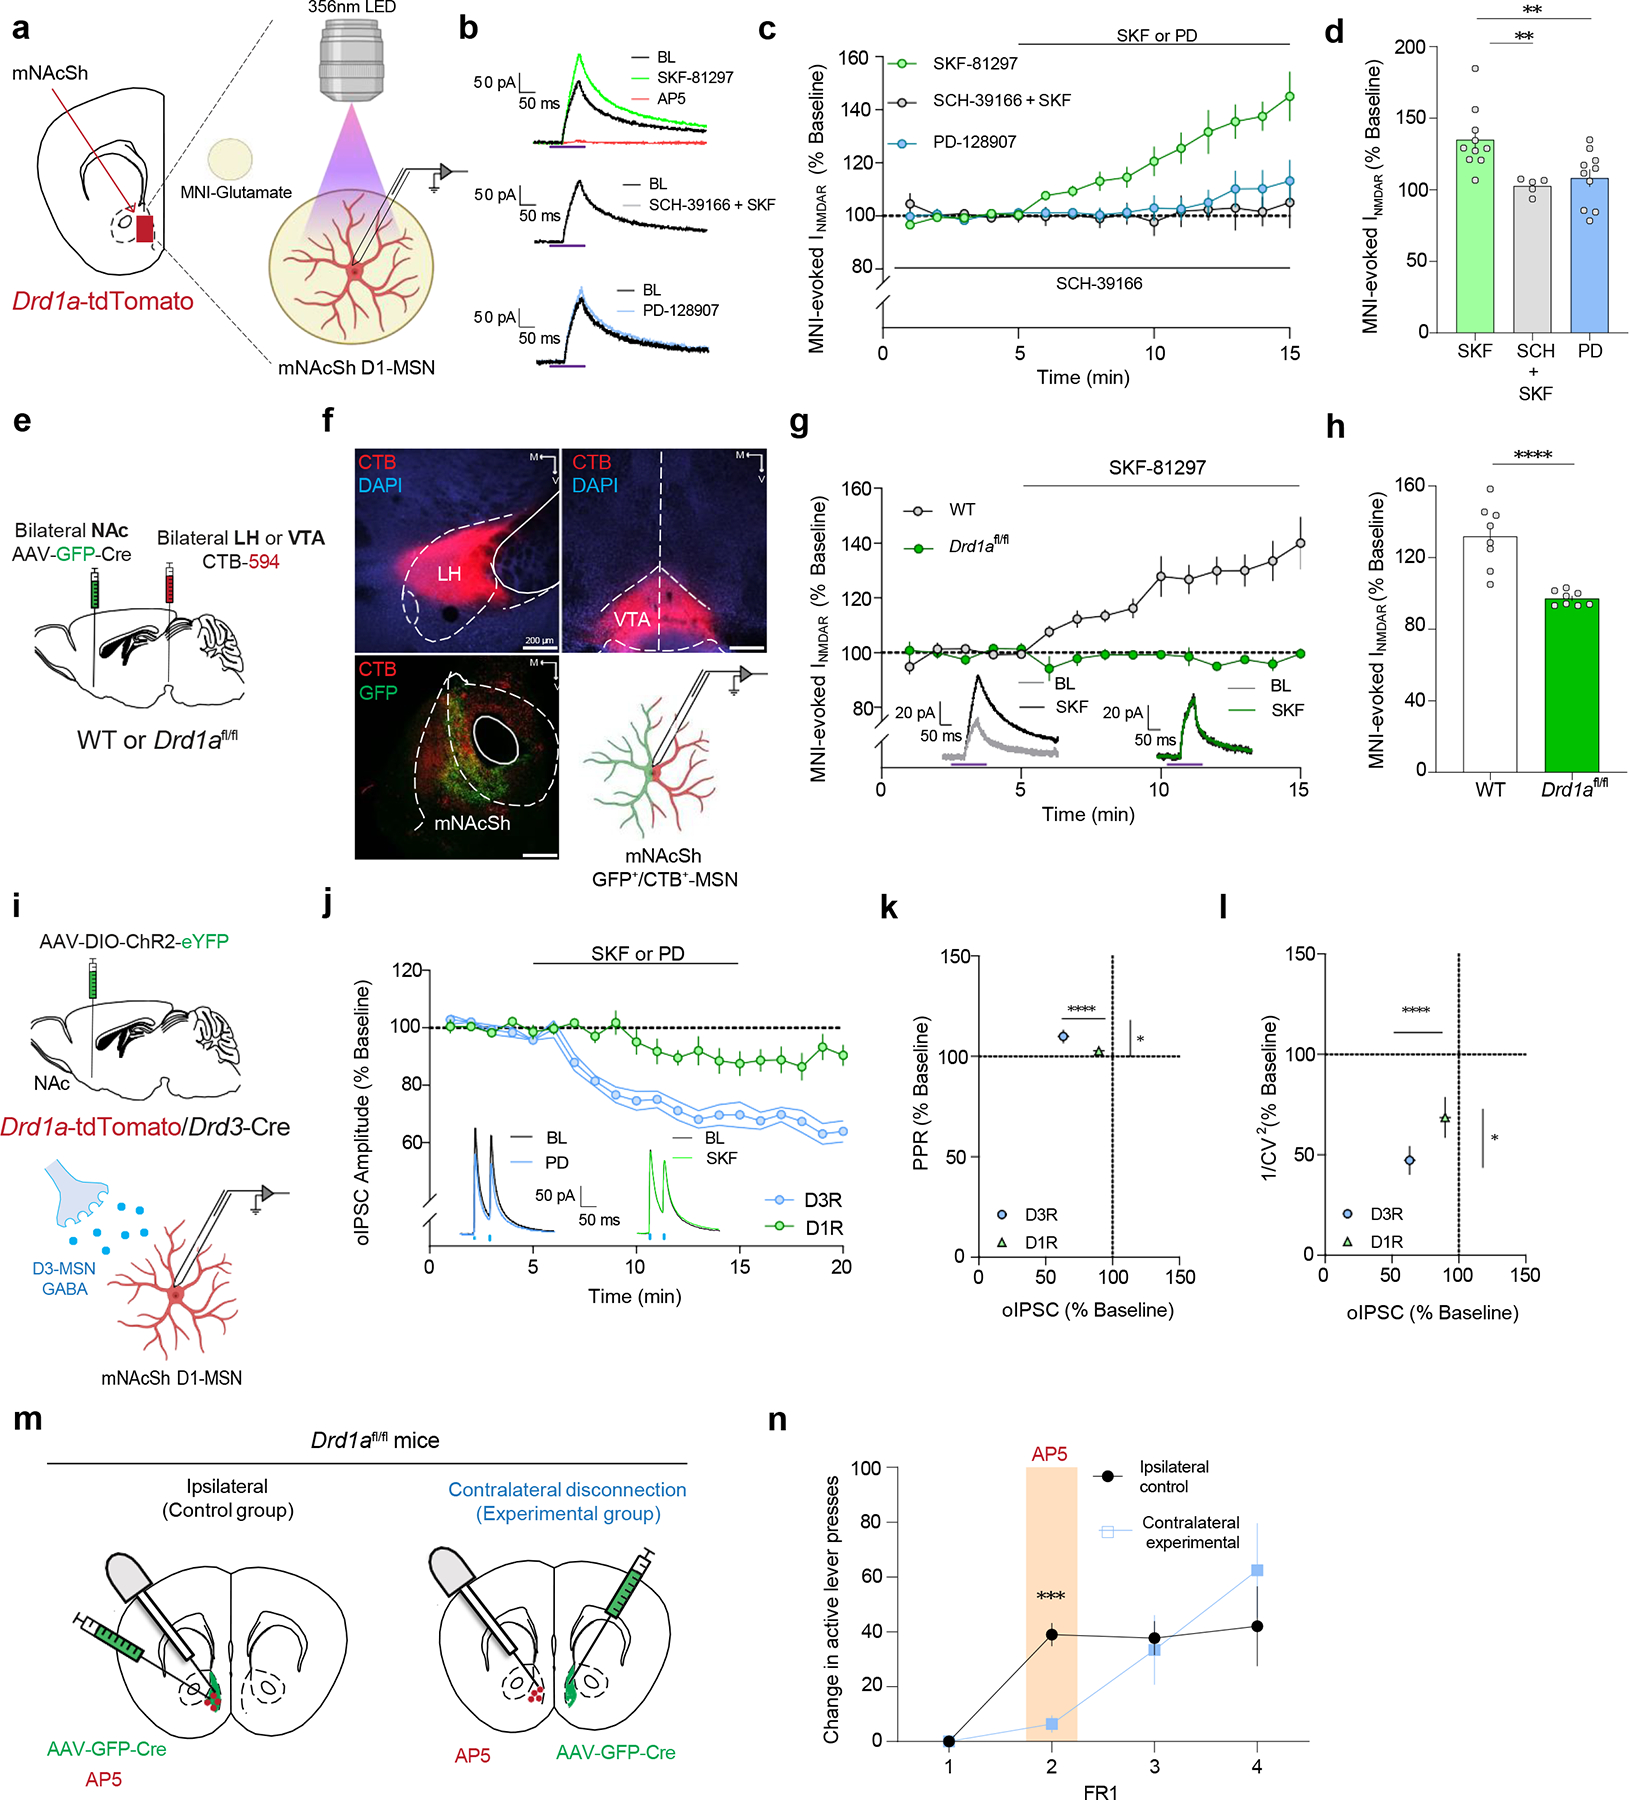
Dopamine (DA) release in striatal circuits, including the nucleus accumbens medial shell (mNAcSh), tracks separable features of reward like motivation and reinforcement. However, the cellular and circuit mechanisms by which DA receptors transform DA release into distinct constructs of reward remain unclear. Here we show that DA D3 receptor (D3R) signaling in the mNAcSh drives motivated behavior in mice by regulating local microcircuits. Furthermore, D3Rs coexpress with DA D1 receptors, which regulate reinforcement, but not motivation. Paralleling dissociable roles in reward function, we report nonoverlapping physiological actions of D3R and DA D1 receptor signaling in mNAcSh neurons. Our results establish a fundamental framework wherein DA signaling within the same nucleus accumbens cell type is physiologically compartmentalized via actions on distinct DA receptors. This structural and functional organization provides neurons in a limbic circuit with the unique ability to orchestrate dissociable aspects of reward-related behaviors relevant to the etiology of neuropsychiatric disorders.


Conflict of interest statement

Competing interests: The authors declare no competing interests.

Figures

Extended Data Figure 1.
Extended Data Figure 1.. Genetic ablation of mNAcSh D3Rs does not affect locomotion, anhedonia, social reward, anxiety or novel object-recognition, Related to Figure 1.
a. (Left) Schematic depicting the strategy used to generate the Drd3fl/fl conditional knockout (cKO) mouse strain. LoxP cassettes flanking the exon 1 were inserted in the coding region of the Drd3 gene that encodes the D3R protein using homologous recombination approaches. (Right) Confirmation of the inserted LoxP sites within the chimeric animals by using PCR strategies (see primers in purple). The successful insertion of the LoxP elements was confirmed by the presence of two PCR bands (fl/+ lanes) versus a single band in the wildtype littermates (+/+ lanes). b. Experimental timeline of behavioral experiments c. (Left) Timecourse of wheel-running activity for the entire duration of the experiment (60 hrs) in WT-Cre (black, n = 11), Drd3fl/fl-GFP (red, n = 7) and NAc-D3RcKO (blue, n = 12) mice (two-way repeated measures ANOVA: Time effect, F (12.86, 347.3) = 18.12, P<0.0001; treatment effect, F (2, 27) = 1.552, P = 0.2301; time × treatment, F (1438, 19413) = 1.633, P<0.0001). L = Light; D= Dark. (Right) Quantification of total revolutions per group during the entire 60 hr period (one-way ANOVA followed by two-sided Dunnett’s test: F (2, 27) = 1.578. Group comparisons, NAc-D3RcKO versus, WT-Cre, P = 0.285, NAc-D3RcKO versus Drd3fl/fl-GFP, P = 0.0.2282). d. Length of visit (bout) to the fixed disk (top) or freely-moving disk (bottom, putative running bout) across the running disks session in WT-Cre (black, n = 11) and NAc-D3RcKO (blue, n = 12) mice (fixed disk: two-way repeated measures ANOVA: Time effect, F (1.649, 26.68) = 1.906, P = 0.1736; genotype effect, F (1, 20) = 0.00014, P = 0.9907; time × genotype, F (17, 275) = 1.138, P = 0.3172; moving disk: two-way repeated measures ANOVA: Time effect, F (2.803, 49.63) = 1.391, P = 0.2574; genotype effect, F (1, 20) = 7.456, P = 0.9907; time × genotype F (17, 301) = 1.199, P = 0.2636). e. Number of entries into the fixed (top) or freely-moving disk (bottom) across the running disks session in WT-Cre (black, n = 11) and NAc-D3RcKO (blue, n = 12) mice (fixed disk: two-way repeated measures ANOVA: Time effect, F (3.329, 66.59) = 23.39, P<0.0001; F (1, 20) = 7.270, P = 0.0139; time × genotype, F (18, 360) = 0.9697, P = 0.4944; moving disk: two-way repeated measures ANOVA: Time effect, F (1.933, 38.67) = 9.639, P = 0.0005; genotype effect, F (1, 20) = 2.356, P = 0.0404; time × genotype F (18, 360) = 0.9787, P = 0.4838). f. (Left) Representative cumulative locomotion traces of open field activity in WT- Cre (n = 10 mice) and NAc-D3RcKO (n = 12 mice) groups. (Middle) Quantification of cumulative distance traveled (two-way repeated measures ANOVA: Zone effect, F (1.033, 17.57) = 209.1, P<0.0001; genotype effect, F (1, 17) = 0.4217, P = 0.5247; zone × genotype, F (2, 34) = 0.1721, P = 0.8426). (Right) Percentage of time spent in the center during the open field test (unpaired t-test (two-tailed), t (17) = 0.9305; P = 0.3651). g. (Left) Percentage of sucrose preference in WT-Cre (black, n = 12), Drd3fl/fl-GFP (red, n = 7) and NAc-D3RcKO (blue, n = 13) mice (one-way ANOVA followed by two-sided Dunnett’s test: F (2, 29) = 2.713. Group comparisons, NAc- D3RcKO versus, WT-Cre, P = 0.0518, NAc-D3RcKO versus, Drd3fl/fl-GFP, P = 0.428 (Right) Overall intake in the sucrose preference test (one-way ANOVA followed by two-sided Dunnett’s test: F (2, 29) = 2.904. Group comparisons, NAc-D3RcKO versus, WT-Cre, P = 0.0635, NAc-D3RcKO versus, Drd3fl/fl-GFP, P = 0.1606). h. Social preference as reflected by the % time (test-habituation) spent interacting with a novel, juvenile mouse in WT-Cre (black, n = 12), Drd3fl/fl-GFP (red, n = 4) and NAc-D3RcKO (blue, n = 8) groups (one-way ANOVA followed by two-sided Dunnett’s test: F (2, 21) = 0.2411. Group comparisons, NAc-D3RcKO versus, WT-Cre, P = 0.8698, NAc-D3RcKO versus, Drd3fl/fl-GFP, P = 0.7329). i. Anxiety-like behavior as represented by the latency to enter dark chamber in the light–dark box (left; one-way ANOVA followed by two-sided Dunnett’s test: F (2, 23) = 0.1608. Group comparisons, NAc-D3RcKO versus, WT-Cre, P = 0.9391, NAc-D3RcKO versus, Drd3fl/fl-GFP, P = 0.9449) or time spent in the light side of the light-dark box (right; one-way ANOVA followed by two-sided Dunnett’s test: F (2, 23) = 0.04904. Group comparisons, NAc-D3RcKO versus, WT-Cre, P = 0.9791, NAc-D3RcKO versus, Drd3fl/fl-GFP, P = 0.9852) in WT-Cre (black, n = 9), Drd3fl/fl-GFP (red, n = 8) and NAc-D3RcKO (blue, n = 9) mice. j. (Left) Time spent interacting with each of the objects during the baseline period in WT-Cre (black, n = 12), Drd3fl/fl-GFP (red, n = 7) and NAc-D3RcKO (blue, n = 9) mice (two-way repeated measures ANOVA: Object effect, F (1, 25) = 1.418, P = 0.245; treatment effect, F (2, 25) = 2.734, P = 0.0844; object × treatment, F (2, 25) = 0.1025, P = 0.903). (Right) Preference for the novel object over a familiar one during the discrimination test (one-way ANOVA followed by two-sided Dunnett’s test: F (2, 25) = 0.8822. Group comparisons, NAc-D3RcKO versus, WT-Cre, P = 0.8593, NAc-D3RcKO versus, Drd3fl/fl-GFP, P = 0.3346). k. Schematic of combined viral spread map of local Drd3 cKO. Dark green indicates animals with most restricted expression and lighter green indicates animals with broader pattern of viral spread. All data in this figure are presented as mean ± SEM Error bars indicate SEM.
Extended Data Figure 2.
Extended Data Figure 2.. mNAcSh D3R cKO decreases motivation towards working for rewards, but does not affect weight, or FR acquisition schedules of reinforcement, Related to Figure 1.
a. Body weight changes at baseline before food deprivation and across the overall duration of operant conditioning procedures in Figures 1 and Extended Data Figure 1 in WT-Cre (black, n = 15) and NAc-D3RcKO (blue, n = 11) mice (two-way repeated measures ANOVA: Session effect, F (8.178, 204.4) = 11.95, P <0.0001; genotype effect, F (1, 25) = 0.4982, P = 0.4868; object × treatment, F (26, 650) = 1.950, P = 0.0034). b. FR1 acquisition, as measured by the percentage of animals reaching the criteria of 70 active lever responses per session. (Inset) Days required to acquire FR1 (criteria for acquisition was 70 responses in a 45 min session) (unpaired t-test (two-tailed), t (24) = 0.7272; P = 0.4741). c. Percentage of active lever responses during FR1 schedules in WT-Cre (black, n = 15) and NAc-D3RcKO (blue, n = 11) mice (two-way repeated measures ANOVA: Session effect, F (2.060, 51.62) = 11.19, P <0.0001; genotype effect, F (1, 24) = 0.1973, P = 0.6609; session × genotype, F (5, 117) = 0.3905, P = 0.8545). d. Total food consumed in choice chow session in WT-Cre (black, n = 15) and NAc-D3RcKO (blue, n = 11) mice (unpaired t-test (two-tailed), t (24) = 0.9353; P = 0.3589). e. (Left) Diagram of the FR5 choice pellet session. (Right) Amount of food consumed, which is represented as FR5 effort-based or freely-available chocolate pellets in WT-Cre (black, n = 15) and NAc-D3RcKO (blue, n = 11) mice (two-way repeated measures ANOVA: Type of food effect, F (1, 23) = 0.07947, P = 0.7805; genotype effect, F (1, 23) = 4.808, P = 0.0387; type of food × genotype, F (1, 23) = 6.314, P = 0.0194). f. Total food consumed in FR5 choice pellet session in WT-Cre (black, n = 15) and NAc-D3RcKO (blue, n = 11) mice (unpaired t-test (two-tailed), t (24) = 1.382; P = 0.0.1802). g. PR3 session length in WT-Cre (black, n = 15) and NAc-D3RcKO (blue, n = 11) mice (two-way repeated measures ANOVA: Session effect, F (1.709, 38.46) = 1.264, P = 0.2899; genotype effect, F (1, 24) = 2.267, P = 0.1452; session × genotype, F (2, 45) = 0.2682, P = 0.766). h. PR7 session length in WT-Cre (black, n = 15) and NAc-D3RcKO (blue, n = 11) mice (two-way repeated measures ANOVA: Session effect, F (2.013, 48.31) = 0.3719, P = 0.6927; genotype effect, F (1, 24) = 9.612, P = 0.0049; session × genotype, F (3, 72) = 0.5050, P = 0.68). All data in this figure are presented as mean ± SEM Error bars indicate SEM. Schematics were generated using Biorender.
Extended Data Figure 3.
Extended Data Figure 3.. Drd3-Cre lines provide genetic access to Drd3 expression in the mNAcSh and outputs of D3-MSNs, Related to Figure 2
a. RNA in-situ hybridization results for NAc core (top) or overall NAc (bottom) cells of WT (n = 3) mice. b. Drd3 expression in the mNAcSh of Drd3-Cre/Ai14 mice. Coronal diagrams depicting the region analyzed (top) and confocal images showing the Drd3 expression pattern in the mNAcSh along the dorsal-ventral and rostral-caudal axis (bottom). DS = dorsal striatum; ICj = islands of Calleja; ICjM = major island of Calleja; latNAcSh = lateral NAc shell c. (Left) A virus encoding the anterograde tracer (AAV1-Syn-FLEX-Chrimsom- tdTomato) was targeted to the mNAcSh in Drd3-Cre mice that express tdTomato in a Cre-dependent manner. (Right) Representative images and quantification of tdTomato+ fibers in mNAcSh (n = 4 mice), VP (n = 4 mice), LH (n = 4 mice) and VTA (n = 3 mice) regions (one-way ANOVA followed by two-sided Tukey’s test: F (3, 10) = 14.66. Group comparisons, NAc versus, VP, **P = 0.0039, NAc versus LH, ***P = 0.0009, NAc versus VTA, ***P = 0.0004, VP versus LH, P = 0.2659, VP versus VTA, P = 0.0651, LH versus VTA, P = 0.8112). d. Representative images (top) and reconstructions (bottom) of VP, LH, and VTA retrobead injection sites for experiments shown in Fig. 2l. All data in this figure are presented as mean ± SEM Error bars indicate SEM.
Extended Data Figure 4.
Extended Data Figure 4.. Histological validation of our intersectional approach for pathway-specific NAc Drd3 cKO, Related to Figure 3.
a. Viral injection placements for pathway-specific deletion of NAc D3Rs experiment. For each manipulation representative images of injection sites of CAV-Flp-GFP (left) and serial reconstructions of tdTomato expression in the NAc (right) are shown. Each circle depicts the position of the strongest tdTomato expression for each subject. b. Scheme of the experimental design to validate the lack of Cre leakage in our pathway-specific strategy for the cKO of NAc Drd3. AAV8-Syn-GFP-Cre and AAV9-EF1a-fDIO-Cre were injected in contralateral hemispheres of Ai14-tdTomato reporter mouse. c. Representative images showing colabeling of GFP and tdTomato in the hemisphere injected with AAV-GFP-Cre (top) and lack of tdTomato expression in the hemisphere injected with AAV-fDIO-Cre (bottom). d. Scheme of the experimental design to address the potential toxicity of CAV injection in DA cell degeneration of the VTA. CAV-FlpO-GFP was injected in the VTA and slices containing the VTA were immunostained for TH and GFP. e. Representative images of TH expression and GFP labeling in the VTA. Filled arrows indicate double positive GFP and TH neurons; empty arrows indicate single-positive TH neurons (i.e. GFP-negative). f. (Left) Quantification of number of TH-positive cells in control (n = 4) and injected (n = 4) mice (unpaired t-test (two-tailed), t(6) = 0.4512; P = 0.6677). (Right) TH integrated density in GFP-negative or GFP-positive cells (unpaired t-test (two-tailed), t(6) = 1.698; P = 0.1404). All data in this figure are presented as mean ± SEM Error bars indicate SEM.
Extended Data Figure 5.
Extended Data Figure 5.. NAc D3R function supports running and working for reward, but does not regulate acquisition of reinforcement, Related to Figure 3.
a. Wheel running activity for pathway-specific deletion of NAc D3Rs (WT, n = 15 mice; Drd3fl/fl -VP, n = 7 mice; Drd3fl/fl -LH, n = 6 mice; Drd3fl/fl -VTA, n = 9 mice). (Left) Timecourse of running activity during the complete 60-hr experiment (two-way repeated measures ANOVA: Time effect, F (2.013, 48.31) = 0.3719, P<0.0001; treatment effect, F (3, 34) = 2.361, P = 0.0887; time × treatment, F (2157, 24446) = 1.538, P<0.0001). (Right) Quantification of total revolutions during the 60-hr period (one-way ANOVA followed by two-sided Dunnett’s test: F (3, 33) = 3.556. Group comparisons, WT versus Drd3fl/fl-VP, P = 0.4806, WT versus Drd3fl/fl-LH, P = 0.1265, WT versus Drd3fl/fl-VTA, P = 0.0903). b. Body weight changes at baseline before food deprivation and across the overall duration of operant conditioning procedures in Figure 3 (WT, n = 11 mice; Drd3fl/fl -VP, n = 7 mice; Drd3fl/fl -LH, n = 6 mice; Drd3fl/fl -VTA, n = 7 mice) (two-way repeated measures ANOVA: Session effect, F (5.885, 185.7) = 8.340, P<0.0001; treatment effect, F (3, 852) = 0.7685, P = 0.5118; session × treatment, F (81, 852) = 0.8500, P = 0.8212). c. FR1 acquisition, as measured by the percentage of animals reaching the criteria of 70 active lever responses per session. d. Percentage of active lever responses during FR1 schedules (WT, n = 11 mice; Drd3fl/fl -VP, n = 7 mice; Drd3fl/fl -LH, n = 6 mice; Drd3fl/fl -VTA, n = 7 mice) (two-way repeated measures ANOVA: Session effect, F (3.485, 85.73) = 16.46, P<0.0001; treatment effect, F (3, 26) = 2.953, P = 0.0511; session × treatment, F (15, 123) = 1.975, P = 0.0221). e. Lever presses during FR5 acquisition sessions (WT, n = 11 mice; Drd3fl/fl -VP, n = 7 mice; Drd3fl/fl -LH, n = 6 mice; Drd3fl/fl -VTA, n = 7 mice) (two-way repeated measures ANOVA: Session effect, F (4.782, 120) = 10.98, P<0.0001; treatment effect, F (3, 28) = 2.718, P = 0.0635; session × treatment, F (30, 251) = 2.247, P = 0.0004). f. Total food consumed in choice chow session (WT, n = 11 mice; Drd3fl/fl -VP, n = 7 mice; Drd3fl/fl -LH, n = 6 mice; Drd3fl/fl -VTA, n = 7 mice) (one-way ANOVA followed by two-sided Dunnett’s test: F (3, 28) = 2.347. Group comparisons, WT versus Drd3fl/fl-VP, P = 0.8858, WT versus Drd3fl/fl-LH, P = 0.9406, WT versus Drd3fl/fl-VTA, P = 0.1408). g. (Top) Diagram of the FR5 choice pellet session. (Bottom) Amount of food consumed which is represented as either FR5 effort-based (solid) or freely-available chocolate pellets (checkered) (WT, n = 11 mice; Drd3fl/fl -VP, n = 7 mice; Drd3fl/fl -LH, n = 6 mice; Drd3fl/fl -VTA, n = 7 mice) (two-way repeated measures ANOVA: Type of food effect, F (1, 27) = 0.6669, P = 0.4213; treatment effect, F (3, 27) = 2.258, P = 0.1044; type of food × treatment, F (3, 27) = 3.256, P = 0.037). h. Effects of region-specific D3R cKO on total consumption of chocolate pellets in a FR5 choice pellet session (WT, n = 11 mice; Drd3fl/fl -VP, n = 7 mice; Drd3fl/fl -LH, n = 6 mice; Drd3fl/fl -VTA, n = 7 mice; one-way ANOVA: followed by two-sided Dunnett’s test F (3, 27) = 2.258, Group comparisons, WT versus Drd3fl/fl- VP, P = 0.4806, WT versus Drd3fl/fl-LH, P = 0.1265, WT versus Drd3fl/fl-VTA, P = 0.0903) i. Break points during the PR3 reinforcement schedule for VP-, LH-, and VTA-specific D3R cKO versus WT controls (two-way repeated measures ANOVA: Session effect, F (1.491, 41.00) = 3.086, P = 0.0702; treatment effect, F (3, 31) = 0.6072, P = 0.6153; session × treatment, F (6, 55) = 0.8598, P = 0.5302). All data in this figure are presented as mean ± SEM Error bars indicate SEM. Schematics were generated using Biorender.
Extended Data Figure 6.
Extended Data Figure 6.. Activation of mNAcSh D3R decreases GABA release probability presynaptically onto both D1- and D2-MSNs, Related to Figure 4
a. Mean baseline oIPSC amplitude (pA) for Cre-OFF (white bar, n = 15 cells from 7 mice) and Cre-ON (blue bar, n = 16 cells from 9 mice) evoked in mNAcSh MSNs (unpaired t-test (two-tailed), t (29) = 3.420; **P = 0.0019). b. Timecourse of oIPSCs in mNAcSh MSNs before, during and after bath application of the D3R-selective agonist ML417 (1 μM) in Drd3-Cre mice expressing Cre-dependent ChR2 (blue, n = 11 cells from 8 mice). (Inset) Representative oIPSC traces recorded in mNAcSh MSNs before and after bath application of ML417. c. Paired-pulse ratio (PPR, % baseline) versus oIPSC (% baseline) after ML417 application (n = 11 cells from 8 mice). d. Coefficient of variation (1/CV2, % baseline) versus oIPSC (% baseline) after ML417 application (n = 11 cells from 8 mice). e. Representative traces of sIPSCs during baseline (BL, black) and after bath- application of the D3R-selective agonist PD-128907 (PD, blue). f. Cumulative probability of sIPSC inter-event interval (left; Kolmogorov-Smirnov test, ks = 36.740988, P <0.0001) and amplitude (right; Kolmogorov-Smirnov test, ks = 2.401130, P <0.0001) recorded from mNAcSh MSNs (n = 12 cells from 7 mice). (Inset) Quantification of frequency (paired t-test (two-tailed), t (11) = 3.131; **P = 0.0096) and amplitude (paired t-test (two-tailed), t (11) = 1.851; P = 0.0912) of sIPSCs events during baseline and after PD-128907 application g. Rise (left; paired t-test (two-tailed), t (11) = 0.3225; P = 0.7531) and decay time (right, paired t-test (two-tailed), t (11) = 1.029; P = 0.3256) of sIPSC events during baseline and after PD-128907 application (n = 12 cells from 7 mice). h. Time-course of oIPSCs before, during and after bath application of PD-128907 in mNAcSh D1R-positive (red, n = 12 cells from 5 mice) and D1R-negative neurons (putative D2-MSNs, blue, n = 11 cells from 5 mice) in the Cre-ON condition (two-way repeated measures ANOVA: Time effect, F (3.888, 81.65) = 42.52, P <0.0001; cell identity effect, F (1, 21) = 0.7339, P = 0.4013; time × cell identity, F (19, 399) = 0.9070, P = 0.5744). (Inset) Representative oIPSCs traces recorded in mNAcSh D1- and D2-MSNs before and after bath application of PD-128907. i. Bar-graph quantification of oIPSC inhibition after PD-128907 application in D1R-positive (n = 12 cells from 5 mice) and D1R-negative (n = 11 cells from 5 mice) mNAcSh MSNs (unpaired t-test (two-tailed), t (21) = 0.9825; P = 0.337). j. Schematics of experiment to determine regulation of ex-vivo cAMP signaling by D3Rs. (Left) Drd3-Cre mice (n = 5) we injected with AAV1-hSyn-DIO-cADDs in the mNAcSh and slices containing the mNAcSh were imaged on a two-photon microscope. (Right) Representative images of cADDis expression in the mNAcSh (left) and 40X magnification (right). k. Diagram showing the experiment setup. Bath-application of DA in the presence of SCH-39166, a D1R antagonist, inhibited cAMP levels through D3R signaling. l. Timecourse of cADDis fluorescence changes before and after DA application. Forskolin was added after the experiment to confirm the specificity of changes in fluorescence. All data in this figure are presented as mean ± SEM Error bars indicate SEM.
Extended Data Figure 7:
Extended Data Figure 7:. Unilateral suppression of D3R signaling does not disrupt motivated running behavior, Related to Figure 5
a. Quantification of time spent in the freely-moving and fixed disk and revolutions for Drd3fl/fl mice expressing unilateral Cre recombinase (n = 7 mice) (paired t-test (two-tailed), t (6) = 5.129; **P = 0.0022). b. Same as in (a) but for WT control mice unilaterally infused with SB-277011A into the mNAcSh (n = 4 mice) (paired t-test (two-tailed), t (3) = 3.570; *P = 0.0376). c. Schematic (top) and representative image (bottom) of viral expression of AAV5-hSyn-DIO-mCherry in the mNAcSh of Drd3-Cre mice d. (Left) Percentage of time spent on fixed or freely-moving disk during the running disk task for mCherry (n = 7 mice) and hM4Di (n = 7 mice) groups. (two-way repeated measures ANOVA: Disk effect, F (1, 24) = 36.29, P <0.0001; treatment effect, F (1, 24) = 8.250, P = 0.0084; disk × treatment, F (1, 24) = 6.752, P = 0.0158). (Right) Running behavior as represented by the number of revolutions registered in the freely moving disk (unpaired t-test (two-tailed), t (12) = 2.581; *P = 0.024) (mCherry Control, n = 7 mice; hM4Di, n = 7 mice). e. (Left) Quantification of cumulative distance traveled in each zone during the open-field test (two-way repeated measures ANOVA: Zone effect, F (1.230, 14.75) = 131.1, P <0.0001; treatment effect, F (1, 12) = 2.206, P = 0.1632; zone × treatment, F (2, 24) = 2.177, P = 0.1353) (mCherry Control, n = 7 mice; hM4Di, n = 7 mice). (Right) Percentage of time spent in center (unpaired t-test (two-tailed), t (12) = 1.428; P = 0.1788) (mCherry Control, n = 7 mice; hM4Di, n = 7 mice). All data in this figure are presented as mean ± SEM Error bars indicate SEM.
Extended Data Figure 8:
Extended Data Figure 8:. cKO of mNAcSh D1Rs do not disrupt motivated, anxiety-like or social reward or sucrose preference, Related to Figure 6 and Figure 7
a. (Left) Time course of wheel-running activity across the entire duration of the experiment (60-hrs) for WT (n = 11 mice), NAc-D3RcKO (n = 12 mice) and NAc-D1RcKO (n = 8 mice) groups in 5 min bins (two-way repeated measures ANOVA: Time effect, F (15.51, 434.3) = 20.27, P <0.0001; genotype effect, F (2, 28) = 1.738, P = 0.1943; time × genotype, F (1438, 20132) = 1.513, P <0.0001). (Right) Quantification of total revolutions across the 60 hr period (one-way ANOVA: followed by two-sided Dunnett’s test, F (2, 28) = 1.197, Group comparisons, NAc-D1RcKO vs WT, P = 0.6507, NAc-D1RcKO vs NAc-D3RcKO, P = 0.7421). b. (Left) Percentage of sucrose preference for WT (n = 12 mice), NAc-D3RcKO (n = 13 mice) and NAc-D1RcKO (n = 7 mice) groups (one-way ANOVA: followed by two-sided Dunnett’s test, F (2, 29) = 2.937, Group comparisons, NAc-D1RcKO vs WT, P = 0.752, NAc-D1RcKO vs NAc-D3RcKO, P = 0.2671). (Right) Overall water and sucrose intake (one-way ANOVA: followed by two-sided Dunnett’s test, F (2, 29) = 2.941, Group comparisons, NAc-D1RcKO vs WT, P = 0.1447, NAc-D1RcKO vs NAc-D3RcKO, P = 0.9841). c. Social preference as reflected by the % time (test-habituation) spent interacting with a novel, juvenile mouse (WT, n = 12 mice; NAc-D3RcKO, n = 8 mice and NAc-D1RcKO, n = 8 mice) (one-way ANOVA: followed by two-sided Dunnett’s test, F (2, 25) = 0.1187, Group comparisons, NAc-D1RcKO vs WT, P = 0.9026, NAc-D1RcKO vs NAc-D3RcKO, P = 0.9971) d. Anxiety-like behavior as represented by the time spent in the light side of the box (WT, n = 9 mice; NAc-D3RcKO, n = 9 mice and NAc-D1RcKO, n = 6 mice) (one-way ANOVA: followed by two-sided Dunnett’s test, F (2, 21) = 0.1626, Group comparisons, NAc-D1RcKO vs WT, P = 0.7825, NAc-D1RcKO vs NAc-D3RcKO, P = 0.902). e. (Left) Time spent interacting with each of the objects during the baseline period of the novel object recognition test (two-way repeated measures ANOVA: Object effect, F (1, 26) = 1.381, P = 0.2506; genotype effect, F (2, 26) = 1.187, P = 0.3212; object × genotype, F (2, 26) = 0.06934, P = 0.9332). (Right) Preference for the novel object over a familiar one during the discrimination session (one-way ANOVA: followed by two-sided Dunnett’s test, F (2, 26) = 0.4785, Group comparisons, NAc-D1RcKO vs WT, P = 0.8305, NAc-D1RcKO vs NAc-D3RcKO, P = 0.5168) (WT, n = 12 mice; NAc-D3RcKO, n = 9 mice and NAc-D1RcKO, n = 8 mice). f. (Left) Quantification of trial outcome (avoidance or shock responses) upon re-exposure to the platform-mediated avoidance task on day 2 (two-way repeated measures ANOVA: Outcome effect, F (1, 35) = 77.30, P<0.0001; genotype effect, F (2, 35) = 0.000, P >0.9999; outcome × genotype, F (2, 35) = 7.892, P = 0.0015) (WT, n = 12 mice; NAc-D3RcKO, n = 9 mice and NAc-D1RcKO, n = 17 mice). (Right) Overall time spent on platform (Day 2) as percentage of test time (one-way ANOVA: followed by two-sided Dunnett’s test, F (2, 35) = 7.912, Group comparisons, NAc-D1RcKO vs WT, **P = 0.0014, NAc-D1RcKO vs NAc-D3RcKO, *P = 0.0201). g. (Left) Absolute number of active lever responses in FR1 sessions for D1R-NMDAR disconnection experiments. AP5 infusion was performed on Day 2 of FR1 (unpaired t-test (two-tailed), t (13) =4.933; ***P = 0.0003) (Ipsilateral, n = 8 mice; contralateral, n = 7 mice). (Right) Correlation between number of AL presses on Day 1 and change in active lever presses on Day 2 (AP5 challenge) (simple linear regression, F (1, 11) = 0.05037, P = 0.8265). All data in this figure are presented as mean ± SEM Error bars indicate SEM.
Figure 1.
Figure 1.. Conditional knockout of D3Rs in mNAcSh results in motivational deficits (see also Extended Data Figures Figure 1 and 2)
a. Experimental scheme (top) and representative image (bottom) of the mNAcSh area targeted with AAV-GFP-Cre or AAV-eGFP. b. (Left) Representative in situ hybridization images showing Cre (green) and Drd3 (white) mRNA expression in WT (top) or NAc-D3RcKO mice (bottom). Insets depict higher-magnification images. (Right) Quantification of Drd3 mRNA expression in Cre-positive neurons in the mNAcSh of WT (n = 3) and NAc-D3RcKO (n = 3) mice (unpaired t-test (two-tailed), t (4) = 7.421; **P = 0.0018). c. Quantitative real-time PCR analysis of Drd1a, Drd2 and Drd3 mRNA expression in the NAc of WT (white, n = 3) and NAc-D3RcKO (blue, n = 4) mice injected with Cre-expressing virus (Two-way repeated measures ANOVA: Gene effect, F(2,9) = 4.291, P = 0.0491; genotype effect, F(1,6) = 8.948, P = 0.0243; gene × genotype, F(2,6) = 22.67, P = 0.0016; Sidak’s post hoc analysis, **P = 0.0012). d. (Left) Time-course of wheel-running activity in WT-Cre (black, n = 11), Drd3fl/fl- GFP (red, n = 7) and NAc-D3RcKO (blue, n = 12) mice during the first 12 hrs of running wheel exposure (Two-way repeated measures ANOVA: Time effect, F(7.449,201.1) = 20.81, P<0.0001; treatment effect, F (2, 27) = 12.97, P<0.0001; time × treatment, F (286, 3861) = 2.954, P<0.0001). (Right) Quantification of revolutions across the 12-hr period (one-way ANOVA followed by two-sided Dunnett’s test: F (2, 27) = 12.97. Group comparisons, WT-Cre versus Drd3fl-fl-Cre, **** P<0.0001, Drd3fl-fl-GFP versus Drd3fl-fl-Cre, ****P<0.0001). e. Representative occupancy heatmaps from WT (top) and NAc- D3RcKO(bottom) mice during running disks choice test. f. (Left) Quantification of time spent on the freely-moving and fixed disk (WT-Cre, n = 11 mice; Drd3fl/fl-GFP, n = 6 mice; NAc-D3RcKO, n = 12 mice) (Two-way repeated measures ANOVA: Disk effect, F (1, 52) = 81.22, P<0.0001; treatment effect, F (2, 52) = 14.65, P<0.0001; disk × treatment, F (2, 52) = 28.59, P<0.0001). (Middle) Revolutions registered on the freely-moving disk for WT, Drd3fl/fl-GFP controls and NAc-D3RcKO mice (one-way ANOVA followed by two-sided Dunnett’s test: F (2, 27) = 12.97. Group comparisons, WT-Cre versus Drd3fl-fl-Cre, **** P<0.0001, Drd3fl-fl-GFP versus Drd3fl-fl-Cre, ****P<0.0001). (Right) Spearman’s correlation between time spent on the freely-moving disk and revolutions. g. Timeline of operant conditioning experiment. h. Number of active (filled) and inactive (unfilled) lever presses of WT (black, n = 15 mice) and NAc-D3RcKO (blue, n = 11 mice) animals during FR1 acquisition sessions (Two-way repeated measures ANOVA: Session effect, F (3.679, 86.09) = 38.81, P<0.0001; genotype effect, F (1, 24) = 0.5573, P = 0.4626; session × genotype, F (5, 117) = 1.334, P = 0.2546). i. Number of active and inactive lever presses of WT (black, n = 15 mice) and NAc-D3RcKO (blue, n = 11 mice) animals during FR5 acquisition sessions (Two-way repeated measures ANOVA: Session effect, F (4.068, 97.05) = 2.321, P = 0.0611; genotype effect, F (1, 24) = 2.228, P = 0.1486; session × genotype, F (7, 167) = 2.360, P = 0.252). j. (Left) Scheme of the FR5 choice behavioral setup. Mice had free access to standard lab chow and could also lever press (FR5) to obtain higher-palatable chocolate food pellets. (Right) Amount of food consumed represented as effort-based (FR5; solid) or freely-available lab chow (checkered) (WT, n = 11 mice; NAc-D3RcKO, n = 11 mice) (Two-way repeated measures ANOVA: Type of food effect, F (1, 24) = 17.97, P = 0.0003; genotype effect, F (1, 24) = 0.2095, P = 0.6513; type of food × genotype, F (1, 24) = 6.883, P = 0.0149). k, l. Break points for WT and NAc-D3RcKO mice during PR3 (k) (Two-way repeated measures ANOVA: Session effect, F (1.436, 32.30) = 3.507, P = 0.0559; genotype effect, F (1, 24) = 5.679, P = 0.0254; session × genotype, F (2, 45) = 0.4779, P = 0.6232) and PR7 (l) (Two-way repeated measures ANOVA: Session effect, F (1.833, 43.99) = 1.672, P = 0.2014; genotype effect, F (1, 24) = 12.61, P = 0.0016; session × genotype, F (3, 72) = 1.920, P = 0.1341) sessions (WT, n = 11 mice; NAc-D3RcKO, n = 11 mice). All data in this figure are presented as mean ± SEM. Error bars indicate SEM. Detailed figure statistics are included in Supplementary Table 1. Schematics were generated using Biorender.
Figure 2.
Figure 2.. mNAcSh D3Rs are primarily expressed in D1-MSNs and D3-MSNs display D1-MSN projection pattern (see also Extended Data Figure 3)
a. Representative low-magnification confocal image of RNA in situ hybridization for Drd1a (green), Drd2 (red), and Drd3 (white) transcripts in the NAc. Orange inset shows the region targeted for zoomed images in b. b.Split high-magnification images of Drd1a/Drd3, Drd2/Drd3, and Drd3 RNA expression in the mNAcSh. Right image is an overlay of all channels. Filled arrowheads show co-labeled cells, and empty arrowheads show single-labeled cells. c. Percentage of Drd3+ cells co-expressing Drd1a or Drd2 RNA in the mNAcSh of WT mice (n = 3 mice; unpaired t-test (two-tailed), t (4) = 127.3; ****P<0.0001). d. Percentage of Drd1a+ or Drd2+ cells co-expressing Drd3 mRNA in the mNAcSh (n = 3 mice; unpaired t-test (two-tailed), t (4) = 33.52; ****P<0.0001). e. Mean relative expression levels of Drd3 mRNA (mean integrated density/area) relative to D1-MSNs in Drd3-mRNA-positive D2-MSNs (n = 3 mice; unpaired t-test (two-tailed), t (4) = 3.598; *P = 0.0228). f. (Left) Schematic for quantification of Drd3+ cells using electrophysiological recordings. (Right) Representative trace showing light-evoked ChR2-mediated inward current in a ChR2-EYFP+ NAc MSN evoked by 1 s stimulation with 470 nm blue light. Pie-chart shows quantification of tdTomato-positive (i.e. D1-MSN) vs tdTomato-negative (putative D2-MSNs) in recorded ChR2 positive cells. g. (Left) Cre-dependent AAV-Syn-FLEX-tdTomato-T2A-SynaptophysinGFP was injected in the mNAcSh of Drd3-Cre mice to visualize fibers (red) and synaptic terminals (green) in the outputs from D3-MSNs. (Right) Representative images showing a high density of NAc D3-MSN synaptic terminals in the VP, LH and VTA. h-j. (Left) Schematic of the electrophysiology experiment to assess functional connectivity from NAc D3-MSNs. A Cre-dependent AAV vector expressing ChR2-eYFP was injected in the mNAcSh of Drd3-Cre mice. Acute slices containing the VP, LH or VTA were prepared from brains of Drd3-Cre mice 2–3 weeks after viral injection. (Right) Representative trace showing oIPSCs in VP, LH, and VTA cells. Red trace denotes bath-application of picrotoxin (PTX). k. Mean oIPSC amplitudes evoked by light stimulation of NAc D3-MSN terminals vs. connectivity of D3-MSNs to neurons VP, LH, and VTA. oIPSCs were detected in the majority of neurons recorded (VP, n= 11 of 12 neurons/7 mice; LH, n= 12 of 14 neurons/8 mice; VTA, n= 11 of 14 neurons/9 mice; one-way ANOVA followed by two-sided Tukey’s test: F (2, 29) = 1.993. Group comparisons, VP versus LH, **P = 0.0025, VP versus VTA, *P = 0.013, LH versus VTA, P = 0.937). l. (Left) Schematic of the retrograde tracing approach to compare NAc Drd3-expressing projection MSNs. Red retrobeads were injected into the VP, LH or VTA of WT mice. NAc sections were probed for Drd3 mRNA using in situ hybridization. (Right) Representative 20X confocal images showing retrobead labeling from VP-, LH- or VTA-projecting NAc MSNs (top). High-magnification images showing red-labeled retrobeads in the NAc co-localized with Drd3 mRNA indicated by filled arrowheads (bottom). m. Quantification of the percentage of retrobead+ cells projecting to VP (n = 5 mice), LH (n = 3 mice) or VTA (n = 3 mice) that express Drd3 in the NAc (one-way ANOVA followed by two-sided Tukey’s test: F (2, 8) = 17.69. Group comparisons, VP versus LH, **P = 0.0078, VP versus VTA, **P = 0.0015, LH versus VTA, P = 0.4929). n. Mean expression levels of Drd3 mRNA (mean integrated density/area) in neurons projecting to VP (n = 5 mice), LH (n = 3 mice) or VTA (n = 3 mice) (one-way ANOVA followed by two-sided Tukey’s test: F (2, 8) = 14.83. Group comparisons, VP versus LH, **P = 0.0025, VP versus VTA, *P = 0.013, LH versus VTA, P = 0.5325). All data in this figure are presented as mean ± SEM, Error bars indicate SEM.
Figure 3.
Figure 3.. NAc D3R is essential for motivated behavior independent of projection neuron (see also Extended Data Figure 4 and 5)
a. Diagram of viral injections for pathway-specific deletion of NAc Drd3 from distinct MSN projections. Flp-dependent Cre and Cre-dependent tdTomato were injected bilaterally in the NAc of wild-type (WT) or Drd3fl/fl, and CAV-Flp-GFP was injected in the VP, LH or VTA to selectively knockdown Drd3 expression in VP, LH or VTA-projecting NAc MSNs. b. (Left) Scheme showing fDIO-dependent Cre expression and recombination resulting in excision of exon 1 of the Drd3 gene between flanking loxP sites. (Right) Representative images of GFP and tdTomato expression in mNAcSh MSNs. Note: AAV-fDIO-Cre did not cause recombination in Ai14-tdTomato reporter mice injected in the mNAcSh (Extended data Fig. 4b). c-e. Time-course (left) and revolutions (right) of wheel-running activity during the first 12 hrs of running wheel exposure in WT or Drd3fl/fl mice with pathway-specific deletion in the VP (Fig. 3c; unpaired t-test (two-tailed), t (10) = 3.261; **P = 0.0086), LH (Fig. 3d; unpaired t-test (two-tailed), t (9) = 2.388; *P = 0.0407) and VTA (Fig. 3e; unpaired t-test (two-tailed), t (12) = 2.819; *P = 0.0155). f-h. Quantification of both time spent and wheel revolutions on the freely-moving and fixed disk for mice with the following injections: WT-VP (n = 5 mice) and Drd3fl/fl -VP (n = 7 mice) (Fig. 3f; time spent two-way repeated measures ANOVA: Disk effect, F (1,22) = 14.35, P = 0.01; genotype effect, F (1, 22) = 5.528, P = 0.0281; disk × genotype, F (1,22)= 6.613, P = 0.0174; revolutions unpaired t-test (two-tailed), t (11) = 4.909; ***P = 0.0005), WT-LH (n = 5 mice) and Drd3fl/fl -LH (n = 6 mice) (Fig. 3g; time spent two-way repeated measures ANOVA: Disk effect, F (1,14) = 48.84, P<0.0001; genotype effect, F (1, 14) = 11.43, P = 0.0045; disk × genotype, F (1,14)= 17.13, P = 0.001; revolutions unpaired t-test (two-tailed), t (9) = 6.117; ***P = 0.0002), and WT-VTA (n = 5 mice) and Drd3fl/fl -VTA (n = 9 mice) (Fig. 3h; time spent two-way repeated measures ANOVA: Disk effect, F (1,24) = 10.93, P = 0.003; genotype effect, F (1, 24) = 3.092, P = 0.0914; disk × genotype, F (1,24)= 7.790, P = 0.0101; revolutions unpaired t-test (two-tailed), t (12) = 3.825; **P = 0.0024). i. Number of active and inactive lever presses of WT (black, n = 12 mice), Drd3fl/fl- VP (orange, n = 7 mice), Drd3fl/fl-LH (pink, n = 6 mice) and Drd3fl/fl-VTA (purple, n = 7 mice) animals during FR1 sessions (two-way repeated measures ANOVA: Session effect, F (3.340, 82.84) = 57.05, P <0.0001; genotype effect, F (3, 26) = 0.3733, P = 0.7729; session × genotype, F (15,124)= 1.452, P = 0.1341). j. Amount of freely-available food consumed in the FR5 choice task (WT, n = 10 mice; Drd3fl/fl -VP, n = 7 mice; Drd3fl/fl -LH, n = 6 mice; Drd3fl/fl -VTA, n = 7 mice; one-way ANOVA followed by two-sided Dunnett’s test: F (3, 28) = 5.602. Group comparisons, WT versus Drd3fl/fl-VP, P = 0.0572, WT versus Drd3fl/fl-LH, *P = 0.0219, WT versus Drd3fl/fl-VTA, **P = 0.0031). k. Break points for WT and Drd3fl/fl mice during PR7 sessions (WT, n = 13 mice; Drd3fl/fl -VP, n = 7 mice; Drd3fl/fl -LH, n = 7 mice; Drd3fl/fl -VTA, n = 8 mice; one-way ANOVA followed by two-sided Dunnett’s test: F (3, 31) = 5.322. Group comparisons, WT versus Drd3fl/fl-VP, *P = 0.0131, WT versus Drd3fl/fl-LH, **P = 0.0043, WT versus Drd3fl/fl-VTA, P = 0.2061). All data in this figure are presented as mean ± SEM Error bars indicate SEM. Schematics were generated using Biorender.
Figure 4.
Figure 4.. D3Rs regulate GABAergic transmission from NAc collaterals and to the VP via a presynaptic site of action (see also Extended Data Figure 6)
a. (Left) Diagram of virus injection of AAV-EF1a-DIO-ChR2-eYFP (Cre-ON) and AAV-EF1a-DO-ChR2-eYFP (Cre-OFF) in the NAc of Drd1a-tdTomato/Drd3-Cre mice. (Right) ChR2-eYFP–expressing cell bodies of D3R-positive (top) and D3R-negative (bottom) terminals in the mNAcSh (top) and total NAc area (bottom). Note the lack of expression in the Islands of Calleja (ICj) in mice expressing Cre-OFF ChR2 in the ventral striatum. b. oIPSCs originating from D3R-positive and D3R-negative collaterals were recorded from mNAcSh D1- or D2- MSNs. c,g,k,o. Time-course of oIPSCs in mNAcSh MSNs (Fig. 4c; two-way repeated measures ANOVA: Time effect, F (3.099, 89.38) = 39.75, P<0.0001; treatment effect, F (1, 29) = 28.21, P<0.0001; time × treatment, F (19, 548) = 13.08, P<0.0001), VP cells (Fig. 4g; two-way repeated measures ANOVA: Time effect, F (1.912, 34.41) = 11.18, P = 0.0002; treatment effect, F (1, 18) = 7.030, P = 0.0162; time × treatment, F (19, 342) = 4.923, P<0.0001), LH cells (Fig. 4k, n = 9 cells/8 mice), and VTA cells (Fig. 4o, n = 10 cells/8 mice) before, during and after bath application of the D3R-selective agonist PD-128907 (1 μM). For mNAcSh MSNs and VP neurons, Cre-ON groups are shown in blue (mNAcSh MSN collaterals, n = 16 cells/9 mice) or VP neurons (orange, n = 10 cells/7 mice) while the Cre-OFF group is shown in black (n = 15 cells/7 mice for NAc; n = 10 cells from 6 mice for VP). (Inset) Representative oIPSCs traces recorded in mNAcSh MSNs before and after bath application of PD-128907, d,h,l,p. Paired-pulse ratio (PPR, % baseline) versus oIPSC (% baseline) for mNAcSh MSNs (Fig. 4d; PPR unpaired t-test (two-tailed), t (29) = 2.732; *P = 0.0106; oIPSC amplitude unpaired t-test (two-tailed), t (29) = 5.181; ****P <0.0001), VP cells (Fig. 4h; PPR unpaired t-test (two-tailed), t (18) = 2.457; *P = 0.0244; oIPSC amplitude unpaired t-test (two-tailed), t (18) = 2.503; *P = 0.0222), LH cells (Fig. 4l), and VTA cells (Fig. 4p). e,i,m. Coefficient of variation (1/CV, % baseline) versus oIPSC (% baseline) for mNAcSh MSNs (Fig. 4e; 1/CV unpaired t-test (two-tailed), t (29) = 3.632; **P = 0.0011; oIPSC amplitude unpaired t-test (two-tailed), t (29) = 5.181; ****P <0.0001), VP cells (Fig. 4i; 1/CV unpaired t-test (two-tailed), t (18) = 2.457; *P = 0.0455; oIPSC amplitude unpaired t-test (two-tailed), t (18) = 2.148; *P = 0.0222), and LH cells (Fig. 4m). f,j,n. (Left) Images of ChR2-eYFP-containing terminals in VP for Cre-ON (top) and Cre-OFF (bottom) conditions (Fig. 4f). Note the larger fiber density in the Cre-OFF condition arising from D3R-lacking D1-MSNs and D2-MSNs. (Right) oIPSCs originating from D3R-positive and D3R-negative MSNs were recorded from VP neurons. Fig. 4j and 4n show images of ChR2-positive fibers in the LH and VTA (left) and schematic depicting evoked GABA release from D3-MSNs onto LH and VTA cells, respectively (right). q. Summary graph of the inhibition of oIPSCs by PD-128907 from mNAcSh (n = 16 cells from 9 mice), VP (n = 10 cells/7 mice), LH (n = 9 cells/8 mice) or VTA (n = 10 cells/8 mice) neurons in Cre-ON condition (one-way ANOVA followed by two-sided Tukey’s test: F (3, 41) = 6.750. Group comparisons, NAc versus VP, P > 0.9999, NAc versus LH, **P = 0.0051, NAc versus VTA, *P = 0.02, VP versus LH, *P = 0.013, VP versus VTA, *P = 0.0436, LH versus VTA, P = 0.9451). All data in this figure are presented as mean ± SEM Error bars indicate SEM.
Figure 5.
Figure 5.. Motivated behavior requires local D3R signaling within the mNAcSh (see also Extended Data Figure 7)
a. Diagram (top) and representative image (bottom) of bilateral microinjection of the D3R antagonist SB-277011A (1.79 ng per hemisphere) into the mNAcSh of WT mice. Red retrobeads were infused after the experiment to confirm accuracy of cannula placement. b. Cannula tip placements for saline (top) and SB-277011A (bottom) groups. c. (Left) Percentage of time spent on the freely-moving and fixed disk for saline (white, n = 7 mice) and D3R antagonist (blue, n = 8 mice) groups during the running-disk choice task (two-way repeated measures ANOVA: Disk effect, F (1, 26) = 25.56, P<0.0001; treatment effect, F (1, 26) = 6.573, P = 0.0165; disk × treatment, F (1, 26) = 10.83, P = 0.0029). (Right) Number of revolutions recorded in the freely moving disk (unpaired t-test (two-tailed), t (13) = 3.206; **P = 0.0069). d. Diagram (top) and representative images (bottom) of selective inactivation of local mNAcSh D3R function using functional disconnection experiments. Mice were injected unilaterally with AAV8-Syn-GFP-Cre into the mNAcSh of Drd3fl/fl mice. Ipsilateral (control) and contralateral disconnection (experimental) groups were infused with SB-277011A into the ipsilateral or contralateral mNAcSh, respectively. e. Diagram describing rationale for disconnection procedures. In the ipsilateral group (left), one hemisphere was targeted with SB-277011A and AAV-GFP-Cre to suppress D3R signaling within the mNAcSh and at terminals in the VP, while the other hemisphere had intact D3R signaling. For the contralateral group, the only common D3R dysfunction in both hemispheres was local D3R signaling within the mNAcSh (purple circles), which was targeted by antagonist infusion and contralateral injection of AAV-GFP-Cre. f. Percentage of time spent on the freely-moving (solid) and fixed disk (checkered) for ipsilateral control (white, n = 9 mice) and contralateral disconnection (blue, n = 8 mice) groups (two-way repeated measures ANOVA: Disk effect, F (1, 30) = 18.60, P = 0.0002; treatment effect, F (1, 30) = 2.149, P = 0.1531; disk × treatment, F (1, 30) = 10.30, P = 0.0032). g. Number of revolutions registered in the freely moving disk (ipsilateral, n = 9 mice; contralateral, n = 8 mice; unpaired t-test (two-tailed), t (15) = 3.072; **P = 0.0077). All data in this figure are presented as mean ± SEM. Error bars indicate SEM. Schematics were generated using Biorender.
Figure 6:
Figure 6:. mNAcSh D1Rs mediate reinforcement but not motivation (see also Extended Data Figure 8)
a. Scheme (top) and representative image (bottom) depicting the mNAcSh area targeted with AAV-GFP-Cre (green) for experiments shown in b-i. b-c. Number of active (filled) and inactive (unfilled) lever presses of WT (black, n = 15 mice), NAc-D3RcKO (blue, n = 11 mice) and NAc-D1RcKO (green, n = 15 mice) animals during sessions with FR1 (two-way repeated measures ANOVA: Session effect, F (5, 225) = 28.09, P<0.0001; genotype effect, F (2, 225) = 22.75, P<0.0001; session × genotype, F (10, 225) = 2.009, P = 0.0335) and FR5 (two-way repeated measures ANOVA: Session effect, F (4.192, 158.1) = 3.664, P = 0.0061; genotype effect, F (2, 38) = 1.288, P = 0.2876; session × genotype, F (14, 264) = 2.455, P = 0.0029) schedules of reinforcement. d. Amount of food consumed during the effort-related choice task represented as FR5 effort-based (solid) or freely-available lab chow (checkered) (WT, n = 15 mice; NAc-D3RcKO, n = 11 mice; NAc-D1RcKO, n = 15 mice; two-way repeated measures ANOVA: Type of food effect, F (1, 38) = 54.48, P<0.0001; genotype effect, F (2, 38) = 0.3460, P = 0.7098; type of food × genotype, F (2, 38) = 5.604, P = 0.0074). e. Break points for WT, NAc-D3RcKO and NAc-D1RcKO mice during PR7 sessions (WT, n = 15 mice; NAc-D3RcKO, n = 11 mice; NAc-D1RcKO, n = 15 mice; two-way repeated measures ANOVA: Session effect, F (2.083, 77.06) = 1.343, P = 0.2673; genotype effect, F (2, 38) = 7.908, P = 0.0013; session × genotype, F (6, 111) = 1.458, P = 0.1992). f. (Left) Timecourse of wheel-running activity during the initial 12 hr period of wheel exposure (in the animal’s inactive cycle) in WT-Cre (n = 11 mice), NAc-D3RcKO (n = 12 mice) and NAc-D1RcKO mice (n = 8 mice) (two-way repeated measures ANOVA: Time effect, F (7.527, 210.7) = 16.63, P<0.0001; genotype effect, F (2, 28) = 10.86, P = 0.0003; time × genotype, F (286, 4004) = 2.216, P<0.0001). (Right) Quantification of revolutions during the 12 hr period (one-way ANOVA followed by two-sided Dunnett’s test: F (2, 28) = 12.20. Group comparisons, NAc-D1RcKO versus WT, P = 0.1044, NAc-D1RcKO versus NAc-D3RcKO, *P = 0.0324). g. Quantification of time and revolutions for WT (n = 11 mice), NAc-D3RcKO (n = 12 mice) and NAc-D1RcKO (n = 8 mice) groups during the running disk choice task. (Left) Percentage of test time spent on the freely-moving and fixed disk (two-way repeated measures ANOVA: Disk effect, F (1, 28) = 98.11, P<0.0001; genotype effect, F (2, 28) = 20.86, P<0.0001; disk × genotype, F (2, 28) = 33.49, P<0.0001). (Right) Number of revolutions recorded in the freely moving disk for each group (one-way ANOVA followed by two-sided Dunnett’s test: F (2, 28) = 56.43. Group comparisons, NAc-D1RcKO versus WT, P = 0.0614, NAc-D1RcKO versus NAc-D3RcKO, ****P<0.0001). h. Scheme of the platform-mediated avoidance task. Mice were placed in an operant box and were presented with 20 pairings of conditioned stimulus (CS) and a footshock as the unconditioned stimulus (US). Animals could step onto the platform to actively avoid a footshock. i. Quantification of trial outcome (avoidance or shock) as percentage of total trials for day 1 (left; two-way repeated measures ANOVA: Outcome effect, F (1, 35) = 31.35, P<0.0001; genotype effect, F (2, 35) = 1.089, P = 0.3478; outcome × genotype, F (2, 35) = 6.589, P = 0.0037) and percent time spent on the platform for day 1 (right; one-way ANOVA followed by two-sided Dunnett’s test: F (2, 35) = 14.14. Group comparisons, NAc-D1RcKO versus WT, ****P<0.0001, NAc-D1RcKO versus NAc-D3RcKO, ***P = 0.0004) in WT-Cre (n = 12 mice), NAc-D3RcKO (n = 9 mice) and NAc-D1RcKO mice (n = 17 mice). j. Pavlovian conditioning procedures. Experiments involved learning to discriminate reward-predictive cues (CS+) (top) and a neutral cue (CS−) (bottom), as well as subsequent extinction procedures. k. Timecourse of nosepokes for the last day of training on CS+ (left; two-way repeated measures ANOVA: Time effect, F (3.834, 115.0) = 115.6, P<0.0001; genotype effect, F (2, 30) = 1.025, P = 0.371; time × genotype, F (40, 620) = 1.175, P = 0.2174) and CS− (right; two-way repeated measures ANOVA: Time effect, F (2.974, 92.18) = 2.280, P = 0.0851; genotype effect, F (2, 31) = 1.222, P = 0.3083; time × genotype, F (40, 620) = 0.6634, P = 0.9458) sessions for WT-Cre (n = 11 mice), NAc-D3RcKO (n = 14 mice) and NAc-D1RcKO (n = 8 mice) mice. l. Quantification of the area under the curve (AUC) after CS in WT (n = 11 mice), NAc-D3RcKO (n = 14 mice), and NAc-D1RcKO (n = 8 mice) groups for sessions 1, 3 and 6 of reward learning for CS+ (two-way repeated measures ANOVA: Session effect, F (2, 56) = 28.90, P<0.0001; genotype effect, F (2, 29) = 0.6674, P = 0.5208; session × genotype, F (4, 56) = 0.5773, P = 0.0.6803) and CS− sessions (left) and extinction sessions on days 7 and 8 (right). Note: operant and running data from WT and NAc-D3RcKO groups were acquired concomitantly with NAc-D1RcKO mice and were replicated from Fig. 1. Thus, data from WT and NAc-D3RcKO groups are displayed differently (mean and error bars). All data in this figure are presented as mean ± SEM Error bars indicate SEM. Schematics were generated using Biorender.
Figure 7:
Figure 7:. D3R and D1Rs regulate separable synaptic features of mNAcSh D1-MSNs (see also Extended Data Figure 8)
a. Schematic showing location of patch-clamp recordings (left) and glutamate uncaging (right). MNI-Glutamate (50 μM) was uncaged using 365 nm UV light (150 ms pulses) and biophysically-isolated NMDAR-currents were recorded at +40 mV from mNAcSh D1-MSNs using DNQX (10 μM), PTX (50 μM) and tetrodotoxin (TTX; 1 μM). b. Representative traces of evoked NMDAR currents in mNAcSh D1-MSNs before and after bath-application of the D1R agonist SKF-81297 (green, top), application of SKF-81297 in the presence of the D1R antagonist SCH-39166 (grey, middle) and application of the D3R agonist PD-128907 (blue, bottom). Red trace indicates that evoked NMDAR currents were eliminated with AP5 (50 μM) application. Purple bars indicate UV light pulses. c. Time-course of normalized NMDAR-current amplitude in mNAcSh D1-MSNs before and during bath application of SKF-81297 (10 μM, green, n = 10 cells/6 mice), preincubation with SCH-39166 (1 μM) and application of SKF-81297 (black, n = 5 cells/4 mice) or application of PD-128907 (1 μM, blue, n = 10 cells/6 mice) (two-way repeated measures ANOVA: Time effect, F (1.610, 35.42) = 11.61, P = 0.0003; treatment effect, F (2, 22) = 6.713, P = 0.0053; time × treatment, F (28, 308) = 5.628, P<0.0001). d. Amplitude of evoked NMDAR currents after treatment with SKF-81297 (n = 10 cells/6 mice), preincubation with SCH-39166 (n = 5 cells/4 mice) and treatment with SKF and application of PD-128907 (n = 10 cells/6 mice) (% baseline) (one-way ANOVA followed by two-sided Dunnett’s test: F (2, 22) = 7.070. Group comparisons, SKF-81297 versus SCH-39166, **P = 0.0094, SKF-81297 versus PD-128907, **P = 0.0084). e. Schematic of experimental details to demonstrate D1R-NMDAR interactions and validation of Drd1a cKO in NAc of Drd1afl/fl mice. AAV8-Syn-GFP-Cre was injected bilaterally in the mNAcSh of WT or Drd1afl/fl mice to genetically ablate Drd1a, and the retrograde tracer CTB-594 was injected in the LH or VTA to selectively label NAc D1-MSNs. f. Representative images of CTB injection sites in LH and VTA, and colabelling of GFP and CTB in the mNAcSh. Recordings were made from colabeled GFP+/CTB+ mNAcSh MSNs. g. Time-course of normalized NMDAR-current amplitude in mNAcSh D1-MSNs before and during and after bath application of SKF-81297 in WT (n = 8 cells/4 mice) or Drd1afl/fl (n = 8 cells/5 mice) groups (two-way repeated measures ANOVA: Time effect, F (3.710, 51.68) = 8.461, P<0.0001; treatment effect, F (1, 14) = 37.23, P<0.0001; time × treatment, F (14, 195) = 10.78, P<0.0001). (Inset) Representative NMDAR traces recorded in mNAcSh D1-MSNs for each genotype. h. INMDAR (% baseline) change after treatment with SKF-81297 for WT (n = 8 cells from 4 mice) and Drd1a (n = 8 cells from 5 mice) groups (unpaired t-test (two-tailed), t (14) = 5.383; ****P<0.0001). i. Schematics of experiment to determine regulation of mNAcSh collaterals by D1Rs and D3Rs. Drd1a-tdTomato/Drd3-Cre mice we injected with AAV5-Ef1a-DIO-ChR2-eYFP (Cre-ON) in the mNAcSh (top) and GABA release was evoked from D3R-positive terminals (1ms pulses). Biophysically-isolated oIPSCs were recorded from mNAcSh D1-MSNs (bottom). j. Time-course of oIPSCs in mNAcSh MSNs from D3R collaterals before, during and after bath application of SKF-12897 (n = 12 cells from 6 mice) or PD-128907 (n = 16 cells from 9 mice) (two-way repeated measures ANOVA: Time effect, F (6.474, 167.3) = 26.75, P<0.0001; treatment effect, F (1, 26) = 16.74, P = 0.0004; time × treatment, F (19, 491) = 7.256, P<0.0001). (Inset) Representative traces recorded in mNAcSh MSNs before and after bath application of PD-128907 (blue) or SKF-81297 (green). Note: data using PD-12897 were replicated from Fig. 4 and was therefore displayed with different error bars. k. Paired-pulse ratio (PPR, % baseline) versus oIPSC (% baseline) (SKF-12897, n = 12 cells from 6 mice; PD-128907, n = 16 cells from 9 mice) (PPR unpaired t-test (two-tailed), t (26) = 2.146; *P = 0.0414; oIPSC amplitude unpaired t-test (two-tailed), t (26) = 4.803; ****P <0.0001). l. Coefficient of variation (1/CV2, % baseline) versus oIPSC (% baseline) (SKF-12897, n = 12 cells from 6 mice; PD-128907, n = 16 cells from 9 mice) (1/CV2 unpaired t-test (two-tailed), t (26) = 2.271; *P = 0.0317; oIPSC amplitude unpaired t-test (two-tailed), t (26) = 4.803; ****P <0.0001). m. Diagram of disconnection procedures of D1R and NMDAR function in the mNAcSh. Mice were injected unilaterally with AAV-Syn-GFP-Cre into the mNAcSh of Drd1afl/fl mice. Ipsilateral control (left) and contralateral disconnection (right) groups were infused with AP5 into the ipsilateral or contralateral mNAcSh, respectively. n. Change in active lever presses lever presses under an FR1 schedule of reinforcement relative to Day 1 in ipsilateral (black, n = 8 mice) and contralateral (blue, n = 7 mice) groups. AP5 was microinjected on Day 2 of FR1 sessions (day 2 unpaired t-test (two-tailed), t (13) =6.001; ***P = 0.0003). All data in this figure are presented as mean ± SEM Error bars indicate SEM. Schematics were generated using Biorender.

Update of

References

    1. Wise RA Dopamine, learning and motivation. Nature Reviews Neuroscience 5, 483–494 (2004). - PubMed
    1. Volkow ND, Wise RA & Baler R The dopamine motive system: implications for drug and food addiction. Nature Reviews Neuroscience 18, 741–752 (2017). - PubMed
    1. Russo SJ & Nestler EJ The brain reward circuitry in mood disorders. Nature Reviews Neuroscience 14, 609–625 (2013). - PMC - PubMed
    1. Castro DC & Bruchas MR A Motivational and Neuropeptidergic Hub: Anatomical and Functional Diversity within the Nucleus Accumbens Shell. Neuron 102, 529–552 (2019). - PMC - PubMed
    1. Berke JD What does dopamine mean? Nature Neuroscience 21, 787–793 (2018). - PMC - PubMed

LinkOut - more resources