. 2025 Jan;17(1):85-111.
doi: 10.1038/s44321-024-00168-1. Epub 2024 Dec 9.

A novel anti-epileptogenesis strategy of temporal lobe epilepsy based on nitric oxide donor

Affiliations

A novel anti-epileptogenesis strategy of temporal lobe epilepsy based on nitric oxide donor

Xian-Hui Zhu et al. EMBO Mol Med. 2025 Jan.

Abstract

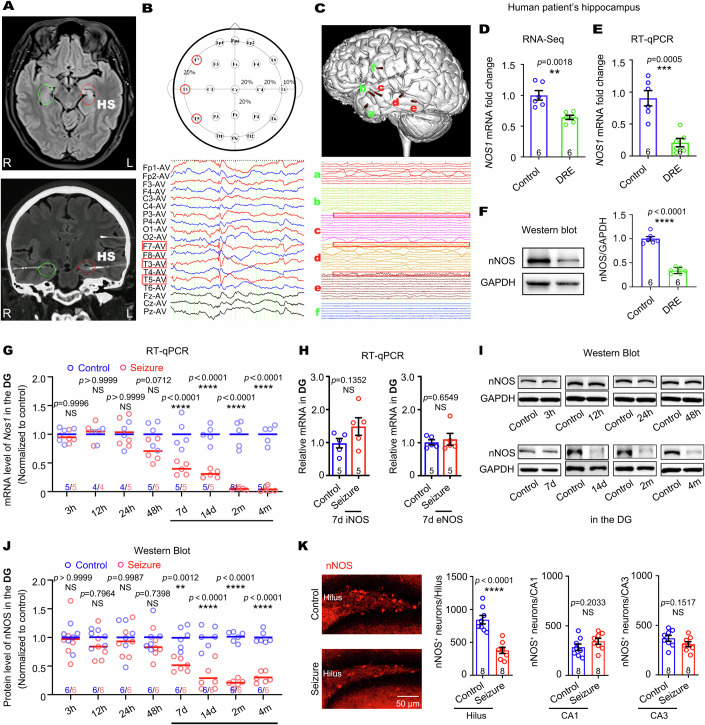
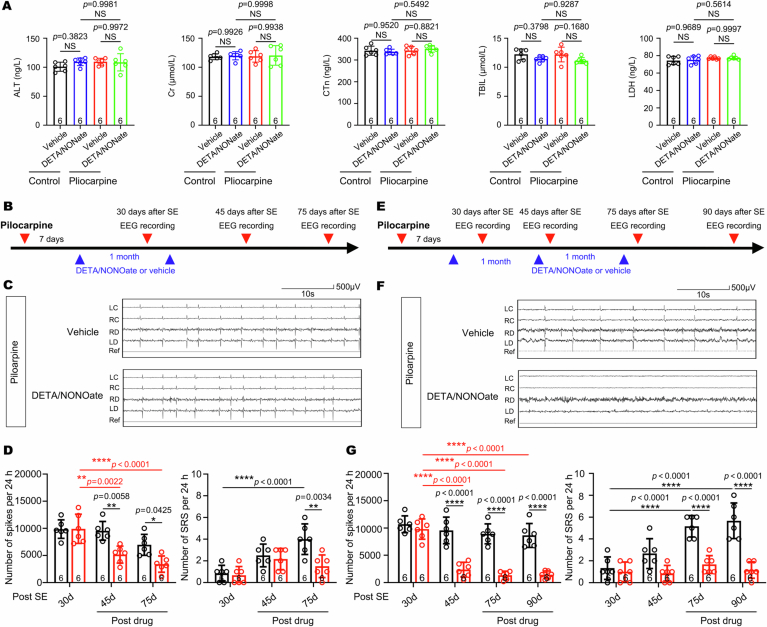
The molecular mechanism underlying the role of hippocampal hilar interneuron degeneration in temporal lobe epilepsy (TLE) remains unclear. Especially, very few studies have focused on the role of neuronal nitric oxide synthase (nNOS, encoded by Nos1) containing hilar interneurons in TLE. In the present study, Nos1 conditional knockout mice were constructed, and we found that selective deletion of Nos1 in hilar interneurons rather than dentate granular cells (DGCs) triggered epileptogenesis. The level of nNOS was downregulated in patients and mice with TLE. Nos1 deletion led to excessive epilepsy-like excitatory input circuit formation and hyperexcitation of DGCs. Replenishment of hilar nNOS protein blocked epileptogenic development and memory impairment in pilocarpine-induced TLE mice. Moreover, chronic treatment with DETA/NONOate, a slowly released exogenous nitric oxide (NO) donor, prevented aberrant neural circuits of DGCs and the consequent epileptogenesis without acute antiseizure effects. Therefore, we concluded that NO donor therapy may be a novel anti-epileptogenesis strategy, different from existing antiseizure medications (ASMs), for curing TLE.

Keywords: Dentate Granule Cells; Epileptogenesis; Hilar Interneurons; Neuronal Nitric Oxide Synthase; Pilocarpine.


Conflict of interest statement

Disclosure and competing interests statement. The authors declare no competing interests.

Figures

Figure 1
Figure 1. nNOS is reduced in epileptogenic hippocampus of patients and TLE mouse models.
(A) MRI FLAIR images of a patient (case 1) showing a left hippocampal sclerosis (HS). L: left; R: right. (B) Interictal spike-wave discharges was recorded by the ECoG using the International 10–20 EEG system in the left temporal lobe. The F7, T3, and T5 electrodes captured EEG discharges in the left anterior temporal lobe, middle temporal lobe, posterior temporal lobe, and adjacent brain regions, respectively. (C) Position of deep brain electrodes and their discharges on the brain surface in SEEG monitoring. ‘Electrode c’ ran from the anterior part of the left middle temporal gyrus to the head of the hippocampus, ‘electrode d’ from the middle part of the left middle temporal gyrus to the hippocampus body, and ‘electrode e’ from the posterior part of the left middle temporal gyrus to the hippocampus tail. The topmost channel of each electrode represented the innermost contact, and the bottommost channel represented the outermost contact. Thus, the topmost channels of c, d, and e reflected the head, body, and tail of the hippocampus, respectively, showing discharges from the left hippocampus. (D) RNA-Seq analysis showing reduced nNOS transcription in the hippocampus of patients with DRE. Students’ t-test, n = 6 subjects. (E) RT-qPCR analysis confirming low levels of NOS1 in the hippocampus of patients with DRE. Students’ t-test, n = 6 subjects. (F) Western blot analysis showing low levels of nNOS protein in the hippocampus of patients with DRE. Students’ t-test, n = 6 subjects. (G) The data graph showed the mRNA level of Nos1 in DG measured by qPCR 3, 12, 24, 48 h, 7, 14 days, or 2 months after pilocarpine-induced SE. Two-way ANOVA, n = 4–6 mice. (H) qPCR data showed no change in the levels of iNOS and eNOS mRNA in DG 7 days after pilocarpine-induced SE. Students’ t-test, n = 5 mice. (I, J) Western blot analysis showed the protein level of nNOS in the DG 3, 12, 24, 48 h, 7, 14 days, or 2 months after pilocarpine-induced SE. Two-way ANOVA, n = 6 mice. (K) Representative photos of nNOS immunoreactivity in the DG of control and pilocarpine-induced SE. Data graph showing the number of nNOS+ cells in the HL, CA1, and CA3 regions. Students’ t-test, n = 8 mice. Error bars correspond to ± s.e.m. **P < 0.01, ***P < 0.001, ****P < 0.0001, NS, not significant. Source data are available online for this figure.
Figure 2
Figure 2. Increased susceptibility to pilocarpine-induced status epilepticus and epileptogenesis in Nos1−/− mice.
(A) Heat map and data graph showing cumulative seizure score for 3 h after pilocarpine treatment at a dose of 230 mg/kg in Nos1−/− and WT mice. Student’s t-test, n = 10 mice. (B) Heat map and data graph showing cumulative seizure score during 3 h after pilocarpine treatment at a dose of 100 mg/kg in Nos1−/− and WT mice. Student’s t-test, n = 10 mice. (C) Representative pictures of EEG recording and data graph showing normal brain waves in the brain of WT mice and epileptic spikes in the brain of Nos1−/− mice. Student’s t-test, n = 6 mice. (D) Representative images of EEG recordings and data graph showing epileptic spikes in the brain of WT mice without SRS, and epileptic spikes as well as SRS in the brain of Nos1−/− mice 2.5 months after pilocarpine administration at a dose of 200 mg/kg. Student’s t-test, n = 5 mice. (E) Representative images of EEG recordings showing local SRS in DG of the hippocampus of Nos1−/− mice 1.5 months after pilocarpine treatment at a dose of 200 mg/kg. Notably, normal EEG waves were detected in the cortex at this time. The same phenomenon was observed in 5 mice. The photo of the electrode trace and the illustration showed that all the electrodes targeted DG from all 5 mice. LC left cortex, RC right cortex, RD right DG, LD left DG, Ref Reference. Error bars correspond to ± s.e.m. **P < 0.01, ***P < 0.001, ****P < 0.0001. Source data are available online for this figure.
Figure 3
Figure 3. Selective deletion of nNOS from hilar interneurons is sufficient to cause epileptogenesis.
(A) The procedures of single-nucleus RNA sequencing and the sorted subclusters of principle cells in DG. (B) The dot plot demonstrated the expression of the discriminative marker genes in the 13 cell populations. (C) nNOS expression in hilar inhibitory interneurons and DGCs of mice with pilocarpine-induced SE in comparison with control. (D) The construction strategy of Nos1loxp/loxp mice. The exons 4–7 were flanked by loxP site using CRISPR-Cas9 technique and were deleted upon the Cre expression. (E) Illustration of the impact of AAV9-pCaMKIIα-GFP-2A-Cre transduction on nNOS expression 2.5 months after injection into the DG of WT or Nos1loxp/loxp mice. (F) Illustration of the effect of AAV9-pGAD67-GFP-2A-Cre transduction on nNOS expression 2.5 months after injection into the DG of WT or Nos1loxp/loxp mice. (G) Heat map and data graph showing cumulative seizure score for 3 h after pilocarpine treatment at a dose of 275 mg/kg in WT and Nos1loxp/loxp mice. The pilocarpine administration was performed 1 month after injection 1 μL of AAV9-pCaMKIIα-GFP-2A-Cre into the hilus. No significant difference was observed. Student’s t-test, n = 5 mice. (H) Heat map and data graph showing cumulative seizure score for 3 h after pilocarpine treatment at a dose of 275 mg/kg in WT and Nos1loxp/loxp mice. The pilocarpine administration was performed 1 month after injection 1 μL of AAV9-pGAD67-GFP-2A-Cre into the hilus. Student’s t-test, n = 4 mice. (I) None epileptic spikes were observed 2.5 months after injection of AAV9-pCaMKIIα-GFP-2A-Cre. Students’ t-test, n = 5 mice. (J) Epileptic SPKs and SRS were detected 2.5 months after injection of AAV9-pGAD67-GFP-2A-Cre. Students’ t-test, n = 4–5 mice. GL granule layer, ML molecular layer, HL hilus, LC left cortex, RC right cortex, RD right DG, LD left DG, Ref Reference. Error bars correspond to ± s.e.m. *P < 0.05, **P < 0.01, NS, not significant. Source data are available online for this figure.
Figure 4
Figure 4. Deficiency of nNOS causes excessive epilepsy-like excitatory inputs onto DGCs.
(A) Representative photos showing the distribution of traced cells projecting to DGCs in the brain of Nos1−/− and WT mice. (i) and (ii) were zoomed photos from white squares, respectively. (B) Representative photos of ‘starter cells’ (yellow color) transduced both with LV-Syn-GTRgp and RbV-Enva-∆Rgp-MCh in the DGCs enlarged from (A). (ii) and (iii) were split channels from (i). (v) and (vi) were split channels from (iv). (C) Data graphs showed connectivity ratios of input neurons located in the cortex, forebrain, brainstem, CA3, and hilus. Students’ t-test, n = 6 mice. (D) Experimental paradigm for tracing the inputs onto DGCs after selective deletion of Nos1 in the interneurons in the hilus. (E) Representative photos of ‘traced cells’ 2.5 months after injection of AAV9-pGAD67-2A-Cre into the DG of WT or Nos1loxp/loxp mice. (F) Data graphs showing the number of input neurons located in the cortex, forebrain, brainstem, CA3, and hilus of mice 2.5 months after selective knockout nNOS in hilar inhibitory neurons. Students’ t-test, n = 6–7 mice. (G) Data graphs showing the brain-wide excitatory inputs onto DGCs after selective knockout Nos1 in the hilar inhibitory neurons. Student’s t-test, n = 6–7 mice. Error bars correspond to ± s.e.m. *P < 0.05, ***P < 0.001, ****P < 0.0001, NS, not significant. Source data are available online for this figure.
Figure 5
Figure 5. Deficiency of nNOS causes hyperexcitability of DGCs.
(A, B) Representative photos showing cFOS+ cells in the DG of WT and Nos1−/− mice. Students’ t-test. Data graph showing cFOS+ cells in GL, HL, CA3, and CA1 of WT and Nos1−/− mice. Students’ t-test, n = 8 mice. (C) The mEPSCs of DGCs were measured in hippocampal slices of WT and Nos1−/− mice. Students’ t-test, n = 12 cells from 3 mice. (D) EPSC PPR was measured in hippocampal slices of WT and Nos1−/− mice. Students’ t-test, n = 15 cells from 3 mice. (E) The mIPSCs of DGCs were measured in hippocampal slices of WT and Nos1−/− mice. Two-way ANOVA, n = 4–6 cells from 3 mice. (F) IPSC PPR was measured in hippocampal slices of WT and Nos1−/− mice. Two-way ANOVA, n = 6–7 cells from 3 mice. (G) Input resistance, membrane potential, and minimal current were measured in hippocampal slices of WT and Nos1−/− mice. Students’ t-test, n = 18 cells from 3 mice. Spike numbers were analyzed by Two-way ANOVA, n = 18 cells from 3 mice. (H) Representative photos and data graph of cFOS+ cells in the DG 2.5 months after injection of AAV9-pGAD67-2A-Cre into the DG of WT or Nos1loxp/loxp mice. GL granule layer, HL hilus. Error bars correspond to ± s.e.m. *P < 0.05, **P < 0.01, NS, not significant. Source data are available online for this figure.
Figure 6
Figure 6. Sufficiency and necessary of replenishing hilar nNOS for blocking the development of epileptogenesis in epilepsy model mice.
(A) Representative immunofluoresence images and data graph showing LV-nNOS-GFP-transduced interneurons in the hilus. Student’s t-test, n = 6 mice. (B) Illustration describing the cell types of LV-nNOS-GFP-transduced cells and data graphs showing the expression of nNOS in the hilus and in the granular layer plus molecular layer regions. Student’s t-test, n = 6 mice. (C) A volume of 1 μL of LV-GFP or LV-nNOS-GFP was injected into the DGs of mice 3 days after pilocarpine-induced seizure. Representative photos and data graphs showing nNOS expression levels and the concentration of NO in DG 2.5 months after virus transduction. One-way ANOVA, n = 6–8 mice. (D) Representative images and data graphs of EEG recordings showing brain waves in mice 2.5 months after pilocarpine-induced SE and virus transduction. One-way ANOVA, n = 6 mice. (E) Timeline showing the experimental design. Pilocarpine administration was applied to induce SE at day 1 and lentivirus was injected into the DGs 3 days later. The Morris water maze test was performed at day 75. (F) Escape latency during 5-day training in MWM test. Seizure experience caused prolonged latency which was reversed by nNOS but not nNOSΔ re-expression in the DG. One-way ANOVA, n = 13–22 mice. (G) Time spent (%) in target quadrant during probe test at day 6 of MWM test. Pilocarpine-induced SE reduced searching time in the target quadrant which was reversed by nNOS but not nNOSΔ re-expression in DG. The moving speed of mice was unchanged. One-way ANOVA, n = 15–23 mice. (H) Example locomotion tracking plots showing the total path length during the probe test at day 6 of the MWM test. (I) Timeline showing the experimental design of Y-maze. (J) The tests analyzing spontaneous alternation and exploring time in a new arm. One-way ANOVA, n = 15 mice. (K) Timeline showing the experimental design of novel object recognition test. (L) Quantitation of discrimination index in novel object recognition memory (ORM) and object location memory (OLM) test. One-way ANOVA, n = 15 mice. (M) Design of transplantation of MGE-derived interneuron progenitor cells transduced with LV- scramble-control-GFP or LV-nNOS-RNAi-GFP into the hilus of mice with pilocarpine administration 1 week before. (N) Data graph of EEG recordings. One-way ANOVA, n = 3–5 mice. GL granule layer, ML molecular layer, HL hilus. Error bars correspond to ± s.e.m. *P < 0.05, **P < 0.01, ***P < 0.001, ****P < 0.0001, NS, not significant. Source data are available online for this figure.
Figure 7
Figure 7. Chronic treatment with NO Donor prevents epileptogenesis.
(AC) Experimental paradigm (A), representative images of input cells (B), and data graph (C), showing chronic treatment with DETA/NONOate (1 mg/kg, i.p., 1 time per day) for 2 months post pilocarpine-induced SE prevented the formation of excessive excitatory afferent circuit. One-way ANOVA, n = 6 mice. (DF) Experimental paradigm (D), representative EEG recordings (E), and data graph (F), showing chronic treatment with DETA/NONOate (1 mg/kg, i.p., 1 time per day) for 2 months post pilocarpine-induced SE prevented the development of SPKs and SRS. Two-way ANOVA, n = 6 mice. (G) Data graphs showing the levels of NO in DG in SE mice with or without long-term treatment with DETA/NONOate. One-way ANOVA, n = 6 mice. (H) A model for mechanisms of TLE: NO deficiency due to hilar nNOS loss causes aberrant excitatory circuit of DGCs, contributing to epileptogenic development, and that NO donor treatment could be a novel strategy and a promising approach to cure TLE. LC left cortex, RC right cortex, RD right DG, LD left DG, Ref Reference. Error bars correspond to ± s.e.m. **P < 0.01, ***P < 0.001, ****P < 0.0001, NS, not significant. Source data are available online for this figure.
Figure EV1
Figure EV1. NO content decreases in TLE mouse models.
(A) Data graph showing the concentration of NO in DG 7 days or 2 months after pilocarpine-induced SE using NO detection kit. Students’ t-test, n = 4 mice. (B) NO measurements using electrochemical methods. One-way ANOVA, n = 5 mice. (C) Representative images showing decreased nitrotyosine-modified proteins in the DG 2 months after pilocarpine administration. The same result was observed in 5 mice. (D) Representative photos of immunofluorescence of nitrotyosine in the DG 7 days after pilocarpine-induced SE. (E) Representative image and data graph showing nNOS expression in DG 14 days after KA-induced SE. Students’ t-test, n = 7–9 mice. (F) Representative image and data graph showing nNOS expression in DG 28 days after PTZ-induced SE. Students’ t-test, n = 4–10 mice. Error bars correspond to ± s.e.m. *P < 0.05, **P < 0.01, ***P < 0.001, ***P < 0.001, ****P < 0.0001.
Figure EV2
Figure EV2. Knockdown of nNOS increases susceptibility of inducing status epilepticus and aggravates epileptogenesis in the pilocarpine mouse model of TLE.
(A) Representative photos and data graphs of nNOS-positive/GFP-positive cells in the hilus 1 month after injection 1 μL of LV-scramble-control-GFP or LV-nNOS-RNAi-GFP into the hilus. Notably, less nNOS+ cells were observed after injection of LV-nNOS-RNAi-GFP. Arrows indicated transduced hilar nNOS-positive interneurons and arrowheads indicated transduced hilar nNOS-negative interneurons. The same observation was repeated in 5 mice. Student’s t-test, n = 8 mice. (B) Western blot showing deceased content of nNOS protein in the DG and in the ML + GL regions 1 month after injection 1 μL of LV-nNOS-RNAi-GFP into the hilus. Student’s t-test, n = 8 mice. (C) Heat map and data graph showing cumulative seizure score for 3 h after pilocarpine treatment at a dose of 275 mg/kg in mice. The mice received injection 1 μL of LV-scramble-control-GFP or LV-nNOS-RNAi-GFP into the hilus 1 month before pilocarpine administration. Student’s t-test, n = 12 mice. (D) Representative images and data graphs of EEG recordings showing brain waves of mice 2.5 months after pilocarpine-induced SE. The mice received injection 1 μL of LV-scramble-control-GFP or LV-nNOS-RNAi-GFP into the hilus 1 month before pilocapine administration. Student’s t-test, n = 3 mice. GL granule layer, ML molecular layer, HL hilus, LC left cortex, RC right cortex, RD right DG, LD left DG, Ref Reference. Error bars correspond to ± s.e.m. *P < 0.05, **P < 0.01, ****P < 0.0001, ****P < 0.0001, NS, not significant.
Figure EV3
Figure EV3. Increased susceptibility to SE induction after deletion of nNOS from hilar interneurons but not from DGCs.
(A) Representative genotyping of Nos1loxp/loxp mice. P1, P2, and P3 showed productions synthesized by three primers, respectively. (B) The distribution of AAV9-pCaMKIIα-GFP-2A-Cre virus or AAV9-pGAD67-GFP-2A-Cre virus transduced neurons along the DG dorsal-ventral axis. The same pattern was observed in all injected mice. (C) Representative photo of AAV9-pCaMKII-GFP-2A-Cre transduction and data graph showing the number of GFP+ cells in the hilus were not altered. Student’s t-test, n = 3 mice. (D) Representative photos and data graph showing nNOS-positive cells in the hilus 1 month after injection of AAV9-pCaMKIIα-GFP-2A-Cre into the hilus of WT or Nos1loxp/loxp mice. No significant difference was observed. Student’s t-test, n = 3 mice. (E) The expression of nNOS protein in the granule layer and molecular layer were reduced after injection of AAV9-pCaMKIIα-GFP-2A-Cre virus into the hilus of Nos1loxp/loxp mice. Student’s t-test, n = 6 mice. (F) Representative photos and data graphs showed that the number of nNOS+ cells in the hilus was reduced and no granule neurons were transduced. Arrowheads indicated transduced hilar nNOS+ neurons. Student’s t-test, n = 3 mice. (G) The expression of nNOS protein in the hilus was reduced after injection of AAV9-pGAD67-GFP-2A-Cre virus into the hilus of Nos1loxp/loxp mice. Student’s t-test, n = 6 mice. GL granule layer, ML molecular layer, HL hilus. Error bars correspond to ± s.e.m. ****P < 0.0001, NS, not significant.
Figure EV4
Figure EV4. Distribution of traced cells projecting to DGCs.
(A) Representative photos showing the distribution of traced cells projecting to DGCs in the brain of WT mice. (B) Representative photos showing the distribution of traced cells projecting to DGCs in the brain of Nos1−/− mice. (i–v) were zoomed photos from white squares, respectively. MS medial septum, DR dorsal raphe, DB diagonal band, VTA ventral tegmental area.
Figure EV5
Figure EV5. Chronic treatment with NO Donor prevents epileptogenesis with long-lasting effect.
(A) Quantification of plasmatic ALT, TBIL, Cr, LDH, and CTn using ELISA kits. Two-way ANOVA, n- = 6 mice. (BD) Experimental paradigm (B), representative EEG recordings (C), and data graphs (D), showing chronic treatment with DETA/NONOate (1 mg/kg, i.p., 1 time per day) for 1 month after pilocarpine-induced SE for 7 days prevented the development of SPKs and SRS. Two-way ANOVA, n = 6 mice. (EG) Experimental paradigm (E), representative EEG recordings (F), and data graphs (G), showing chronic treatment with DETA/NONOate (1 mg/kg, i.p., 1 time per day) for 1 month after pilocarpine-induced SE for 37 days prevented the development of SPKs and SRS. Two-way ANOVA, n = 6 mice. ALT alanine aminotransferase, TBIL total bilirubin, Cr creatinine, LDH lactate dehydrogenase, CTn cardiac troponin. Error bars correspond to ± s.e.m. *P < 0.05, **P < 0.01, ****P < 0.0001, NS, not significant.

Similar articles

References

    1. Acsady L, Katona I, Martinez-Guijarro FJ, Buzsaki G, Freund TF (2000) Unusual target selectivity of perisomatic inhibitory cells in the hilar region of the rat hippocampus. J Neurosci 20:6907–6919 - PMC - PubMed
    1. Bauer JA, Booth BP, Fung HL (1995) Nitric oxide donors: biochemical pharmacology and therapeutics. Adv Pharmacol 34:361–381 - PubMed
    1. Botterill JJ, Lu YL, LaFrancois JJ, Bernstein HL, Alcantara-Gonzalez D, Jain S, Leary P, Scharfman HE (2019) An excitatory and epileptogenic effect of dentate gyrus mossy cells in a mouse model of epilepsy. Cell Rep 29:2875–2889.e2876 - PMC - PubMed
    1. Brodie MJ (2017) Sodium channel blockers in the treatment of epilepsy. CNS Drugs 31:527–534 - PubMed
    1. Calabrese V, Mancuso C, Calvani M, Rizzarelli E, Butterfield DA, Stella AM (2007) Nitric oxide in the central nervous system: neuroprotection versus neurotoxicity. Nat Rev Neurosci 8:766–775 - PubMed

MeSH terms

LinkOut - more resources