. 2025 Jan;17(1):54-84.
doi: 10.1038/s44321-024-00181-4. Epub 2024 Dec 9.

Navigating from cellular phenotypic screen to clinical candidate: selective targeting of the NLRP3 inflammasome

Affiliations

Navigating from cellular phenotypic screen to clinical candidate: selective targeting of the NLRP3 inflammasome

Rosalie Matico et al. EMBO Mol Med. 2025 Jan.

Abstract

The NLRP3 inflammasome plays a pivotal role in host defense and drives inflammation against microbial threats, crystals, and danger-associated molecular patterns (DAMPs). Dysregulation of NLRP3 activity is associated with various human diseases, making it an attractive therapeutic target. Patients with NLRP3 mutations suffer from Cryopyrin-Associated Periodic Syndrome (CAPS) emphasizing the clinical significance of modulating NLRP3. In this study, we present the identification of a novel chemical class exhibiting selective and potent inhibition of the NLRP3 inflammasome. Through a comprehensive structure-activity relationship (SAR) campaign, we optimized the lead molecule, compound A, for in vivo applications. Extensive in vitro and in vivo characterization of compound A confirmed the high selectivity and potency positioning compound A as a promising clinical candidate for diseases associated with aberrant NLRP3 activity. This research contributes to the ongoing efforts in developing targeted therapies for conditions involving NLRP3-mediated inflammation, opening avenues for further preclinical and clinical investigations.

Keywords: Clinical Candidate; IL-1β; Inflammasome; NLRP3; Novel Inhibitor.


Conflict of interest statement

Disclosure and competing interests statement. All authors are (or were) J&J employees when participating in this work and declare no competing interests.

Figures

Figure 1
Figure 1. Identification of a novel chemistry class of NLRP3 inhibitors.
(A) Cell death was determined using J774A.1 cells treated with LPS + Nig (NLRP3) or FlaTox (NLRC4) in the presence of 14 µM test compound and 1 µM Sytox green to identify NLRP3-specific inhibitors. The fourth quadrant was classified as >60% inhibition on NLRP3 and <30% inhibition on NLRC4. Normalized data was used for hit selection. Raw data (n = 3 for each compound) was converted to % inhibition (% INH) in Genedata Screener using the Percent of Control (generic) method. The normalization process included two key parameters: the Central Reference, which was the Neutral Control (DMSO), and the Scale Reference was established as the Inhibitor Control (MCC950). (B) Cell death was determined using LPS-primed J774A.1 cells treated with a dose response of compound B and reference MCC950 followed by treatment with 20 µM Nig (2 h) using 1 µM Sytox green. Plates were read using a PHERAstar FSX (BMG Labtech) using 487 nm wavelength. Dose response was performed in duplicate, or triplicate and data is depicted in the graph as mean +/− SD of two independent repeats (n = 2). (C) Levels of IL-1β were determined by means of AlphaLISA technology using LPS-primed J774A.1 cells treated with a dose response of compound B and reference MCC950 followed by treatment with 20 µM Nig (1 h). Dose response was performed in duplicate, or triplicate and data is depicted in the graph as mean +/− SD of two independent repeats (n = 2). (D) Cell death was determined using J774A.1 cells treated with a dose response of compound B and reference MCC950 followed by treatment with 500 ng/ml FlaTox using 1 µM Sytox green. Plates were read using a PHERAstar FSX (BMG Labtech) using 487 nm wavelength. Dose response was performed in duplicate, or triplicate and data is depicted in the graph as mean +/− SD of two independent repeats (n = 2). (E) The inhibition of IL-1β, IL-6 and TNF by compound B and MCC950 on 100 ng/ml LPS-treated human PBMCs (6 h) was determined using Mesoscale discovery (MSD). PBMCs were used in two independent experiments (n = 2) each in dose response and representative data is depicted in the graph. (F) Structure of representative compounds B, C, and D identified from the screening funnel as selective NLRP3 inhibitor (compound B and C) and inactive homolog (compound D). (G) IC50 for IL-1β, IL-6, and TNF was determined using 100 ng/ml LPS-stimulated PBMCs (from healthy donors) in the presence of compounds C and D. PBMCs were used in two independent experiments (n = 2) each in dose response and pooled data used to calculate the IC50. Source data are available online for this figure.
Figure 2
Figure 2. Cryo-EM confirmed target engagement by direct interaction with human NLRP3 protein.
(A) Different views of Cryo-EM map of NLRP3 complex with compound C. The MBP, NACHT, and LRR were colored in cyan, slate, and gray, respectively. One monomer of NLRP3 tetramer complex was highlighted. (B) Domain architecture of NLRP3. (C) Chemical structure of compound C. (D) The structure NLRP3 complex with compound C was color-coded as Fig. 2B, and depicted in cartoon form, while ADP and compound C were represented as ball-and-stick models. (E) Close views of compound C (top), and MCC950 (bottom) binding sites. NLRP3 was shown as cartoon and followed the color codes as (B). The ligands and the side chains of key residues were shown as sticks. Walker A and B motifs were highlighted. Source data are available online for this figure.
Figure 3
Figure 3. Structure–activity relationship campaign led to the identification of a lead clinical candidate.
(A) Phys-chem characteristics of tricycle hits identified from HTS. (B) In vivo PoC using compound E in the LPS-induced NLRP3 activation model in C57BL/6 mice. Per group, 8 animals are used and mean +/− SEM is depicted for IL-1β measured by ELISA. One-way ANOVA with Dunnett’s multiple comparison test was performed: MCC950 group: ****P < 0.0001, 50 mg/kg group: *P = 0.0154, 12.5 mg/kg group: *P = 0.0491. (C) Phys-chem characterization of different bicycle compounds. (D) Phys-chem characterization of the clinical lead compound. (E) Pharmacokinetic characteristics of the clinical lead compound identified in mice. Testing was performed in vivo with 5 mg/kg PO/1 mg/kg IV. (F) Structural comparison of stimulated(s) compounds C (left) and A (right) with the cryo-EM structure of the NLRP3 complex bound to compound C. Stimulated compounds are shown in yellow, while the compound C from the cryo-EM structure is colored pink. Only three stimulation frames (50, 500, and 1000) are displayed as representatives. Small molecules are depicted as sticks, with NLRP3 shown as a cartoon and color-coded as in EV1A. Key interacting residue side chains are represented as lines with colors indicating their respective subdomains. Abbreviations: Inhibitory concentration 50 (IC50), intrinsic clearance based on microsomal incubations (CLint), cytochrome P450 (CYP450), Madin–Darby canine kidney (MDCK) cells, Topological Polar Surface Area (TPSA), volume of distribution at steady state (Vdss). Source data are available online for this figure.
Figure 4
Figure 4. Full in vitro characterization shows the potent and selective features of compound A.
(A, B) LPS-primed BMDMs from C57BL/6 mice were treated with compound A (10 µM) followed by stimulation with Nig (1 h), ATP (1 h), FlaTox (2 h), TcdA (5 h), or DNA transfection (5 h). Sytox green-positive cells were counted by incucyte (B), and supernatant collected for IL-1β detection (A). BMDMs from three independent animals were used (n = 3) each in triplicate and pooled data shows mean +/− SD. (C) LPS-primed BMDMs from BALB/c mice were treated with compound A or MCC950 (10 µM) followed by stimulation with Nig (1 h) or FlaTox (2 h). Lysates were prepared and ran on western blotting for caspase-1, gasdermin D, IL-1β, and β-actin. BMDMs from three independent animals were used (n = 3) and representative blots are shown from matching animal as (D, E). (D, E) LPS-primed BMDMs from BALB/c mice were treated with compound A (10 µM) followed by stimulation with Nig (1 h), ATP (1 h), LeTx (2 h), or FlaTox (2 h). Sytox green-positive cells were counted by incucyte (E), and supernatant collected for IL-1β detection (D). BMDMs from three independent animals were used (n = 3) each in triplicate and representative data from 1 animal is shown as mean +/− SD to match the WB. (F) Wild-type BMDMs were treated with LPS + Nig (45 min) or FlaTox (75 min) and ASC specks formation was evaluated in the presence of a dose response of compound A by immunofluorescent staining. BMDMs from two independent animals were used (n = 2) each in triplicate and pooled data shows mean +/− SD. (G) LPS-primed BMBMs from C57BL/6 mice were treated with 20 µM Nig in the presence of a dose response of MCC950 or compound A. After 1 h, supernatant was collected and levels of IL-1β were determined using MSD. BMDMs from three independent animals were used (n = 3) each in duplicate and pooled data shows mean +/− SD. (H) LPS-primed splenocytes from C57BL/6 mice were treated with 5 mM ATP in the presence of a dose response of MCC950 or compound A. After 1 h, supernatant was collected and levels of IL-1β were determined using MSD. Splenocytes from three independent animals were used (n = 3) each in quadruplicate and pooled data shows mean +/− SD. (I) Human healthy donor PBMCs were stimulated with 100 ng/ml LPS for 6 h in the presence of a dose response of MCC950 or compound A. Subsequently, supernatant is used to determine the level of IL-1β using MSD technology. PBMCs from three independent healthy donors were used (n = 3) each in quadruplicate and pooled data shows mean +/− SD. (J) Human fresh whole blood was primed with 100 ng/ml LPS for 2 h followed by 5 mM ATP for another 3 h in the presence of compound A. Plasma is collected by centrifugation of the blood for 15 min at 2000 × g and used to determine levels of IL-1β by MSD. Blood from three independent healthy donors was used (n = 3) each in quadruplicate and pooled data shows mean +/− SD. (K) C57BL/6 mice were orally dosed with 50 mg/kg compound A and whole blood was collected at indicated timepoints. Plasma is collected after ex vivo stimulation of the blood with 100 ng/ml LPS (2 h) and 5 mM ATP (3 h) and used to determine the level of IL-1β. Per group, three animals were included and data are shown as mean +/− SD at each timepoint. Source data are available online for this figure.
Figure 5
Figure 5. Full in vivo characterization of compound A shows good potency and improved efficacy toward CAPS disease.
(A) Wild-type or NLRP3 −/− mice were orally dosed with vehicle, MCC950 or compound A (50 mg/kg) for 30 min followed by an intraperitoneal injection of 10 mg/kg LPS. After 4 h, the mice are euthanized, and the blood is collected for IL-1β cytokine determination. Per group, 8 animals are used and mean +/− SEM is depicted. One-way ANOVA with Dunnett’s multiple comparison test was performed: ****P < 0.0001 in all groups. (B) Wild-type mice were orally dosed with vehicle, MCC950 (50 mg/kg) or compound A (50–16.7–5.6 mg/kg) for 30 min followed by an intraperitoneal injection of 10 mg/kg LPS. After 4 h, the mice are euthanized, and the blood is collected for IL-1β cytokine determination. Per group, 8 animals are used and mean +/− SEM is depicted. One-way ANOVA with Dunnett’s multiple comparison test was performed: MCC950 group: ****P < 0.0001, 50 mg/kg group: ****P < 0,0001, 16.7 mg/kg group: **P = 0,0039, 5.6 mg/kg group: ns. (C) % inhibition of IL-1β from (B) calculated by normalization to MCC950. Per group, eight animals are used and mean +/− SEM is depicted. (D) BMDMs from wild-type or A350V + /- MWS mice treated with TAT-cre were stimulated with LPS + Nig in the presence of a dose response of compound A and Sytox green (1 µM) positive cells were determined by Incucyte. BMDMs from three independent animals were used (n = 3) each in duplicate and pooled data shows mean +/− SD. (E) BMDMs from wild-type or A350V + /− MWS mice treated with TAT-cre were stimulated with LPS + Nig in the presence of a dose response of compound A and supernatant was used to determine the level of IL-1β using MSD. BMDMs from three independent animals were used (n = 3) each in duplicate and pooled data shows mean +/− SD. (F) Wild-type or A350V +/− mice were orally treated with tamoxifen for 5 d combined with a daily dose of compound A (100 mg/kg). Bodyweight was determined daily. Per group, four (WT vehicle), seven (Cre + vehicle), or eight (Cre + Cmpd A) animals were used and mean +/− SEM is depicted. (G) Wild-type or A350V +/− mice were orally treated with tamoxifen for 5 d combined with a daily dose of compound A (100 mg/kg). On day 10, animals were euthanized, and plasma was used to determine levels of IL-1β using high-sensitivity Quanterix. Per group 4 (WT vehicle), 7 (Cre + vehicle) or 8 (Cre + Cmpd A) animals were used and mean +/− SEM is depicted. One-way ANOVA with Bonferroni’s multiple comparison test was performed: Cre cmpd A group: **P = 0.0013. (H) Wild-type or A350V +/− mice were orally treated with tamoxifen for 5 d combined with a daily dose of compound A (100 mg/kg). At day 10, animals were euthanized, and plasma was used to determine levels of IL-18 using Luminex. Per group 4 (WT vehicle), 7 (Cre + vehicle) or 8 (Cre + Cmpd A) animals were used and mean +/− SEM is depicted. One-way ANOVA with Bonferroni’s multiple comparison test was performed: Cre cmpd A group: **P = 0.0011. (I) Wild-type or A350V +/− mice were orally treated with tamoxifen for 5 d combined with a daily dose of compound A (100 mg/kg). At day 10, animals were euthanized, and blood was used to determine the number of neutrophils by Sysmex. Per group, four (WT vehicle), seven (Cre + vehicle), or eight (Cre + Cmpd A) animals were used, and mean +/− SEM is depicted. One-way ANOVA with Bonferroni’s multiple comparison test was performed: Cre vehicle group: ***P = 0.0005, Cre cmpd A group: *P = 0.0159. (J) Doxycyclin-inducible A354V THP-1 cells were treated with LPS in the presence of a dose response of MCC950 or compound A. Sytox green-positive cells were determined using Incucyte. Two independent repeats (n = 2) were performed in quadruplicate and pooled data depicted as mean +/− SD. (K) Doxycyclin-inducible A354V THP-1 cells were treated with LPS + Nig in the presence of a dose response of MCC950 or compound A. Sytox green-positive cells were determined using Incucyte. Two independent repeats were performed in quadruplicate and pooled data depicted as mean +/− SD. (L) PBMCs from a patient with confirmed FCAS diagnosis were pretreated with a dose response of MCC950 or compound A followed by exposure to LPS + Nig for 6 h. Supernatant was used to determine the level of IL-1β by MSD. PBMCs were treated in duplicated, and data represented as mean +/− SD. Source data are available online for this figure.
Figure EV1
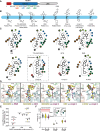
Figure EV1. Structural insights into NLRP3 small-molecule comparison and proposed Compound A binding mode.
(A) Schematic representation of NLRP3 architecture, with domains colored as follows: PYD (red), NBD (orange), HD1 (slate), WHD (light green), HD2 (dark green), and LRR (light gray). (B) NLRP3 small-molecule inhibitors were aligned using the central amine moiety as the reference point. The PDB IDs for each small-molecule-bound NLRP3 structure were shown. (C) Key interacting residues of NLRP3 with the small molecule are highlighted and color-coded as in Fig. EV1A. Note that the residues are grouped by subdomains but may not precisely represent the actual spatial interactions with NLRP3. Interacting residues of NLRP3 with compound A, observed in the simulation (Frame 50), are highlighted with dashed square. (D) Pairwise structural comparison of small-molecule binding to NLRP3. The small molecules are depicted as sticks in pink or yellow, while NLRP3 is shown as a cartoon, color-coded as in Fig. EV1A. Key interacting residue side chains are represented as lines, with colors corresponding to their respective subdomains. (E) The compound-accessible surface area was plotted against the NLRP3 area changes caused by compound binding (in Å2). These areas and their differences were calculated using the AreaMol program from the CCP4 package. Values derived from real complex structures are shown in black spheres, while those from simulations (Frame 50, 500, and 1000) are represented in pink and yellow spheres for compounds C and A, respectively. (F) Violin plot showing distances between Val353 and Glu629, and between compounds A or C and Arg578 (a) or Glu636 (b) from the entire simulation set. Insets display the measured distances between compounds A or C and Arg578 (a) or Glu636 (b). Simulations for Apo, Compound A, and C are colored gray, yellow, and magenta, respectively. Slate and red bars indicate the distances of Val353 and Glu629 from NLRP3’s closed (PDB IDs: 7PZC, 7VTP, 7VTQ, 8SWK, 8SXN, 8ETR, 7ALV, 8WSM, 9DH3, and 8RI2) and open structures (PDB IDs: 8SWF and 8EJ4). MD simulations were conducted three times (n = 3).
Figure EV2
Figure EV2. Characterization of compound E and A.
(A, B) C57BL/6 mice were pretreated with reference compound MCC950 or compound E for 30 min followed by LPS exposure for 4 h. Blood collected and compound concentration determined in plasma. Calculation of free compound levels based on plasma-protein binding. Per group 8 animals were used and mean +/- SEM is depicted. Free plasma levels are calculated based on protein binding. (C, D) LPS or Pam3CSK4-induced NFκB led to the production of IL-6 (C) and TNF (D) which was not impacted by pretreatment with compound A. Representative image from n = 3 shown with 3 technical repeats and mean +/− SD depicted. (E) Cell death induced by 16 h treatment with LPS or Pam3CSK4 in combination with compound A. Representative image from n = 3 shown with 3 technical repeats and mean +/− SD depicted. (F) Wild-type BMDMs either primed with LPS or left untreated for 2 h in presence of Cmpd A (1–10 µM) or MCC950 (10 µM) were stimulated with Nigericin (Nig) or FlaTox for 2 h. DSS-crosslinking of lysates was performed after stimulation and high-order oligomerisation of ASC was detected by immunoblotting. Western blot is representative image of two independent experiments (n = 2). (G) Pam3csk4-primed human PBMCs were treated with reference compound and compound A for 30 min followed by NdlTox stimulation for 3 h. Supernatant is collected and used for cytokine detection on MSD. PBMCs from 3 independent donors (n = 3) were used quadruplicate and all data pooled. Mean +/− SD is depicted. (H) % plasma-protein binding of reference compound and compound A. (I, J) Pharmacodynamic characteristics of compound A determined in CD1 mice.
Figure EV3
Figure EV3. In vivo validation of compound A.
(A, B) Levels of IL-6 and TNF determined in C57BL/6 mice treated with compound followed by LPS injection for 4 h. Per group 8 animals were used and mean +/− SEM is depicted. (C) Compound levels determined in C57BL/6 mice treated with compound followed by LPS injection for 4 h. Per group 8 animals were used and mean +/− SEM is depicted. (D, E) Levels of IL-6 and TNF determined in C57BL/6 mice treated with different doses of compound followed by LPS injection for 4 h. Per group 8 animals were used and mean +/− SEM is depicted. (F, G) Compound levels determined in C57BL/6 mice treated with compound followed by LPS injection for 4 h. Calculation of free compound levels at endpoint. Per group 8 animals were used and mean +/− SEM is depicted. (H) Toxicology profile of compound A after a preclinical short 14 d tox study in mice. Per group, 4 animals are used.
Figure EV4
Figure EV4. Impact of CAPS mutations on the efficacy of compound A.
(A, B) Wild-type or conditional MWS BMDMs were treated with a dose response of MCC950 and effect on cell death (A) and IL-1β release (B) was determined. BMDMs from 3 independent animals (n = 3) were used in duplicate and pooled data depicted as mean +/− SD. (C, D) Undifferentiated THP-1 cells were treated with doxycycline to allow expression of A354V mutant NLRP3 whereafter cells were treated with reference compound or compound A in dose response followed by treatment with LPS (A) or LPS + Nig (B). Supernatant was collected and IL-18 detected using Luminex. Two independent repeats (n = 2) were performed in quadruplicate and pooled data depicted as mean +/− SD. (E) PBMCs from a patient with NOMID mutation were treated with reference compound or compound A followed by LPS + Nig. Supernatant was collected and IL-1β measured by MSD. PBMCs were treated in duplicate, and data represented as mean +/− SD. (F) Comparison of MCC950 and compound C binding to human NLRP3. Small molecules are shown as pink (compound C) and yellow (MCC950) sticks, while NLRP3 is depicted as a color-coded cartoon, as in Fig. EV1A. Side chains of Arg351 and Pro352 are displayed as lines, and mutations from CAPS (Ala354Val), FCAS (Leu355Pro), and NOMID (Asp305Asn) patients are represented as sticks, colored according to their respective subdomains. Yellow dashed lines indicate potential interactions between residues and MCC950.
Figure EV5
Figure EV5. In vivo validation of compound A using the MWS mouse model.
(AD) Tamoxifen-induced MWS-mediated disease was measured using G-CSF (A), IP-10 (B), IL-6 (C) and SAA (D) in plasma after collection of the blood on day 10. Per group 4 (WT vehicle), 7 (Cre + vehicle) or 8 (Cre + cmpd A) animals were used and mean +/− SEM is depicted. Unpaired two-tailed t-test with welch’s correction in Cre treated vs vehicle samples was performed: **P = 0.0058 (G-CSF), *P = 0.0317 (IP-10), *P = 0.0145 (IL-6), *P = 0.0145 (SAA). (E, F) Levels of compound in plasma in blood collected at day 10, 24 h after last oral dosing. Eight animals were used in this group and mean +/− SEM is depicted. Free compound was calculated (F). (G) Photomicrograph (H&E) of liver sections from a control wildtype (A), vehicle-treated NLRP3 heterozygous (B) and compound A-treated NLRP3 heterozygous (c) mouse. Note the hepatocellular necrosis (yellow arrow), portal vein thrombosis (black arrow), and inflammatory cells infiltration in the sinusoids and portal triads (arrowheads) of the vehicle-treated liver. In contrast, compound A-treated liver appeared histologically comparable to wild-type liver and exhibited only minimal inflammatory cells infiltration (arrowheads) and significant reduction in the severity of thrombosis and necrosis. Bar= 100 microns. (H) Photomicrograph (H&E) of lung sections from a control wildtype (A), vehicle-treated NLRP3 heterozygous (B) and compound A-treated NLRP3 heterozygous (c) mouse. Compound A-treated lung appeared histologically comparable to wild-type liver and exhibited reduction in the severity of thrombosis (arrows) when compared to vehicle-treated NLRP3 heterozygous. Bar = 100 microns.

References

    1. Afonine PV, Poon BK, Read RJ, Sobolev OV, Terwilliger TC, Urzhumtsev A, Adams PD (2018) Real-space refinement in PHENIX for cryo-EM and crystallography. Acta Crystallogr Sect Struct Biol 74:531–544 - PMC - PubMed
    1. Bauernfeind FG, Horvath G, Stutz A, Alnemri ES, MacDonald K, Speert D, Fernandes-Alnemri T, Wu J, Monks BG, Fitzgerald KA et al (2009) Cutting edge: NF-kappaB activating pattern recognition and cytokine receptors license NLRP3 inflammasome activation by regulating NLRP3 expression. J Immunol 183:787–791 - PMC - PubMed
    1. Boyden ED, Dietrich WF (2006) Nalp1b controls mouse macrophage susceptibility to anthrax lethal toxin. Nat Genet 38:240–244 - PubMed
    1. Broz P, von Moltke J, Jones JW, Vance RE, Monack DM (2010) Differential requirement for Caspase-1 autoproteolysis in pathogen-induced cell death and cytokine processing. Cell Host Microbe 8:471–483 - PMC - PubMed
    1. Charan HV, Dwivedi DK, Khan S, Jena G (2023) Mechanisms of NLRP3 inflammasome-mediated hepatic stellate cell activation: therapeutic potential for liver fibrosis. Genes Dis 10:480–494 - PMC - PubMed

MeSH terms

Substances

LinkOut - more resources