. 2024 Dec;4(12):899-909.
doi: 10.1038/s43588-024-00737-x. Epub 2024 Dec 9.

Structure-based drug design with equivariant diffusion models

Affiliations

Structure-based drug design with equivariant diffusion models

Arne Schneuing et al. Nat Comput Sci. 2024 Dec.

Abstract

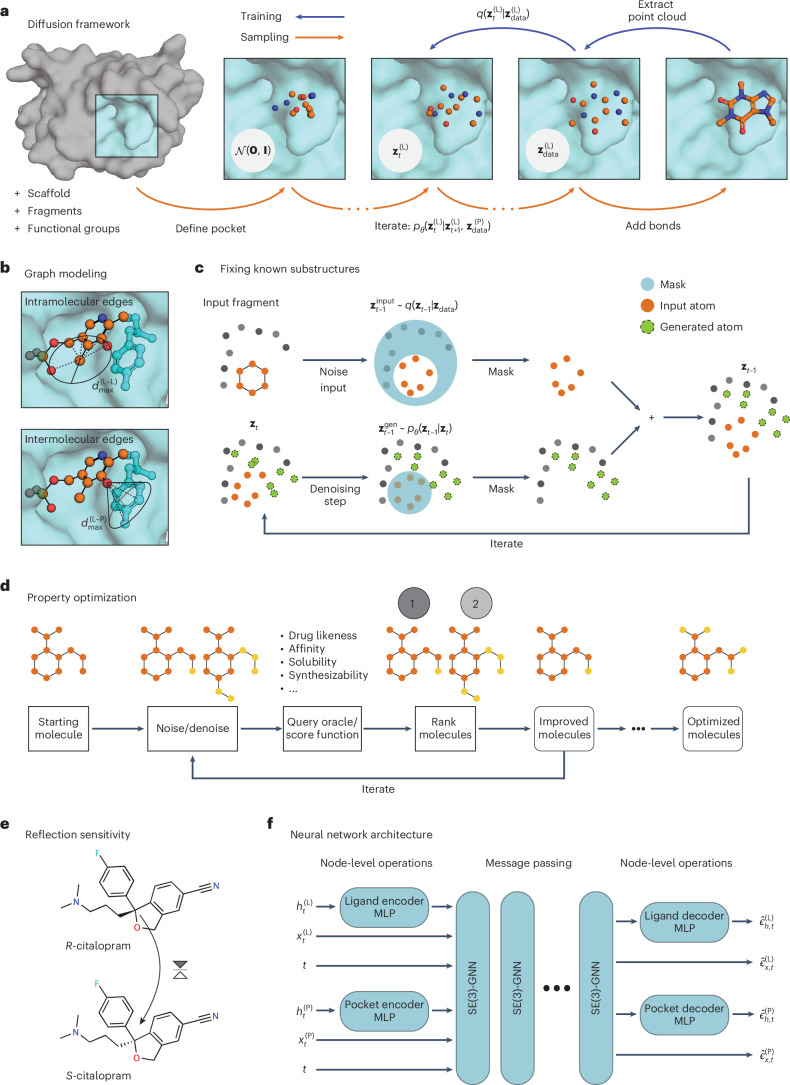
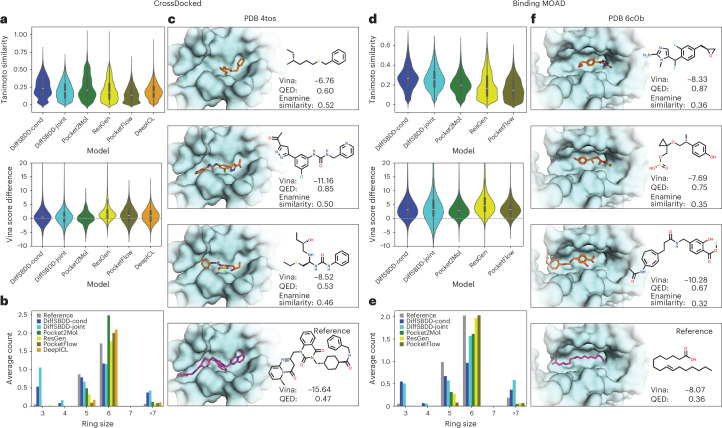
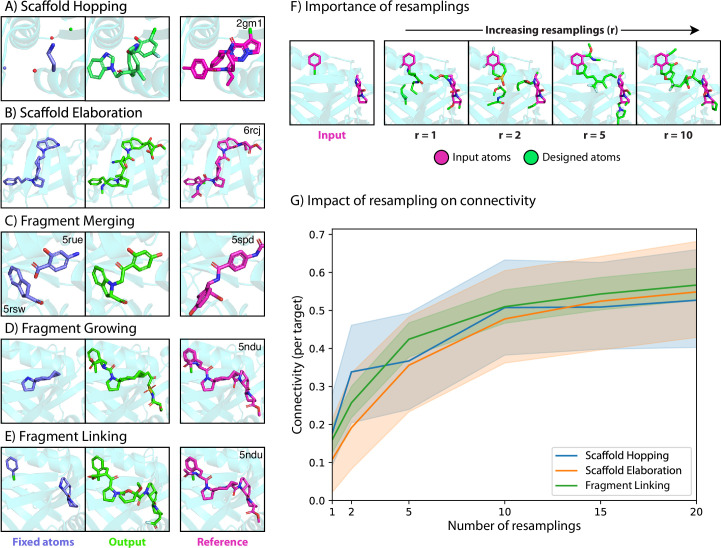
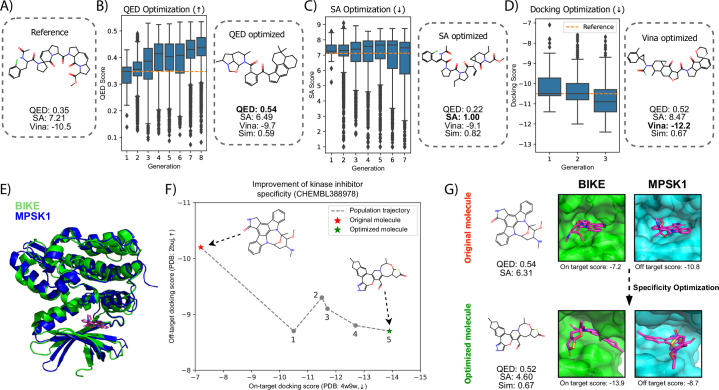
Structure-based drug design (SBDD) aims to design small-molecule ligands that bind with high affinity and specificity to pre-determined protein targets. Generative SBDD methods leverage structural data of drugs with their protein targets to propose new drug candidates. However, most existing methods focus exclusively on bottom-up de novo design of compounds or tackle other drug development challenges with task-specific models. The latter requires curation of suitable datasets, careful engineering of the models and retraining from scratch for each task. Here we show how a single pretrained diffusion model can be applied to a broader range of problems, such as off-the-shelf property optimization, explicit negative design and partial molecular design with inpainting. We formulate SBDD as a three-dimensional conditional generation problem and present DiffSBDD, an SE(3)-equivariant diffusion model that generates novel ligands conditioned on protein pockets. Furthermore, we show how additional constraints can be used to improve the generated drug candidates according to a variety of computational metrics.


Conflict of interest statement

Competing interests: The authors declare no competing interests.

Figures

Fig. 1
Fig. 1. Method overview.
a, The diffusion process q yields a noised version zt(L) of the original atomic point cloud zdata(L) for a time step t ≤ T. The neural network model is trained to approximate the reverse process conditioned on the target protein structure zdata(P). Once trained, an initial noisy point cloud is sampled from a Gaussian distribution zT(L)~N0,I and progressively denoised using the learned transition probability pθ. Covalent bonds are added to the resultant point cloud at the end of the generation. Optionally, fixed substructures (for instance, fragments) can be provided to condition the generative process. Carbon, oxygen and nitrogen atoms are shown in orange, red and blue, respectively. b, Each state is processed as a graph where edges are introduced according to edge type-specific distance thresholds, for instance, dmaxLL and dmaxLP. c, To generate new chemical matter conditioned on molecular substructures, we apply the learned denoising process to the entire molecule (superscript ‘gen’), but at every step we replace the prediction for the static substructure with the ground-truth noised version computed with q (superscript ‘input’). The protein context (gray) remains unchanged in every step. d, To tune molecular features, we find variations of a starting molecule by applying small amounts of noise and running an appropriate number of denoising steps. The new set of molecules is ranked by an oracle and the procedure is repeated for the best-scoring candidates. e, DiffSBDD is sensitive to reflections and can thus distinguish molecules with different stereochemistry. f, The neural network backbone is composed of MLPs that map scalar features h of ligand and pockets nodes into a joint embedding space, and SE(3)-equivariant message passing layers that operate on these features, each node’s coordinates x and a time step embedding t. It outputs the predicted noise values ϵ^ for every vertex.
Fig. 2
Fig. 2. Evaluation of distribution learning capabilities and generated examples.
All targets are taken from the CrossDocked and Binding MOAD test sets. a, Comparison of generated molecules with the reference molecule from the same pocket. We compare the Tanimoto similarity of the molecular fingerprints and compute the difference Vinagen − Vinaref between their Vina docking scores. n = 7,800, 7,800, 7,642, 8,932, 7,800 and 7,733, from left to right. b, Average number of rings of different sizes per generated molecule. c, Example molecules generated by DiffSBDD-cond for a pocket from the CrossDocked test set. We compared all generated molecules with the approximately 4.2 million compounds from the Enamine Screening Collection, and selected the three closest hits with drug-likeness QED > 0.5. Vina docking score, QED drug-likeness score and fingerprint similarity to the most similar Enamine molecules are reported in each case. df, The same analyses as in ac but for target pockets from the Binding MOAD test set. n = 11,623, 11,581, 15,718, 13,072 and 11,900, from left to right. Carbon atoms are shown in orange or magenta. Oxygen, nitrogen, sulfur, chlorine and fluorine are shown in red, dark blue, yellow, green and light blue, respectively. All box plots within violins include the median line, a box denoting the interquartile range (IQR) and whiskers showing data within ±1.5 × IQR. Source data
Extended Data Fig. 1
Extended Data Fig. 1. Molecular inpainting results.
Design examples for scaffold hopping (A), scaffold elaboration (B), fragment merging (C), fragment growing (D) and fragment linking (E). The inputs to our model (the fixed atoms) are shown in blue, the outputs (designed molecules) are shown in green and the original molecules are shown in magenta for reference. PDB codes are shown for the ground truth structure. In the case of fragment merging, we compose fragments with two different crystal structures with PDB codes shown. (F) Importance of resampling for generating realistic and connected molecules. The designed region (green) finally harmonizes with the molecular context at high resamplings. (G) Effect of the number of resampling steps on molecular connectivity. Carbon atoms are shown in light blue, green, or magenta depending on atom character. Oxygen, nitrogen, sulfur and chlorine are shown in red, dark blue, yellow, and light green, respectively. Means and 95% confidence intervals are plotted for 3 design tasks. For this experiment we used 20 randomly selected targets from the test set. Source data
Extended Data Fig. 2
Extended Data Fig. 2. Results on molecular optimization using DiffSBDD.
(A-D) Experiments on single property molecular optimization. (A) Starting inhibitor from PDB code 5ndu. (B) QED optimization over 8 generations. (C) SA optimization over 7 generations. (D) docking score optimization over 3 generations. We found that optimization over subsequent generations continuously optimized the docking score, but that was at expense of molecular quality. (E-G) Kinase inhibitor specificity optimization experiment. (E) Cartoon representation showing the high degree of structural similarity between our two kinases of interest (BIKE and MPSK1). (F) Trajectory plot showing the highest scoring molecule at each iteration during kinase inhibitor optimization. (G) Visual representation of the molecular graphs and bound conformations of the native and final molecules with corresponding Vina docking scores. Boxes in panels (B-D) represent the upper and lower quartile as well as the median of the data. Whiskers denote 1.5 times the interquartile range. Outliers outside this range are shown as flier points. Sample sizes for each generation are 80, 4474, 4390, 4460, 4459, 4470, 4472, 4474 for panel B, 84, 4500, 4500, 4500, 4500, 4500, 4500 for panel C and 118, 432, 437 for panel D. Carbon, oxygen, nitrogen and sulfur are shown in magenta, red, dark blue and yellow, respectively. QED: Quantitative Estimation of Drug-likeness; SA: Synthetic Accessibility; Sim.: Tanimoto molecular fingerprint similarity to the reference. Source data

References

    1. Anderson, A. C. The process of structure-based drug design. Chem. Biol.10, 787–797 (2003). - PubMed
    1. Lyne, P. D. Structure-based virtual screening: an overview. Drug Discov. Today7, 1047–1055 (2002). - PubMed
    1. Shoichet, B. K. Virtual screening of chemical libraries. Nature432, 862–865 (2004). - PMC - PubMed
    1. Irwin, J. J. & Shoichet, B. K. ZINC—a free database of commercially available compounds for virtual screening. J. Chem. Inf. Model.45, 177–182 (2005). - PMC - PubMed
    1. Ferreira, L. G., Dos Santos, R. N., Oliva, G. & Andricopulo, A. D. Molecular docking and structure-based drug design strategies. Molecules20, 13384–13421 (2015). - PMC - PubMed

LinkOut - more resources