. 2025 Jan;44(2):534-562.
doi: 10.1038/s44318-024-00334-8. Epub 2024 Dec 9.

SNARE mimicry by the CD225 domain of IFITM3 enables regulation of homotypic late endosome fusion

Affiliations

SNARE mimicry by the CD225 domain of IFITM3 enables regulation of homotypic late endosome fusion

Kazi Rahman et al. EMBO J. 2025 Jan.

Abstract

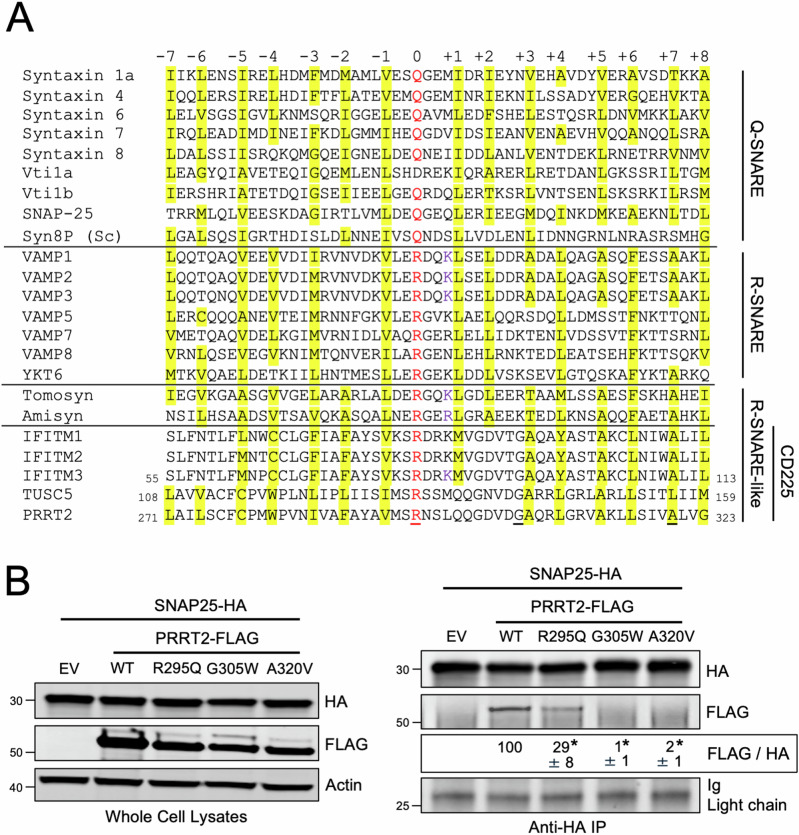
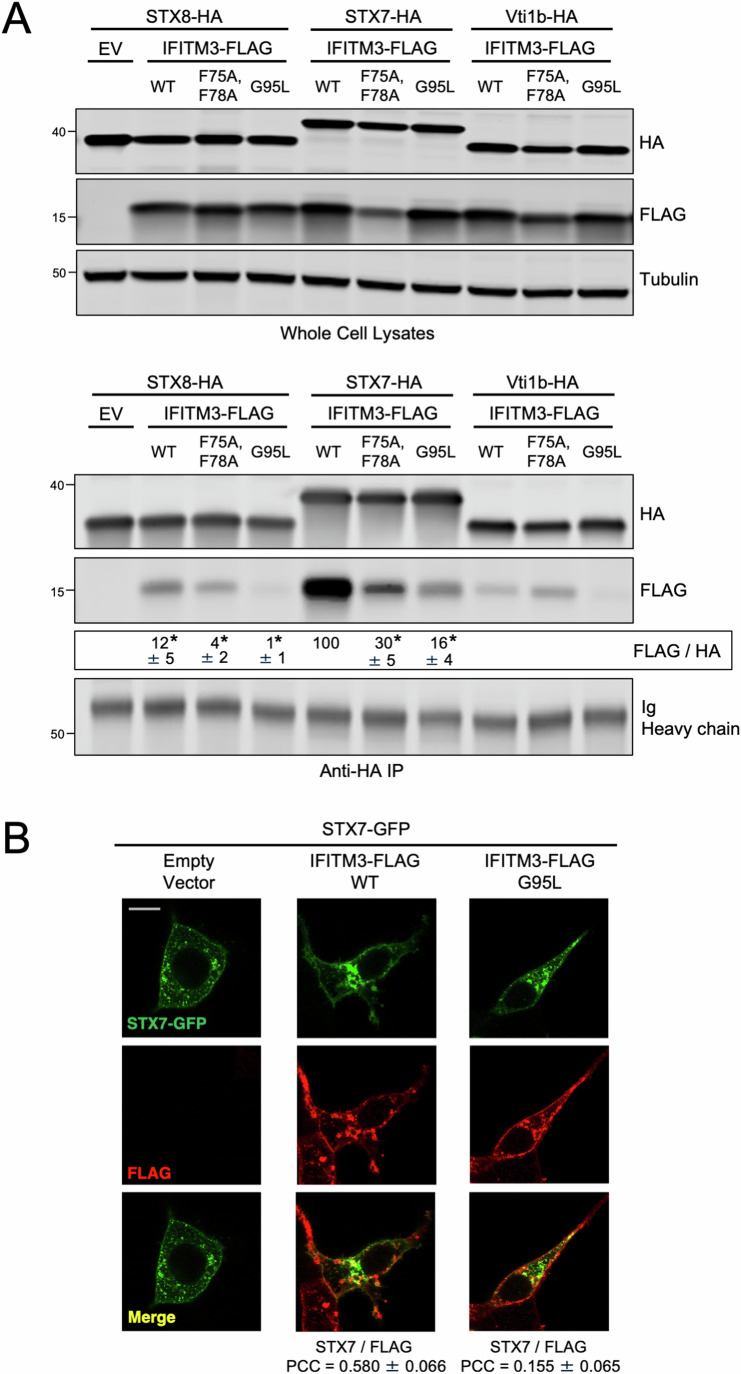
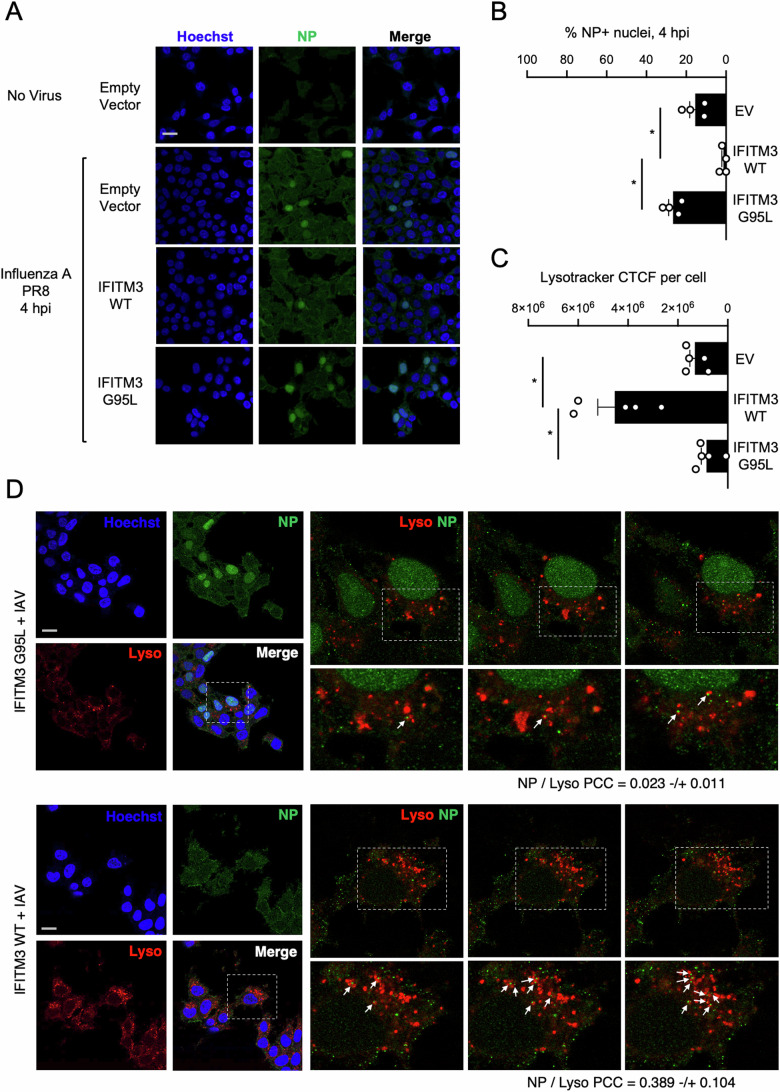
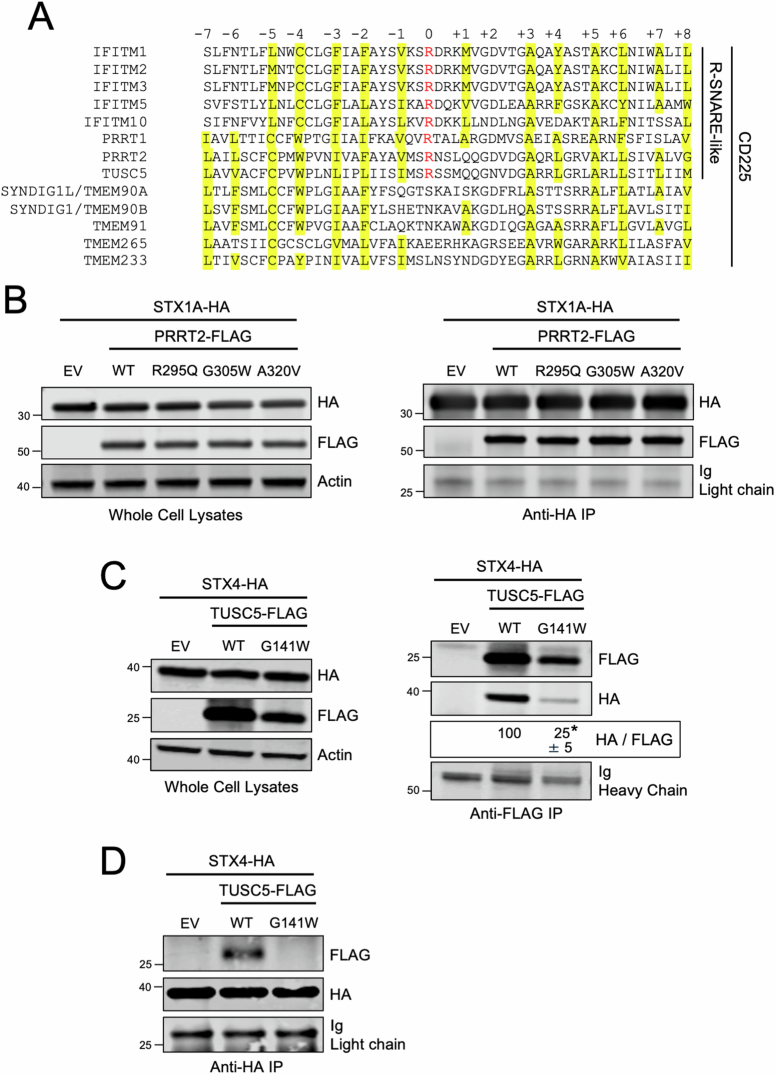
The CD225/Dispanin superfamily contains membrane proteins that regulate vesicular transport and membrane fusion events required for neurotransmission, glucose transport, and antiviral immunity. However, how the CD225 domain controls membrane trafficking has remained unknown. Here we show that the CD225 domain contains a SNARE-like motif that enables interaction with cellular SNARE fusogens. Proline-rich transmembrane protein 2 (PRRT2) encodes a SNARE-like motif that enables interaction with neuronal SNARE proteins; mutations in this region disrupt SNARE binding and are linked to neurological disease. Another CD225 member, interferon-induced transmembrane protein 3 (IFITM3), protects cells against influenza A virus infection. IFITM3 interacts with SNARE proteins that mediate late endosome-late endosome (homotypic) fusion and late endosome-lysosome (heterotypic) fusion. IFITM3 binds to syntaxin 7 (STX7) in cells and in vitro, and mutations that abrogate STX7 binding cause loss of antiviral activity against influenza A virus. Mechanistically, IFITM3 disrupts assembly of the SNARE complex controlling homotypic fusion and accelerates the trafficking of endosomal cargo to lysosomes. Our results suggest that SNARE modulation plays a previously unrecognized role in the diverse functions performed by CD225 proteins.

Keywords: CD225; IFITM; Membrane Fusion; PRRT2; Virus.


Conflict of interest statement

Disclosure and competing interests statement. The authors declare no competing interests.

Figures

Figure 1
Figure 1. CD225 proteins contain a motif resembling an R-SNARE motif.
(A) A selection of SNARE proteins from yeast and mammals were aligned with proteins with SNARE-like motifs, and a 53-residue stretch of sequence is shown. Proteins are grouped by Q-SNARE, R-SNARE, or R-SNARE-like, and CD225 proteins are labeled as a subset of the R-SNARE-like proteins. Residues in red text are the central polar arginine or glutamine residues characteristic of canonical SNARE proteins and are labeled as the central “0” layer. Surrounding heptad repeats of hydrophobic residues are labeled from “−7” to “+8” in relation to the “0” layer, and sites highlighted in yellow correspond to hydrophobic residues. Underlined residues are those found in PRRT2, which when mutated, are associated with neurological dysfunction. (B) Left: HEK293T cells were co-transfected with SNAP25-HA and either PRRT2-FLAG (WT, R295Q, G305W, or A320V) or Empty Vector. SDS-PAGE and immunoblotting were performed with anti-HA and anti-FLAG in whole cell lysates. Anti-actin was used as loading control. Right: From co-transfected cells, SNAP25-HA was immunoprecipitated with anti-HA followed by SDS-PAGE and immunoblotting with anti-HA and anti-FLAG. Immunoglobulin light chain was used as loading control. Numbers and tick marks left of blots indicate position and size (in kilodaltons) of protein standard in ladder. The FLAG/HA ratio was calculated for the indicated lanes and shown as mean and standard error (normalized relative to WT, which was set to 100%). Differences that were statistically significant from WT as determined by one-way ANOVA are indicated by (*). Exact p values are as follows (from left to right): p < 0.0001, p < 0.0001, p < 0.0001. Immunoblots were performed independently three times (biological replicates), and a representative example is shown. Sc Saccharomyces cerevisiae. Ig immunoglobulin, IP immunoprecipitation, EV empty vector, WT wild-type. Source data are available online for this figure.
Figure 2
Figure 2. IFITM3 contains an R-SNARE-like motif and interacts with ectopic endosomal Q-SNARE STX7.
(A) Human endosomal SNARE proteins were aligned with human IFITM proteins, and a 53-residue stretch of sequence is shown. Residues in red text are the central polar arginine or glutamine residues characteristic of canonical SNARE proteins and are labeled as the central “0” layer. Surrounding heptad repeats of hydrophobic residues are labeled from “−7” to “+8” in relation to the “0” layer, and sites highlighted in yellow correspond to hydrophobic residues. Black underlined residues in IFITM3 were mutated for functional experiments. Green underlined residues in IFITM3 correspond to the previously described amphipathic alpha helix. (B) HEK293T cells were transfected with IFITM3-FLAG (WT, F75/78A, R85Q, or G95L) and, 48 h later, challenged with IAV (A/PR/8/34 (PR8), H1N1) at a multiplicity of infection of 0.10. 18 h post-infection, cells were fixed, permeabilized, immunostained with anti-FLAG and anti-NP, and analyzed by flow cytometry. The percentage of NP+ cells was measured as a fraction of FLAG+ cells and shown as mean and standard error (normalized relative to Empty Vector, which was set to 100%). Infections were performed independently three times (biological replicates). Differences that were statistically significant from WT as determined by one-way ANOVA are indicated by (*). Exact p values are as follows (from left to right): p < 0.0001, p < 0.0001, p < 0.0001. (C) Structural prediction of the R-SNARE-like motif of IFITM3 was performed with Alphafold and FATCAT. Residues 55–113 of IFITM3 were modeled against a template of the R-SNARE motif of VAMP8 which was previously crystallized as part of the STX7-STX8-Vti1b-VAMP8 trans-SNARE complex (PDB: 1GL2). (D) Left: HEK293T cells were co-transfected with IFITM3-FLAG or Empty Vector and a construct encoding a single SNARE protein: STX7-HA, STX8-HA, Vti1b-HA, VAMP8-HA, or VAMP7-myc. SDS-PAGE and immunoblotting were performed with anti-HA, anti-myc, and anti-FLAG in whole cell lysates. Anti-actin was used as loading control. Right: From co-transfected cells, IFITM3-FLAG was immunoprecipitated with anti-FLAG followed by SDS-PAGE and immunoblotting with anti-HA, anti-myc, and anti-FLAG. Heavy chain immunoglobulin chain was used as loading control. Co-transfection of Empty Vector and STX7-HA was used as a negative control for immunoprecipitation. (E) Left: HEK293T cells were co-transfected with STX7-HA and either IFITM3-FLAG (WT, F75/78A, or R85Q) or Empty Vector. SDS-PAGE and immunoblotting were performed with anti-HA and anti-FLAG in whole cell lysates. Anti-actin was used as loading control. Right: From co-transfected cells, IFITM3-FLAG was immunoprecipitated with anti-FLAG followed by SDS-PAGE and immunoblotting with anti-FLAG and anti-HA. Light chain immunoglobulin was used as loading control. Co-transfection of Empty Vector and STX7-HA was used as a negative control for immunoprecipitation. The HA/FLAG ratio was calculated for the indicated lanes and shown as mean and standard error (normalized relative to WT, which was set to 100%). Differences that were statistically significant from WT as determined by one-way ANOVA are indicated by (*). Exact p values are as follows (from left to right): p < 0.0001, p < 0.0001. Numbers and tick marks left of blots indicate position and size (in kilodaltons) of protein standard in ladder. Immunoblots were performed independently three times, and a representative example is shown. IAV Influenza A virus, Ig immunoglobulin, IP immunoprecipitation, EV Empty Vector, WT wild-type. Source data are available online for this figure.
Figure 3
Figure 3. IFITM3 interacts with endosomal Q-SNAREs in a G95-dependent manner.
(A) Top: HEK293T cells were co-transfected with STX8-HA, STX7-HA, or Vti1b-HA and either Empty Vector or IFITM3-FLAG (WT, F75/78A, or G95L). SDS-PAGE and immunoblotting were performed with anti-HA and anti-FLAG in whole cell lysates. Anti-tubulin was used as loading control. Bottom: from co-transfected cells, STX8-HA, STX7-HA, or Vti1b-HA were immunoprecipitated with anti-HA followed by SDS-PAGE and immunoblotting with anti-HA and anti-FLAG. Heavy chain immunoglobulin was used as loading control. Co-transfection of Empty Vector and STX8-HA was used as a negative control for immunoprecipitation. The FLAG/HA ratio was calculated for the indicated lanes and shown as mean and standard error (normalized relative to WT with STX7-HA, which was set to 100%). Differences that were statistically significant from WT with STX7-HA as determined by one-way ANOVA are indicated by (*). Exact p values are as follows (from left to right): p < 0.0001, p < 0.0001, p < 0.0001, p < 0.0001, p < 0.0001. Numbers and tick marks left of blots indicate position and size (in kilodaltons) of protein standard in ladder. Immunoblots were performed independently three times, and a representative example is shown. (B) HEK293T cells stably expressing Empty Vector, IFITM3 WT-FLAG, or IFITM3 G95L-FLAG were transfected with STX7-GFP, fixed, immunostained with anti-FLAG, and analyzed by confocal immunofluorescence microscopy. Colocalization was measured between FLAG and STX7-GFP by calculating the Pearson’s correlation coefficient using Fiji software. Coefficients were calculated from medial Z-slices from three fields of view containing 5–15 cells per condition and presented as means and standard error. Scale bar = 15 microns. Ig immunoglobulin, IP immunoprecipitation, EV Empty Vector, WT wild-type, PCC Pearson’s correlation coefficient. Source data are available online for this figure.
Figure 4
Figure 4. Endogenous IFITM3 interacts with endosomal Q-SNAREs and R-SNAREs via an R-SNARE-like motif.
(A) Left: HeLa cells (WT or IFITM3 KO) were transfected with STX7-HA. SDS-PAGE and immunoblotting were performed with anti-HA and anti-IFITM3 in whole cell lysates. Anti-actin was used as loading control. Right: STX7-HA was immunoprecipitated with anti-HA antibody followed by SDS-PAGE and immunoblotting with anti-HA and anti-IFITM3. Heavy chain immunoglobulin was used as loading control. An isotype matched antibody was used as a control for immunoprecipitation. (B) Endogenous STX8 was immunoprecipitated from HeLa (WT or IFITM3 KO) with anti-STX8 followed by SDS-PAGE and immunoblotting with anti-STX8 and anti-IFITM3. Heavy chain immunoglobulin was used as loading control. An isotype matched antibody was used as a control for immunoprecipitation. The (#) symbol denotes the presence of light chain immunoglobulin. (C) Endogenous Vti1b was immunoprecipitated from HeLa (WT or IFITM3 KO) with anti-Vti1b followed by SDS-PAGE and immunoblotting with anti-Vti1b and anti-IFITM3. Light chain immunoglobulin was used as loading control. (D) Endogenous VAMP8 was immunoprecipitated from HeLa (WT or IFITM3 KO) with anti-VAMP8 followed by SDS-PAGE and immunoblotting with anti-VAMP8 and anti-IFITM3. Light chain immunoglobulin was used as loading control. (E) Endogenous VAMP7 was immunoprecipitated from HeLa (WT or IFITM3 KO) with anti-VAMP7 followed by SDS-PAGE and immunoblotting with anti-VAMP7 and anti-IFITM3. Two forms of VAMP7 were detected following immunoprecipitation: one form of ~25 kD and another of ~15 kD (Wojnacki et al, 2021). Light chain immunoglobulin was used as loading control. (F) Left: Recombinant STX7 and recombinant IFITM3 (WT, F75/78A, or G95L) were mixed together in vitro and reaction inputs were visualized by SDS-PAGE and immunoblotting with anti-STX7 and anti-IFITM3. Right: recombinant STX7 was immunoprecipitated with anti-STX7 followed by SDS-PAGE and immunoblotting with anti-STX7 and anti-IFITM3. Heavy chain immunoglobulin was used as loading control. Numbers and tick marks left of blots indicate position and size (in kilodaltons) of protein standard in ladder. Immunoblots were performed independently two times and a representative example is shown. Ig immunoglobulin, IP immunoprecipitation, KO knockout, WT wild-type, r recombinant. Source data are available online for this figure.
Figure 5
Figure 5. IFITM3 inhibits the interaction between STX7/8 and VAMP8.
(A) HEK293T cells stably expressing Empty Vector, IFITM3 WT-FLAG, or IFITM3 G95L-FLAG were co-transfected with STX7-HA and VAMP8-Myc. Whole cell lysates were subjected to SDS-PAGE and immunoblotting with anti-HA, anti-FLAG, and anti-Myc. Actin was used as a loading control. Right: STX7-HA was immunoprecipitated with anti-HA followed by SDS-PAGE and immunoblotting with anti-HA, anti-FLAG, and anti-Myc. The Myc/HA ratio was calculated for the indicated lanes and shown as mean and standard error (normalized relative to Empty Vector, which was set to 100%). Differences that were statistically significant from Empty Vector as determined by one-way ANOVA are indicated by (*). Exact p values are as follows (from left to right): p = 0.0016, p = 0.4318. (B) HEK293T cells stably expressing Empty Vector, IFITM3 WT-FLAG, or IFITM3 G95L-FLAG were transfected with STX7-GFP and VAMP8-mCherry, fixed, and analyzed by confocal immunofluorescence microscopy. Colocalization was measured between STX7-GFP and VAMP8-mCherry by calculating the Pearson’s correlation coefficient using Fiji software. Coefficients were calculated from medial Z-slices from three fields of view containing 5–15 cells per condition and presented as means and standard error. Scale bar = 15 microns. (C) HEK293T cells stably expressing Empty Vector, IFITM3 WT-FLAG, or IFITM3 G95L-FLAG were inoculated with IAV (+) or medium (−) for 18 h and subjected to whole cell lysis. Endogenous STX8 was immunoprecipitated with anti-STX8 followed by SDS-PAGE and immunoblotting with anti-STX8, anti-FLAG, anti-VAMP8, and anti-VAMP7. The VAMP8/STX8 and VAMP7/STX8 ratios were calculated for the indicated lanes and shown as mean and standard error (normalized relative to No Virus Empty Vector, which was set to 100%). Differences that were statistically significant from No Virus Empty Vector as determined by one-way ANOVA are indicated by (*). Exact p values are as follows (from left to right, top to bottom): p = 0.0007, p = 0.6986, p = 0.0093, p = 0.4523, p < 0.0001, p = 0.7960. (D) Endogenous STX8 was immunoprecipitated from HeLa cells (WT or IFITM3 KO) with anti-STX8 followed by SDS-PAGE and immunoblotting with anti-STX8, anti-IFITM3, and anti-VAMP8. Light chain immunoglobulin was used as loading control. An isotype matched antibody was used as a control for immunoprecipitation. The VAMP8/STX8 ratio was calculated for the indicated lanes and shown as mean and standard error (normalized relative to WT, which was set to 100%). Differences that were statistically significant from WT as determined by student’s T test are indicated by (*). Exact p value: p = 0.0009. Numbers and tick marks left of blots indicate position and size (in kilodaltons) of protein standard in ladder. The (#) symbol denotes the presence of light chain immunoglobulin. Immunoblots were performed independently three times, and a representative example is shown. Ig immunoglobulin, IP immunoprecipitation, EV Empty Vector, WT wild-type, PCC Pearson’s correlation coefficient. Source data are available online for this figure.
Figure 6
Figure 6. IFITM3 inhibits assembly of homotypic late endosome fusion machinery and promotes the delivery of endosomal cargo to lysosomes.
(A) HEK293T stably expressing Empty Vector, IFITM3 WT-FLAG, or IFITM3 G95L-FLAG were co-transfected with STX7-HA, STX8-HA, Vti1b-HA, and VAMP8-Myc. Following whole cell lysis, samples were either boiled at 100 °C (+) or not (−). SDS-PAGE and immunoblotting was performed with anti-Myc and anti-FLAG. Actin was used as loading control. Numbers and tick marks left of blots indicate position and size (in kilodaltons) of protein standard in ladder. Immunoblots were performed independently twice, and a representative example is shown. (B) HEK293T cells stably expressing Empty Vector, IFITM3 WT-FLAG, or IFITM3 G95L-FLAG were pulsed with Dextran Alexa Fluor 488 for 2 h followed by addition of Magic Red for 5 min. Living cells were then analyzed immediately by confocal immunofluorescence microscopy. Colocalization between Dextran and Magic Red was measured by calculating the Pearson’s correlation coefficient using Fiji software. Coefficients were calculated from medial Z-slices from three fields of view containing 5–15 cells per condition and presented as means and standard error. Scale bar = 15 microns. PCC Pearson’s correlation coefficient. Source data are available online for this figure.
Figure 7
Figure 7. IFITM3 traffics incoming IAV to lysosomes in a G95-dependent manner.
(A) HEK293T cells stably expressing Empty Vector, IFITM3 WT-FLAG, or IFITM3 G95L-FLAG inoculated with IAV at a multiplicity of infection of 1 and incubated on ice for 40 min. Cells were washed, fresh medium containing Lysotracker Deep Red (50 nM) was added, and cells were placed at 37 °C. Four hours later, cells were fixed and immunostained with anti-NP antibody and Hoechst and analyzed by confocal immunofluorescence microscopy. Mock-inoculated (PBS) Empty Vector cells were used as a negative control. Scale bar = 15 microns. Medial Z-slices representative of each condition are shown. (B) The percentage of NP+ nuclei was quantified in Empty Vector, IFITM3 WT-FLAG, or IFITM3 G95L-FLAG cells. Symbols represent fields of view containing ~15–30 total cells and mean percentage plus standard error is shown. Differences that were statistically significant between the indicated conditions as determined by one-way ANOVA are indicated by (*). Exact p values are as follows (from left to right): p < 0.0001, p = 0.0028. (C) The corrected total cell fluorescence (CTCF) intensity of Lysotracker staining was quantified in Empty Vector, IFITM3 WT-FLAG, or IFITM3 G95L-FLAG cells. Symbols represent fields of view containing ~15–30 total cells and mean CTCF intensity plus standard error is shown. Differences that were statistically significant between the indicated conditions as determined by one-way ANOVA are indicated by (*). Exact p values are as follows (from left to right): p = 0.0005, p = 0.0001. (D) Examination of NP signal in relation to Lysotracker staining in HEK293T stably expressing IFITM3 WT-FLAG or IFITM3 G95L-FLAG. White boxes indicate fields of view selected for detailed analysis. Right: detailed view of three different Z slices from confocal stack. White arrows indicate bright NP puncta that colocalize with Lysotracker or which tightly appose a Lysotracker+ compartment. Colocalization between NP and Lysotracker was measured by calculating the Pearson’s correlation coefficient using Fiji software. Coefficients were calculated from medial Z-slices from three fields of view containing 5–15 cells per condition and presented as means plus standard error. Scale bar = 15 microns. EV Empty Vector, WT wild-type, hpi hours post-inoculation, CTCF corrected total cell fluorescence, PCC Pearson’s correlation coefficient. Source data are available online for this figure.
Figure 8
Figure 8. A model of inhibition of homotypic late endosome fusion by IFITM3.
IFITM3 selectively regulates the trans-SNARE assembly driving late endosome-late endosome fusion (STX7-STX8-Vti1b-VAMP8), while enabling late endosome-lysosome fusion. As a result, endocytic cargos (including viruses) are more efficiently trafficked to lysosomes in IFITM3-expressing cells. LE late endosome, Lys lysosome.
Figure EV1
Figure EV1. An R-SNARE-like motif is semi-conserved among human CD225 family members.
(A) Human CD225 proteins were aligned and trimmed to a 53-residue stretch of sequence covering the SNARE motif. Proteins are grouped by whether they contain an arginine at the central “0” layer (R-SNARE-like) or not. Surrounding heptad repeats of hydrophobic residues are labeled from “−7” to “+8” in relation to the “0” layer, and sites highlighted in yellow correspond to hydrophobic residues. (B) Left: HEK293T cells were co-transfected with STX1A-HA and either PRRT2-FLAG (WT, R295Q, G305W, or A320V) or Empty Vector. SDS-PAGE and immunoblotting were performed with anti-HA and anti-FLAG in whole cell lysates. Anti-actin was used as loading control. Right: From co-transfected cells, STX1A-HA was immunoprecipitated with anti-HA followed by SDS-PAGE and immunoblotting with anti-HA and anti-FLAG. Immunoglobulin chain was used as loading control. (C) Left: HEK293T cells were co-transfected with STX4-HA and either TUSC5-FLAG (WT or G141W) or Empty Vector. SDS-PAGE and immunoblotting were performed with anti-HA and anti-FLAG in whole cell lysates. Anti-actin was used as loading control. Right: From co-transfected cells, TUSC5-FLAG was immunoprecipitated with anti-FLAG followed by SDS-PAGE and immunoblotting with anti-HA and anti-FLAG. Light chain immunoglobulin chain was used as loading control. The HA/FLAG ratio was calculated for the indicated lanes and shown as mean and standard error (normalized relative to WT, which was set to 100%). Differences that were statistically significant from WT as determined by student’s T test are indicated by (*). Exact p value: p < 0.0001. (D) From co-transfected cells, STX4-HA was immunoprecipitated with anti-HA followed by SDS-PAGE and immunoblotting with anti-FLAG and anti-HA. Light chain immunoglobulin was used as loading control. Numbers and tick marks left of blots indicate position and size (in kilodaltons) of protein standard in ladder. Immunoblots were performed independently three times, and a representative example is shown (except for (D), which was performed twice). Ig immunoglobulin, IP immunoprecipitation, EV Empty Vector, WT wild-type. Source data are available online for this figure.
Figure EV2
Figure EV2. IFITM3 contains a motif resembling the alpha helical R-SNARE motif of VAMP8.
(A) The R-SNARE-like motif of IFITM3 and the R-SNARE motif of VAMP8 (53 residues each) were compared by predictive protein structure alignment and comparison algorithm TM-align. A TM score of 0.75847 was recorded, indicating that the two regions are likely to adopt the same alpha helical protein fold. (B) Structural prediction of the R-SNARE-like motif of IFITM3 was performed with Alphafold and FATCAT. Residues 55–113 of IFITM3 were modeled against a template of the R-SNARE motif of VAMP8 which was previously crystallized as part of the STX7-STX8-Vti1b-VAMP8 trans-SNARE complex (PDB: 1GL2). VAMP8 was then swapped with the predicted structure of IFITM3 and shown in relation to the coiled-coiled structure formed with STX7, STX8, and Vti1b. Top: the side chains of residues F75, F78, and R85 of IFITM3 are depicted in yellow and labeled. Bottom: alternative view of the side chains of F75, F78, and R85 of IFITM3. (C) Top: examination of the central polar “0” layer of the Q-SNAREs STX7, STX8, Vti1b in relation to the R85 residue in the predicted configuration of IFITM3. Bottom: examination of the central polar “0” layer of the STX7-STX8-Vti1b-VAMP8 complex (PDB: IGL2). Source data are available online for this figure.
Figure EV3
Figure EV3. IFITM3 interacts with the R-SNAREs VAMP8 and VAMP7.
(A) Left: HEK293T cells were co-transfected with VAMP8-HA and IFITM3-FLAG (WT or G95L). SDS-PAGE and immunoblotting were performed with anti-HA and anti-FLAG in whole cell lysates. Anti-actin was used as loading control. Right: From co-transfected cells, VAMP8-HA was immunoprecipitated with anti-HA followed by SDS-PAGE and immunoblotting with anti-HA and anti-FLAG. Light chain immunoglobulin chain was used as loading control. The FLAG/HA ratio was calculated for the indicated lanes and shown as mean and standard error (normalized relative to WT, which was set to 100%). Differences that were statistically significant from WT as determined by student’s T test are indicated by (*). Exact p value: p < 0.0001. (B) Left: HEK293T cells were co-transfected with VAMP7-myc and IFITM3-FLAG (WT or G95L). SDS-PAGE and immunoblotting were performed with anti-myc and anti-FLAG in whole cell lysates. Anti-actin was used as loading control. Right: From co-transfected cells, VAMP7-myc was immunoprecipitated with anti-myc followed by SDS-PAGE and immunoblotting with anti-myc and anti-FLAG. Light chain immunoglobulin chain was used as loading control. The FLAG/Myc ratio was calculated for the indicated lanes and shown as mean and standard error (normalized relative to WT, which was set to 100%). Differences that were statistically significant from WT as determined by student’s T test are indicated by (*). Exact p value: p = 0.0023. Numbers and tick marks left of blots indicate position and size (in kilodaltons) of protein standard in ladder. Immunoblots were performed independently three times, and a representative example is shown. Ig immunoglobulin, IP immunoprecipitation, WT wild-type. Source data are available online for this figure.
Figure EV4
Figure EV4. IFITM3 does not impair the STX7/STX8 or STX7/Vti1b interactions.
(A) HeLa cells (WT or IFITM3 KO) were subjected to whole cell lysis, SDS-PAGE, and immunoblotting with anti-IFITM2/3, anti-STX8, anti-Vti1b, anti-VAMP8, anti-VAMP7, and anti-actin. Red and green arrows indicate IFITM3 and IFITM2, respectively, recognized by the anti-IFITM2/3 antibody. (B) STX7-HA was transfected into HeLa (WT or IFITM3 KO) and immunoprecipitated with anti-HA followed by SDS-PAGE and immunoblotting with anti-HA, anti-IFITM3, anti-STX8, and anti-Vti1b. Heavy chain immunoglobulin was used as loading control. An isotype matched antibody was used as a control for immunoprecipitation. The (#) symbol denotes the presence of light chain immunoglobulin. (C) Purified recombinant IFITM3 protein (WT, F75/78A, or G95L) of varying inputs (6, 12, or 18 µg) were subjected to SDS-PAGE and visualized by Coomassie stain. (D) 20 ng of purified recombinant IFITM3 protein (WT, F75/78A, or G95L) were subjected to SDS-PAGE and immunoblotting with anti-IFITM3. (E) Recombinant STX7 of varying inputs (0.5, 1, or 2 µg) were subjected to SDS-PAGE and visualized by Coomassie stain. (F) Recombinant STX7 was subjected to SDS-PAGE and immunoblotting with anti-STX7. Numbers and tick marks left of blots indicate position and size (in kilodaltons) of protein standard in ladder. Immunoblots were performed independently two times and a representative example is shown (for (A) and (B)) or once (for (C), (D), (E), and (F)). Ig immunoglobulin, IP immunoprecipitation, EV Empty Vector, WT wild-type, r recombinant. Source data are available online for this figure.
Figure EV5
Figure EV5. IFITM3 does not impair the STX7/VAMP7 interaction.
(A) Size exclusion chromatography was performed on recombinant IFITM3 proteins (WT, F75/78A, and G95L) and eluted fractions were analyzed by SDS-PAGE and Coomassie staining. 150 µg recombinant protein was loaded as input and fraction numbers correspond to mL volumes eluted from column. (B) Left: HEK293T cells stably expressing Empty Vector, IFITM3 WT-FLAG, or IFITM3 G95L-FLAG were co-transfected with STX7-HA and VAMP7-Myc. Whole cell lysates were subjected to SDS-PAGE and immunoblotting with anti-HA, anti-FLAG, and anti-Myc. Actin was used as a loading control. Right: STX7-HA was immunoprecipitated with anti-HA followed by SDS-PAGE and immunoblotting with anti-HA, anti-FLAG, and anti-Myc. The Myc/HA ratio was calculated for the indicated lanes and shown as mean and standard error (normalized relative to Empty Vector, which was set to 100%). Differences that were statistically significant from Empty Vector as determined by one-way ANOVA are indicated by (*). Exact p values are as follows (from left to right): p = 0.0099, p = 0.8782. Numbers and tick marks left of blots indicate position and size (in kilodaltons) of protein standard in ladder. Immunoblots were performed independently three times, and a representative example is shown (except (A), which was performed once). (C) HeLa (WT or IFITM3 KO) were transfected with STX7-GFP and VAMP8-mCherry and confocal immunofluorescence microscopy was performed. Colocalization between STX7-GFP and VAMP8-mCherry was measured by calculating the Pearson’s correlation coefficient using Fiji software. Coefficients were calculated from medial Z-slices from three fields of view containing 5–15 cells per condition and presented as means and standard error. Scale bar = 15 microns. IP immunoprecipitation, WT wild-type, r recombinant. Source data are available online for this figure.

References

    1. Advani RJ, Yang B, Prekeris R, Lee KC, Klumperman J, Scheller RH (1999) VAMP-7 mediates vesicular transport from endosomes to lysosomes. J Cell Biol 146:765–776 - PMC - PubMed
    1. Antonin W, Fasshauer D, Becker S, Jahn R, Schneider TR (2002) Crystal structure of the endosomal SNARE complex reveals common structural principles of all SNAREs. Nat Struct Biol 9:107–111 - PubMed
    1. Bailey CC, Huang IC, Kam C, Farzan M (2012) Ifitm3 limits the severity of acute influenza in mice. PLoS Pathog 8:e1002909 - PMC - PubMed
    1. Beaton N, Rudigier C, Moest H, Müller S, Mrosek N, Röder E, Rudofsky G, Rülicke T, Ukropec J, Ukropcova B et al (2015) TUSC5 regulates insulin-mediated adipose tissue glucose uptake by modulation of GLUT4 recycling. MOLMET 4:795–810 - PMC - PubMed
    1. Becker F, Schubert J, Striano P, Anttonen AK, Liukkonen E, Gaily E, Gerloff C, Muller S, Heussinger N, Kellinghaus C et al (2013) PRRT2-related disorders: further PKD and ICCA cases and review of the literature. J Neurol 260:1234–1244 - PubMed

LinkOut - more resources