. 2024 Nov-Dec;22(6):e70007.
doi: 10.1111/gbi.70007.

The Impact of Early Diagenesis on Biosignature Preservation in Sulfate Evaporites: Insights From Messinian (Late Miocene) Gypsum

Affiliations

The Impact of Early Diagenesis on Biosignature Preservation in Sulfate Evaporites: Insights From Messinian (Late Miocene) Gypsum

Luca Pellegrino et al. Geobiology. 2024 Nov-Dec.

Abstract

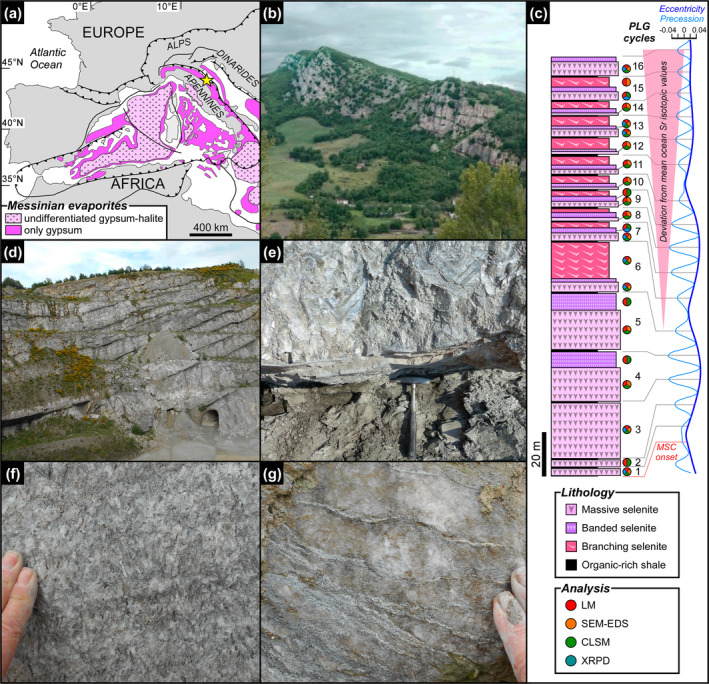
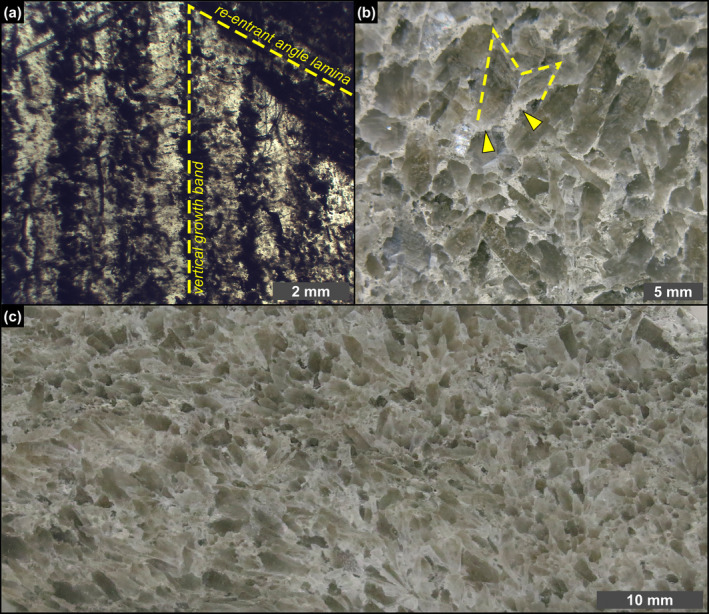
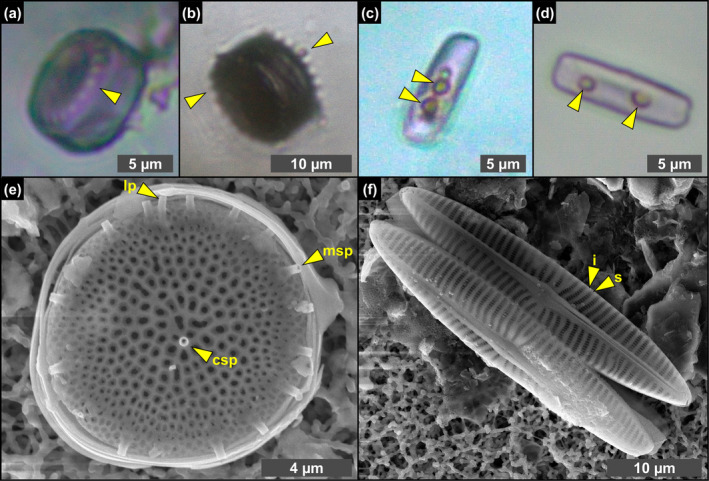
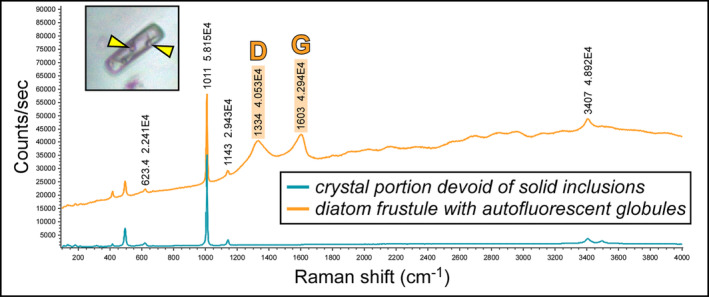
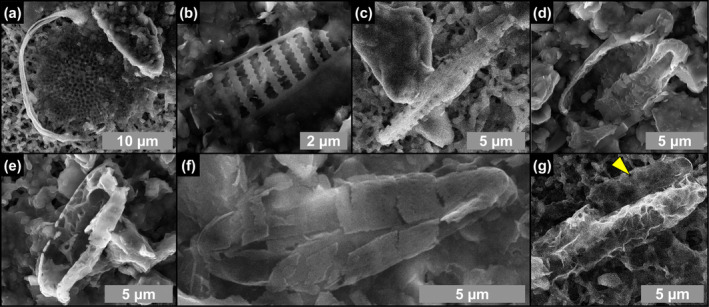
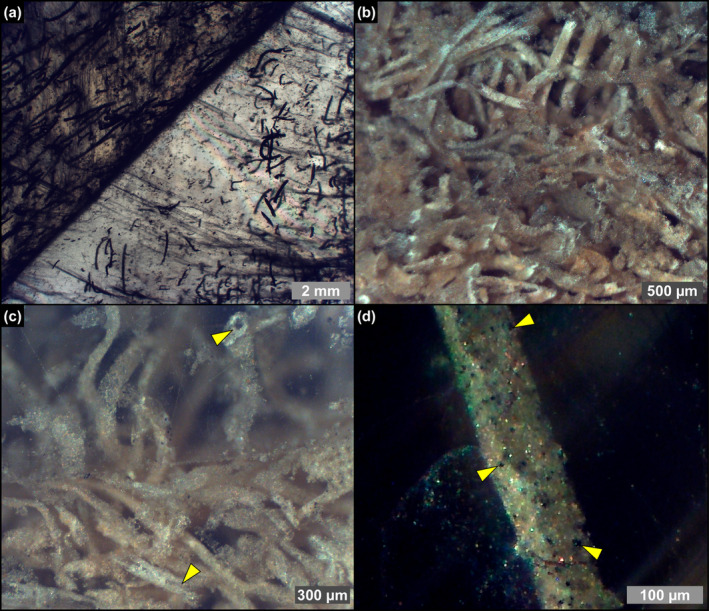
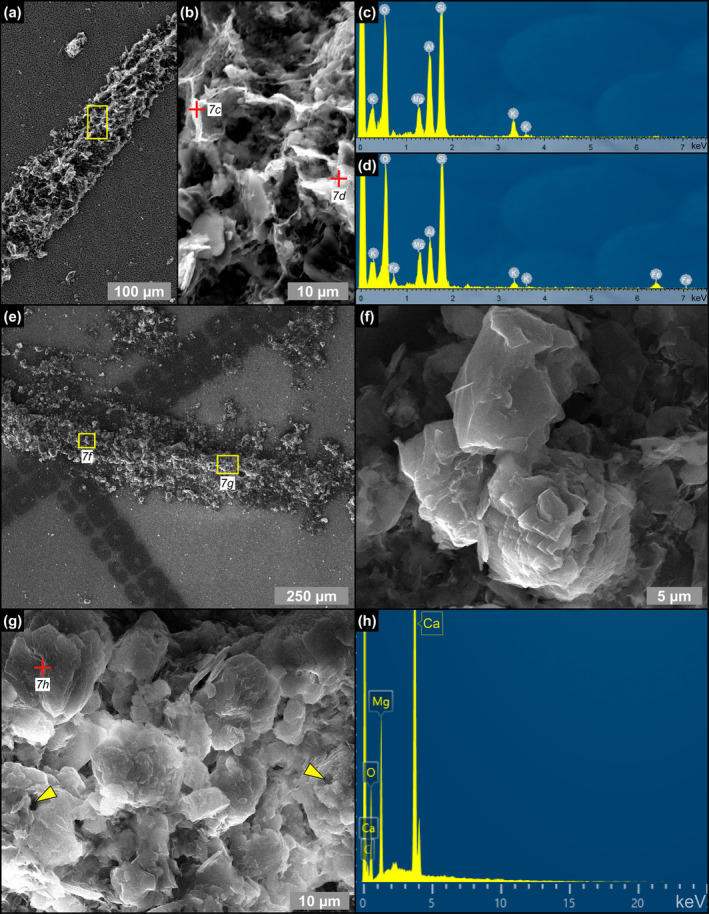
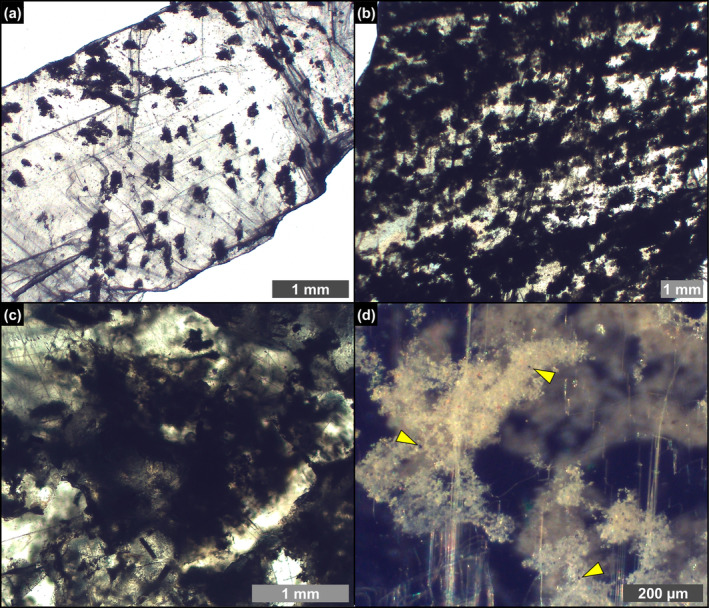
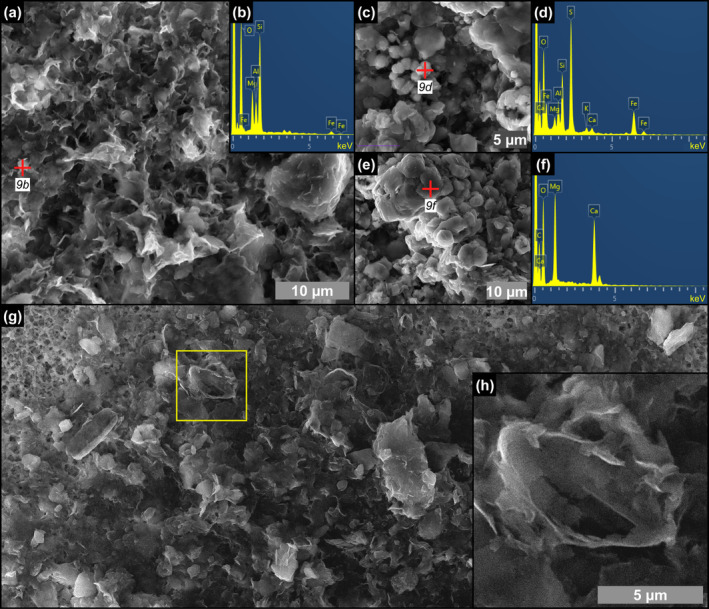
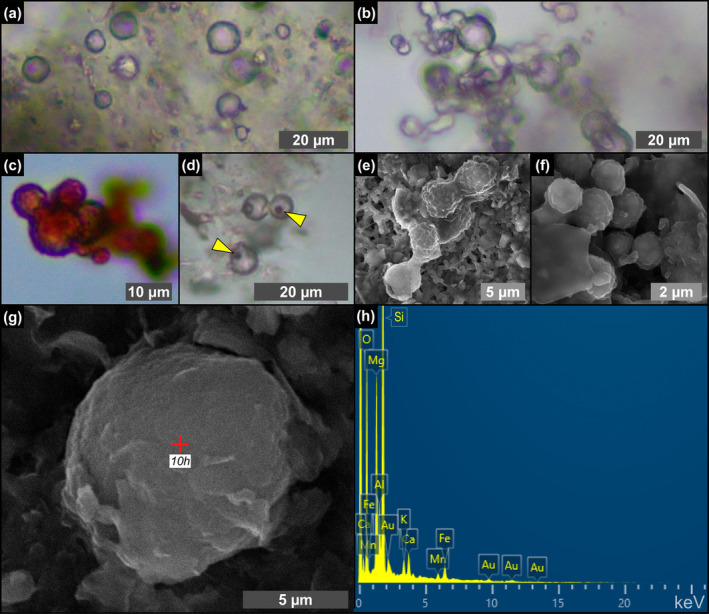
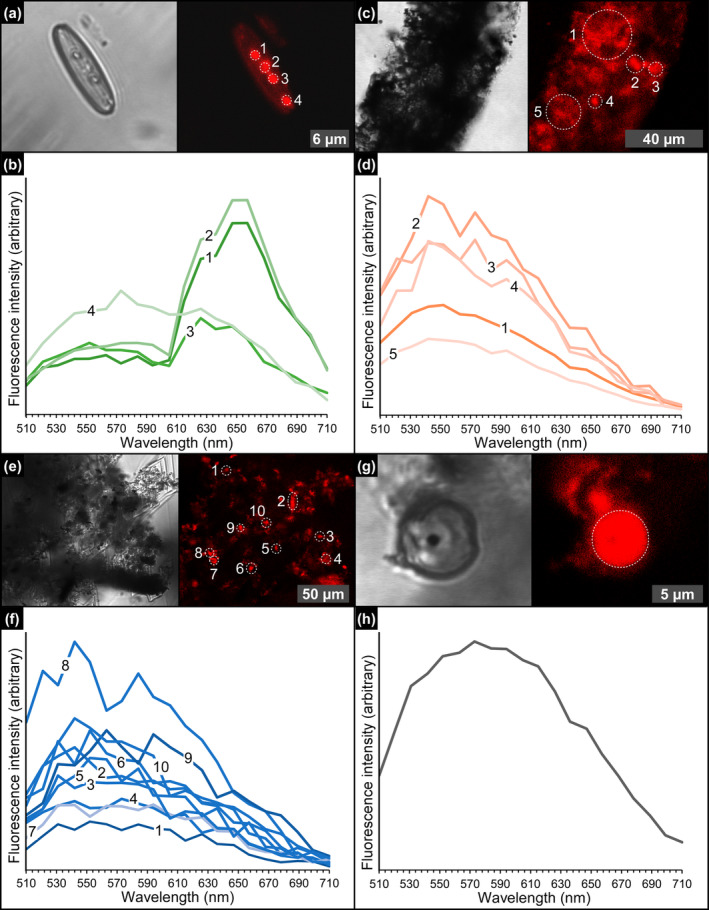
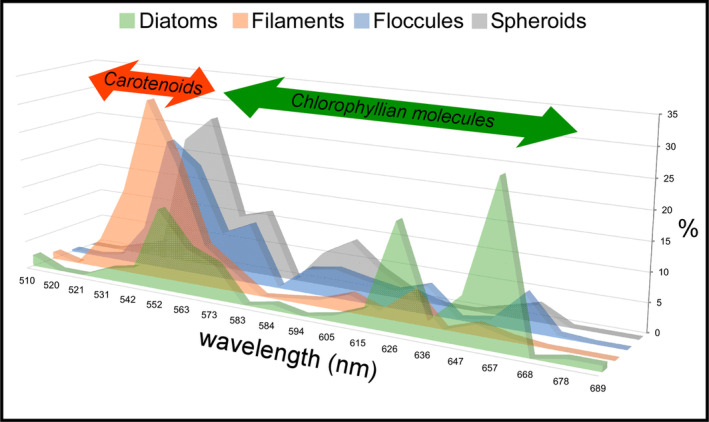
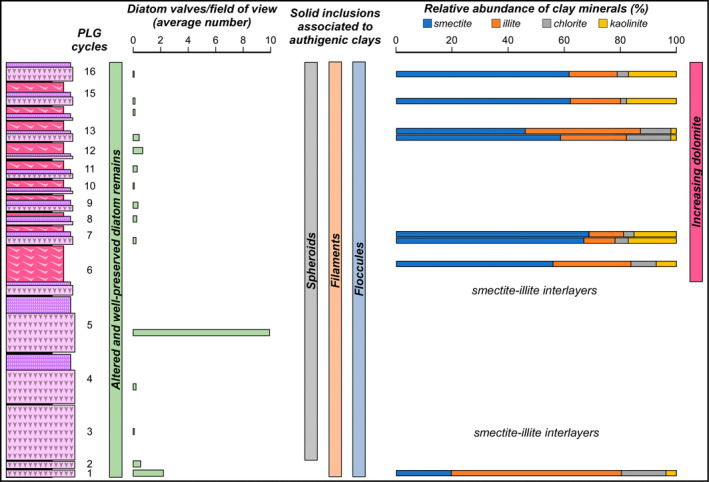
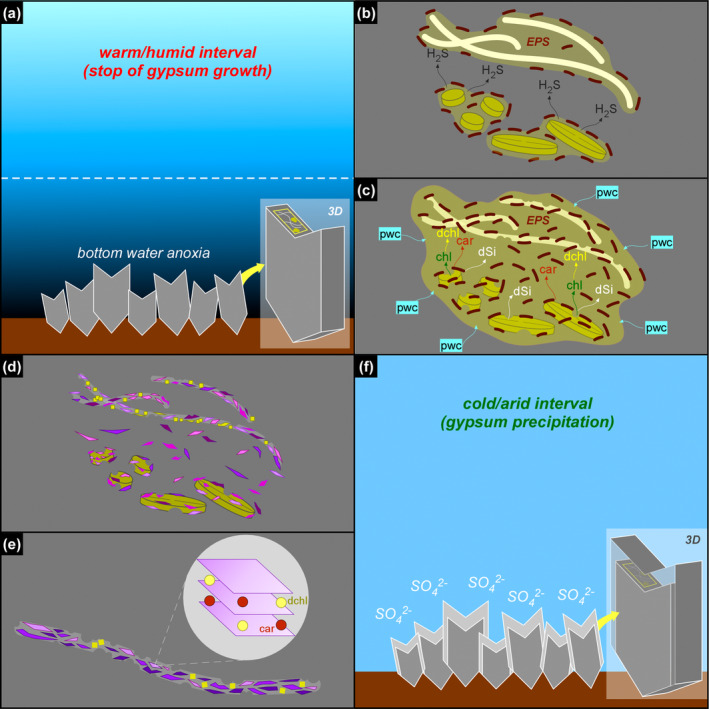
Due to their fast precipitation rate, sulfate evaporites represent excellent repositories of past life on Earth and potentially on other solid planets. Nevertheless, the preservation potential of biogenic remains can be compromised by extremely fast early diagenetic processes. The upper Miocene, gypsum-bearing sedimentary successions of the Mediterranean region, that formed ca. 6 million years ago during the Messinian salinity crisis, represent an excellent case study for investigating these diagenetic processes at the expense of organic matter and associated biominerals. Several gypsum crystals from the Northern Mediterranean were studied by means of destructive and non-destructive techniques in order to characterize their solid inclusion content and preservation state. In the same crystal, excellently preserved microfossils coexist with strongly altered biogenic remains. Altered remains are associated with authigenic minerals, especially clays. The results demonstrate that a significant fraction of organic matter and associated biominerals (notably biogenic silica) underwent early diagenetic modification. The latter was likely triggered by bottom sulfidic conditions when the growth of gypsum was interrupted. These results have significant implications for the interpretation of the Messinian Salt Giant.

Keywords: Mars; Messinian; authigenic clays; biosignatures; salt giants; sulfate evaporites.


Conflict of interest statement

The authors declare no conflicts of interest.

Figures

FIGURE 1
FIGURE 1
Geological and stratigraphic setting of the Vena del Gesso basin. (a) Distribution of Messinian evaporitic deposits in the Western Mediterranean region (modified from Lugli et al. 2010); the yellow star indicates the study area. (b) Panoramic view of the Vena del Gesso ridge. Note the cyclic stacking pattern consisting of the alternation of thin organic‐rich shales and thick gypsum beds. (c) The Vena del Gesso section (modified from Guibourdenche et al. 2022) and tuning with the astronomical curve (Laskar et al. 2004). Samples and applied analytical techniques are indicated; CLSM = confocal laser scanning microscopy, LM = light microscopy, SEM‐EDS = scanning electron microscopy coupled to X‐ray energy dispersive spectroscopy, XRPD = X‐ray powder diffraction. (d) Panoramic view of the Monte Tondo quarry. (e) Contact between organic‐rich shale and massive selenite lithofacies. (f) Banded selenite lithofacies. (g) Branching selenite lithofacies.
FIGURE 2
FIGURE 2
Petrographic overview. (a) Polished thin section of a massive selenite crystal; note that the laminae in the re‐entrant angle can be traced in the vertical growth bands (1st PLG cycle). (b) Polished slab of banded selenite showing interlocked cm‐sized crystals; dotted line highlights a twinned selenite crystal surrounded by a whitish carbonate matrix (arrowheads) (4th PLG cycle). (c) Polished slab of branching selenite showing mm‐sized crystals interspersed in a carbonate‐rich matrix (6th PLG cycle).
FIGURE 3
FIGURE 3
Transmitted light (a–d) and SEM (e, f) photomicrographs of excellently preserved diatom remains from the massive selenite lithofacies. (a, b) Whole frustules of thalassiosiroid diatoms with discernible valve processes, indicated by arrowheads (1st PLG cycle). (c, d) Whole frustules of naviculoid diatoms bearing roundish globules, indicated by arrowheads (5th and 14th PLG cycle). (e) Valve of Thalassiosira sp., showing the preservation of central and marginal strutted processes (csp and msp, respectively) and labiate process (lp). (f) Naviculoid diatom remains showing the perfect preservation of valve ornamentation, consisting in the alternation of striae (s) and interstriae (i) (1st PLG cycle).
FIGURE 4
FIGURE 4
Raman spectra of a limpid portion of twinned crystal and of a diatom frustule including autofluorescent globules, indicated by arrowheads (5th PLG cycle); note two prominent peaks at about 1300 and 1600 cm−1 (D‐ and G‐band, respectively). The peak at about 1010 cm−1 indicates gypsum.
FIGURE 5
FIGURE 5
SEM photomicrographs of altered diatom remains from the massive selenite lithofacies. (a–f) Partially dissolved and clay‐coated valves (1st, 4th, 5th and 12th PLG cycle). (g) Naviculoid valve completely replaced by authigenic clays; the other valve, indicated by arrowhead, is still recognizable (5th PLG cycle).
FIGURE 6
FIGURE 6
Transmitted (a) and reflected (b–d) light photomicrographs of filamentous microfossils in twinned crystals of the massive selenite lithofacies. (a) Filamentous microfossils distributed along the re‐entrant angle and the vertical growth bands (4th PLG cycle). (b) Dense accumulation of filaments (2nd PLG cycle). (c) Detail of the filaments; note that filaments are hollow (arrowheads) (2nd PLG cycle). (d) Detail of a filament; the opaque grains (arrowheads) correspond to iron sulfides (2nd PLG cycle).
FIGURE 7
FIGURE 7
SEM photomicrographs and EDS spectra of filamentous microfossils from the massive selenite lithofacies. (a) Clay‐coated filament, (b) detail, and (c, d) corresponding EDS spectra (5th PLG cycle). (e) Clay‐ and dolomite‐coated filament, (f, g) details, and (h) corresponding EDS spectrum; in (g) arrowheads point to hollow microcrystals (9th PLG cycle).
FIGURE 8
FIGURE 8
Transmitted (a–c) and reflected light (d) photomicrographs of floccules entrapped in crystals from the massive and branching selenite lithofacies. (a) Widely spaced floccules (massive selenite—7th PLG cycle). (b) Closely spaced floccules (massive selenite—6th PLG cycle). (c) Detail on a floccule from branching (branching selenite—6th PLG cycle). (d) Pale brownish color of floccules in reflected light; the opaque grains (arrowheads) correspond to iron sulfides (massive selenite—9th PLG cycle).
FIGURE 9
FIGURE 9
SEM photomicrographs and EDS spectra of the content of floccules from the massive selenite lithofacies. (a) Flaky clays and (b) corresponding EDS spectrum (9th PLG cycle). (c) Pyrite grains associated with clays and (d) corresponding EDS spectrum. (e) Dolomite microcrystals and (f) corresponding EDS spectrum (6th PLG cycle). (g, h) Altered remains of naviculoid diatoms (4th PLG cycle).
FIGURE 10
FIGURE 10
Transmitted light (a–d) and SEM (e–g) photomicrographs and EDS spectrum (h) of spheroids from the massive selenite lithofacies. (a) Isolated spheroids (12th PLG cycle). (b) Chain‐forming spheroids (8th PLG cycle). (c) Reddish spheroids (4th PLG cycle). (d) Reddish button‐like particles, indicated by arrowheads (5th PLG cycle). (e, f) Cluster of very small spheroids inside a floccule (14th PLG cycle). (g) Isolated spheroid in a floccule and (h) corresponding EDS spectrum (12th PLG cycle); Au peaks are related to sample coating.
FIGURE 11
FIGURE 11
CLSM photomicrographs and spectral analyses of the solid inclusions. (a) Diatom frustule bearing autofluorescent globules and (b) corresponding emission spectrum (massive selenite—11th PLG cycle). (c) Detail of a filamentous structure and (d) and corresponding emission spectrum (massive selenite—4th PLG cycle). (e) Floccule and (f) corresponding emission spectrum (banded selenite—7th PLG cycle). (g) Spheroid and (h) corresponding emission spectrum (banded selenite—9th PLG cycle).
FIGURE 12
FIGURE 12
Relative percentages of regions of interest characterized by fluorescence maxima comprised between 510 and 710 nm, for each solid inclusion analyzed. The arrows highlight the wavelengths compatible with carotenoids and chlorophyllian pigments. Since no fluorescence maxima above 689 nm have been found, the 710 nm wavelength is not reported. For the sake of readability, the graph is slightly tilted with respect to the vertical axis.
FIGURE 13
FIGURE 13
Summary of the main results.
FIGURE 14
FIGURE 14
Simplified sketch of the diagenetic processes discussed in the text. For sake of simplicity, only the massive selenite lithofacies and two types of solid inclusions (diatoms and filaments) are illustrated. (a) During warm/humid phases, increasing freshwater input favors nutrient input and water column stratification, with the consequent establishment of bottom water anoxia. (b) Sulfate‐reducing bacteria (dark brown) degrades EPS‐rich aggregates of filaments and diatoms, and favors the build‐up of hydrogen sulfide in bottom waters. (c) Sulfidic conditions enhanced diatom cell lysis and the release of organic matter in pore waters, comprising pigments (chl = chlorophyll, car = carotenoids); chlorophyll is rapidly degraded (dchl = degraded chlorophyll), while carotenoids are more refractory to degradation; diatom cell lysis favors frustule dissolution, with consequent build‐up of dissolved silica (dSi) in the pore waters; dSi combines with pore water cations (pwc), attracted by the negatively‐charged EPS matrix produced by bacterial proliferation. (d) Neoformed clays (purple polygons), which together with dolomite (yellow squares) pervasively coats filaments. (e) The neoformed clays entrap carotenoids and degraded chlorophyllian pigments in their interlayers. (f) Formation of a new gypsum lamina.

Similar articles

References

    1. Agustí, S. , Krause J. W., Marquez I. A., Wassmann P., Kristiansen S., and Duarte C. M.. 2018. “Arctic (Svalbard Islands) Active and Exported Diatom Stocks and Cell Health Status.” Biogeosciences Discussions 17: 35–45. 10.5194/bg-2018-459. - DOI
    1. Aloisi, G. , Guibourdenche L., Natalicchio M., et al. 2022. “The Geochemical Riddle of ‘Low‐Salinity Gypsum’ Deposits.” Geochimica et Cosmochimica Acta 327: 247–275. 10.1016/j.gca.2022.03.033. - DOI
    1. Badaut, D. , and Risacher F.. 1983. “Authigenic Smectite on Diatom Frustules in Bolivian Saline Lakes.” Geochimica et Cosmochimica Acta 47: 363–375. 10.1016/0016-7037(83)90259-4. - DOI
    1. Bae, H. , Park J., Ahn H., and Khim J. S.. 2020. “Shift in Benthic Diatom Community Structure and Salinity Thresholds in a Hypersaline Environment of Solar Saltern, Korea.” Algae 35, no. 4: 361–373. 10.4490/algae.2020.35.12.4. - DOI
    1. Bailey, J. V. , Orphan V. J., Joye S. B., and Corsetti F.. 2009. “Chemotrophic Microbial Mats and Their Potential for Preservation in the Rock Record.” Astrobiology 9: 843–859. 10.1089/ast.2008.0314. - DOI - PubMed

LinkOut - more resources