

Optimizing microbiome reference databases with PacBio full-length 16S rRNA sequencing for enhanced taxonomic classification and biomarker discovery
- PMID: 39654676
- PMCID: PMC11625778
- DOI: 10.3389/fmicb.2024.1485073
Optimizing microbiome reference databases with PacBio full-length 16S rRNA sequencing for enhanced taxonomic classification and biomarker discovery
Abstract
Background: The study of the human microbiome is crucial for understanding disease mechanisms, identifying biomarkers, and guiding preventive measures. Advances in sequencing platforms, particularly 16S rRNA sequencing, have revolutionized microbiome research. Despite the benefits, large microbiome reference databases (DBs) pose challenges, including computational demands and potential inaccuracies. This study aimed to determine if full-length 16S rRNA sequencing data produced by PacBio could be used to optimize reference DBs and be applied to Illumina V3-V4 targeted sequencing data for microbial study.
Methods: Oral and gut microbiome data (PRJNA1049979) were retrieved from NCBI. DADA2 was applied to full-length 16S rRNA PacBio data to obtain amplicon sequencing variants (ASVs). The RDP reference DB was used to assign the ASVs, which were then used as a reference DB to train the classifier. QIIME2 was used for V3-V4 targeted Illumina data analysis. BLAST was used to analyze alignment statistics. Linear discriminant analysis Effect Size (LEfSe) was employed for discriminant analysis.
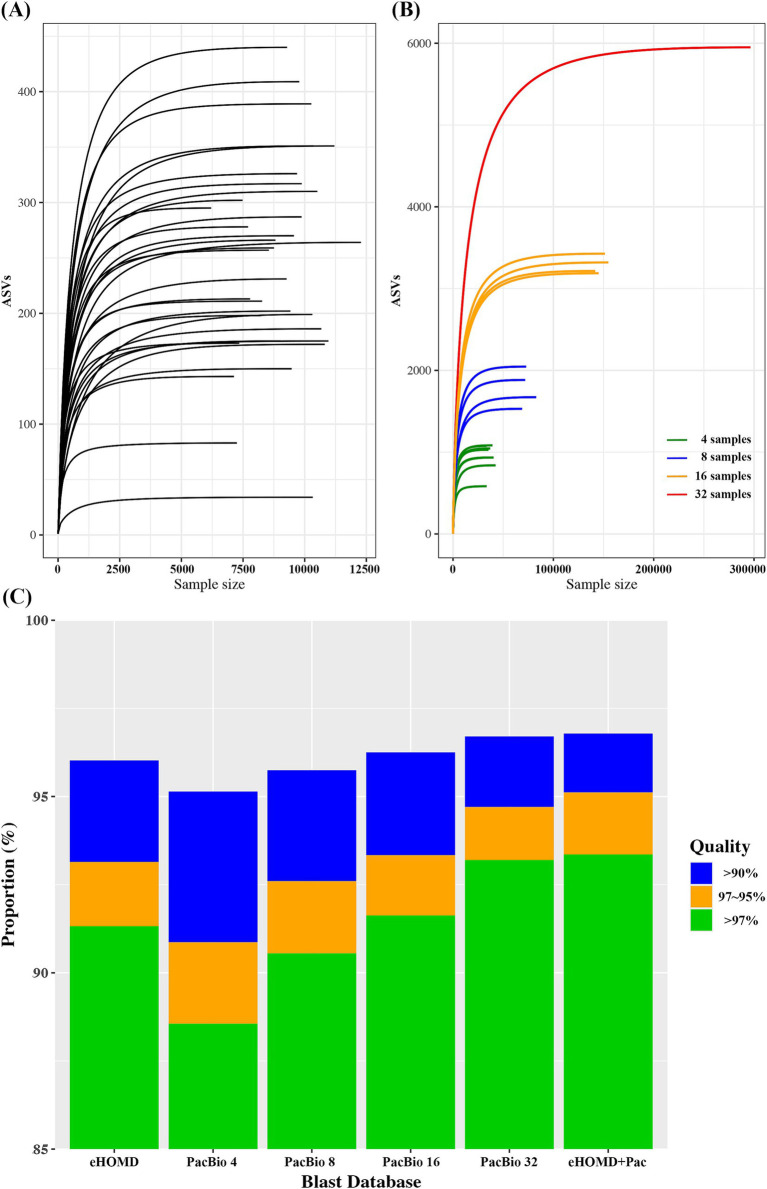
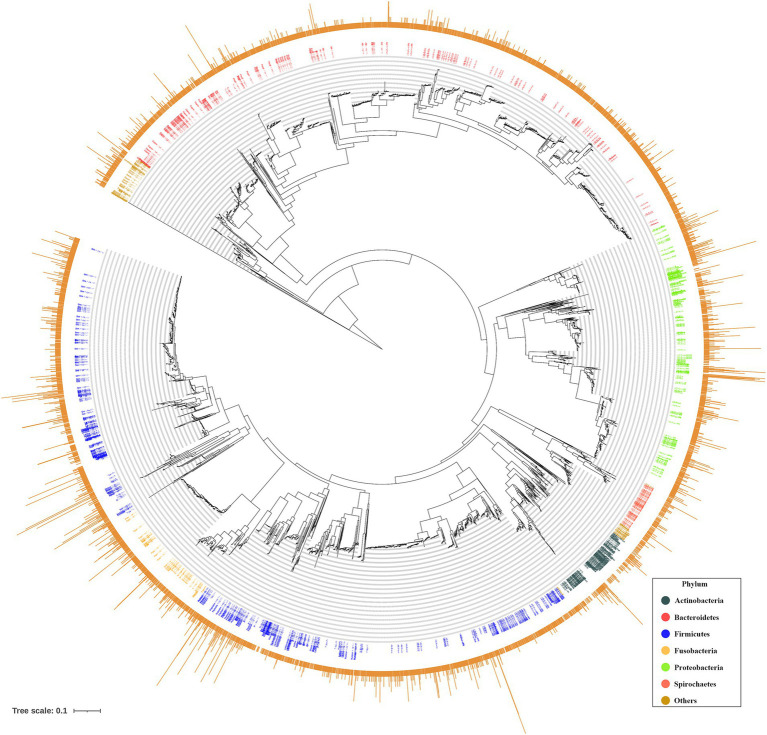
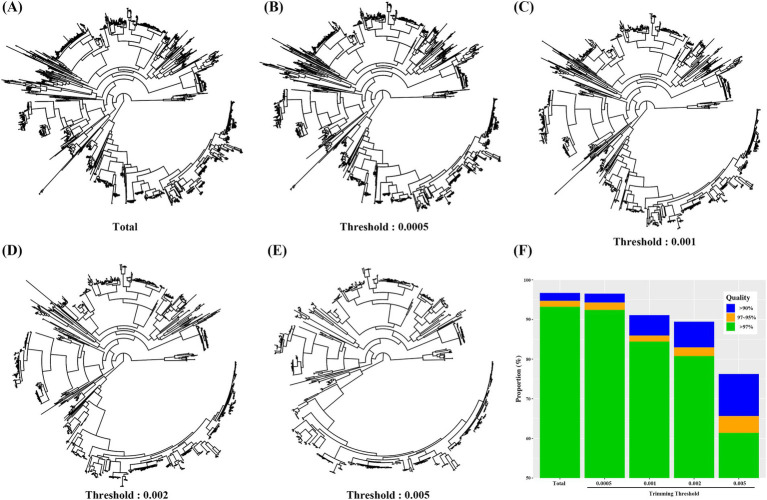
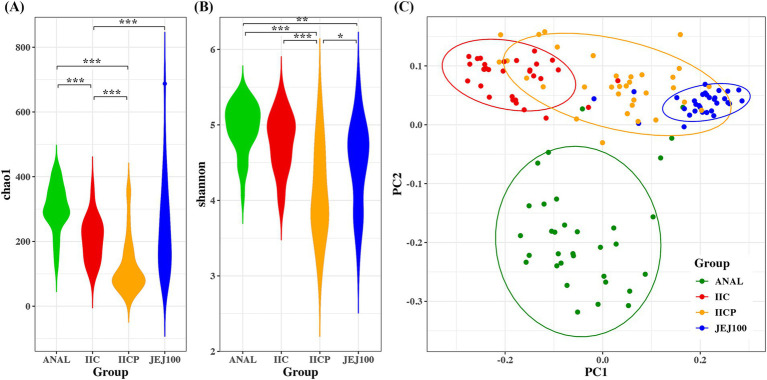
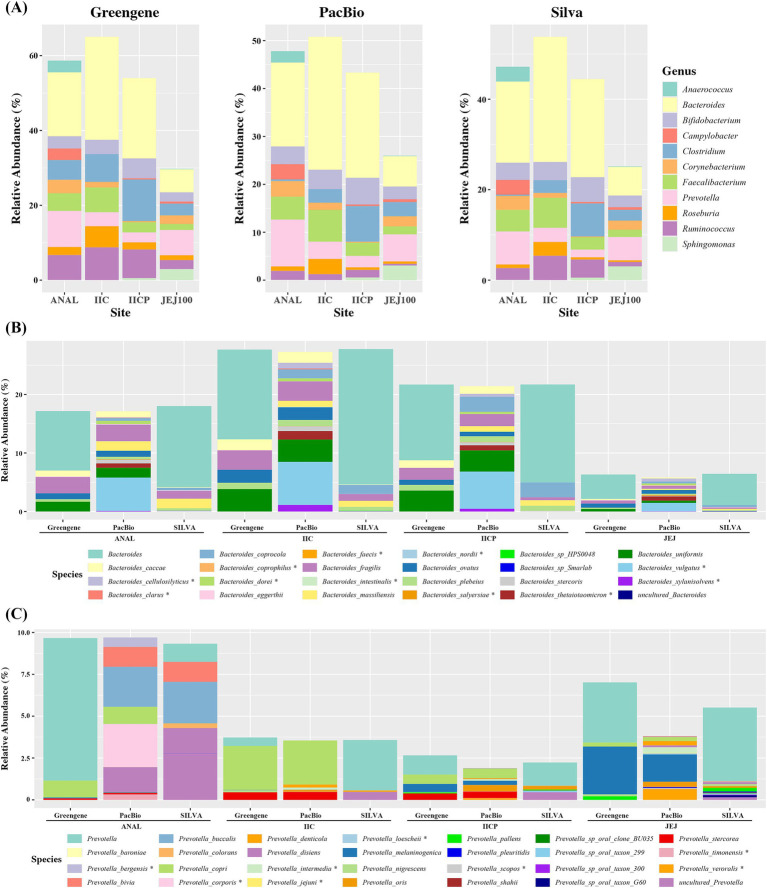
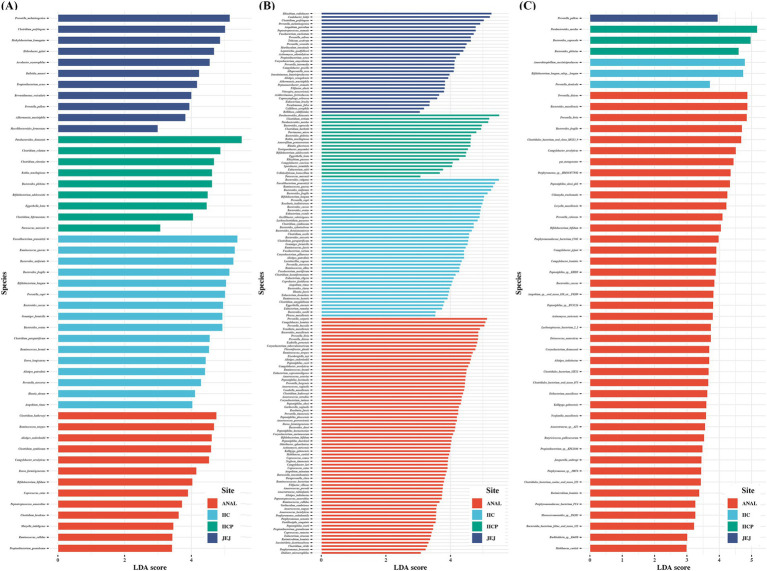
Results: ASVs produced by PacBio showed coverage of the oral microbiome similar to the Human Oral Microbiome Database. A phylogenetic tree was trimmed at various thresholds to obtain an optimized reference DB. This established method was then applied to gut microbiome data, and the optimized gut microbiome reference DB provided improved taxa classification and biomarker discovery efficiency.
Conclusion: Full-length 16S rRNA sequencing data produced by PacBio can be used to construct a microbiome reference DB. Utilizing an optimized reference DB can increase the accuracy of microbiome classification and enhance biomarker discovery.
Keywords: Illumina; PacBio; gut microbiome; next generation sequencing; oral microbiome; reference database.
Copyright © 2024 Han, Choi, Kim, Park, Chung and Na.
Conflict of interest statement
The authors declare that the research was conducted in the absence of any commercial or financial relationships that could be construed as a potential conflict of interest.
Figures
References
-
- Baker M. (2010). Next-generation sequencing: adjusting to data overload. Nat. Methods 7, 495–499. doi: 10.1038/nmeth0710-495 - DOI
-
- Boppana K., Almansouri N. E., Bakkannavar S., Faheem Y., Jaiswal A., Shergill K., et al. (2024). Alterations in gut microbiota as early biomarkers for predicting inflammatory bowel disease onset and progression: a systematic review. Cureus 16:e58080. doi: 10.7759/cureus.58080, PMID: - DOI - PMC - PubMed
LinkOut - more resources
Full Text Sources
Research Materials
Miscellaneous