. 2024 Dec 5:19:13047-13069.
doi: 10.2147/IJN.S488456. eCollection 2024.

Calcofluor White-Phosphatidylethanolamine Conjugate-Enhanced Ethosomal Delivery of Voriconazole for Targeting Candida albicans

Affiliations

Calcofluor White-Phosphatidylethanolamine Conjugate-Enhanced Ethosomal Delivery of Voriconazole for Targeting Candida albicans

Ting Shen et al. Int J Nanomedicine. .

Abstract

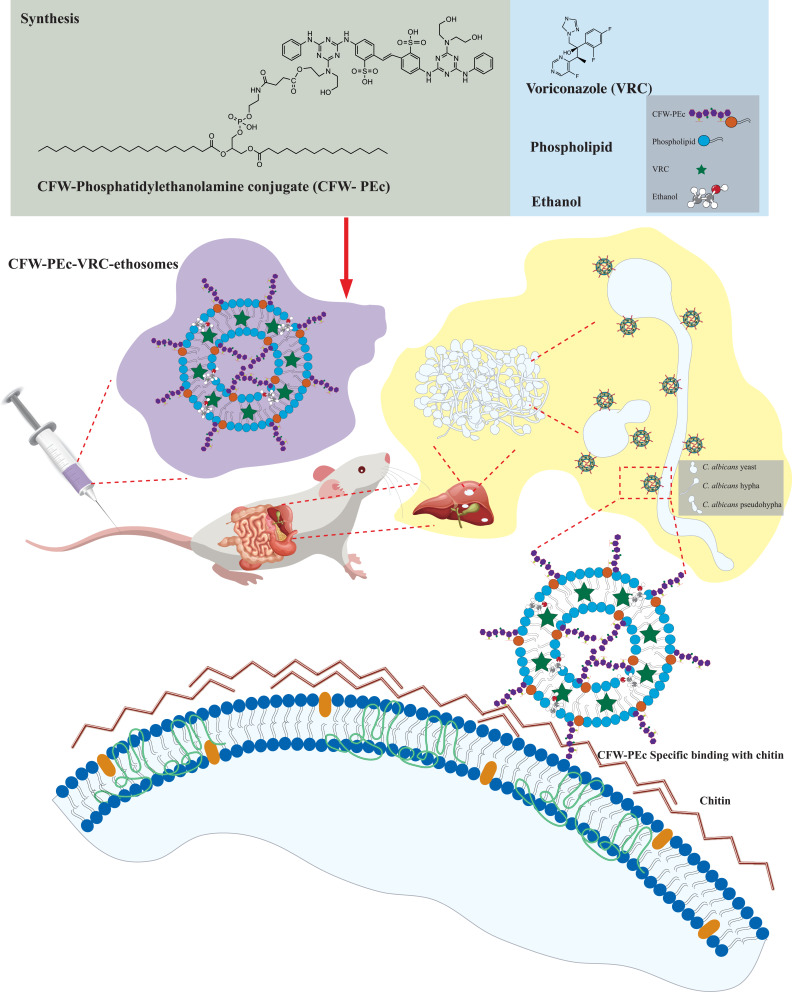
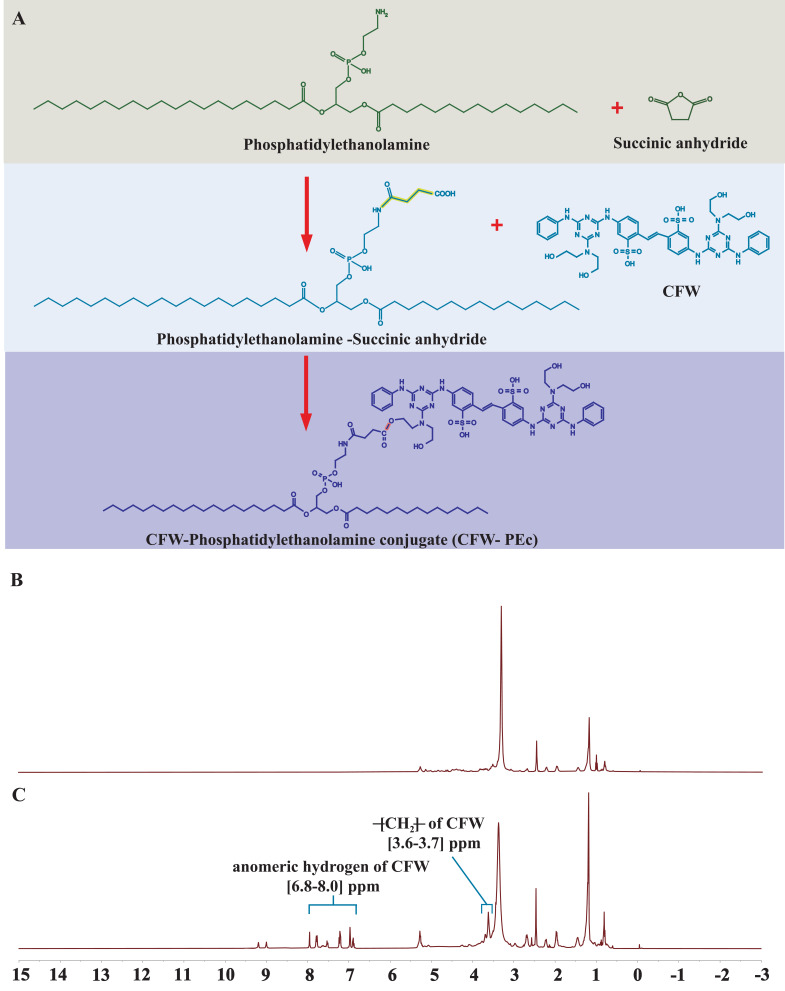
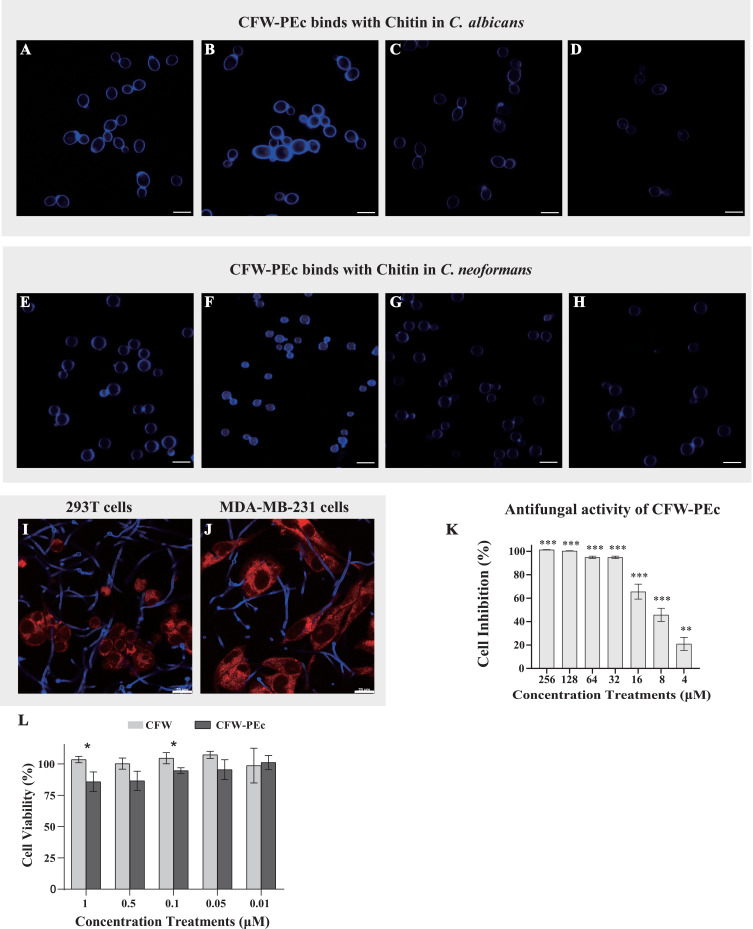
Introduction: The increasing prevalence of systemic fungal infections, especially among immunocompromised individuals, highlights the need for advancements in targeted and effective antifungal treatments. This study presents a novel nanomaterial, CFW-phosphatidylethanolamine conjugate (CFW-PEc), designed to enhance the delivery and efficacy of antifungal agents by targeting fungal cell walls through specific chitin binding. Ethosomes, lipid-based nanocarriers known for their ability to improve drug delivery across skin and cell membranes, were utilized in this study.

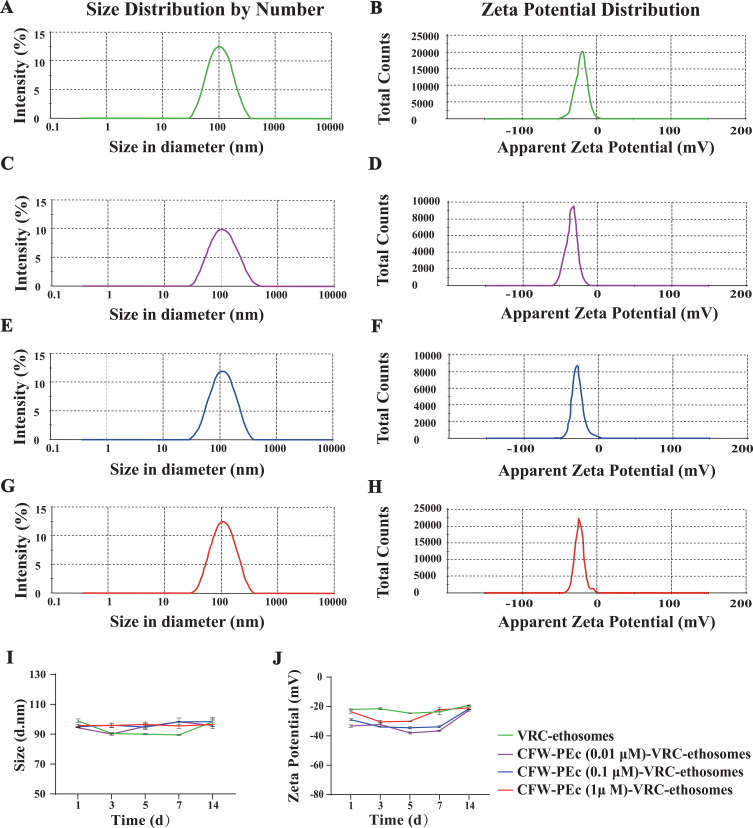
Methods: The physicochemical characteristics of voriconazole-loaded CFW-PEc ethosomes (CFW-PEc-VRC-ethosomes) were examined, including particle size, zeta potential, and entrapment efficiency. Antifungal efficacy of CFW-PEc-VRC-ethosomes was evaluated, including antifungal activity in vitro, CFW-PEc-ethosomes cellular uptake, and models of animal infection and imaging analyses.

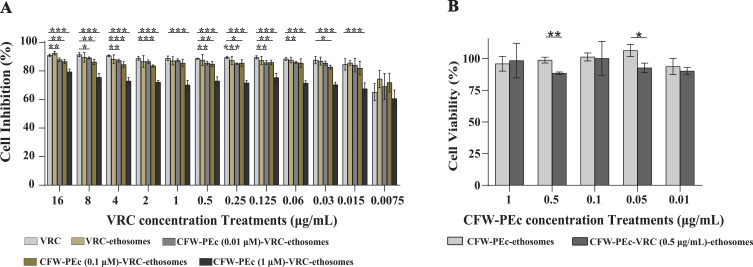
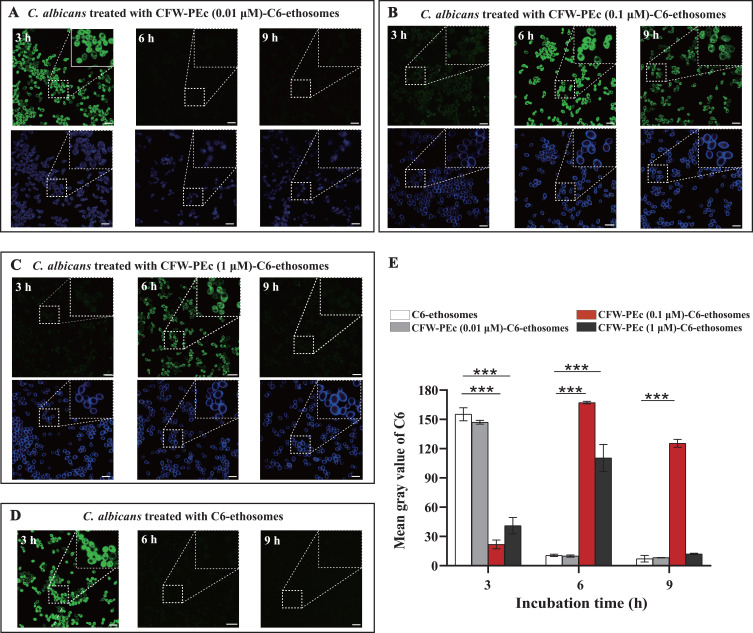
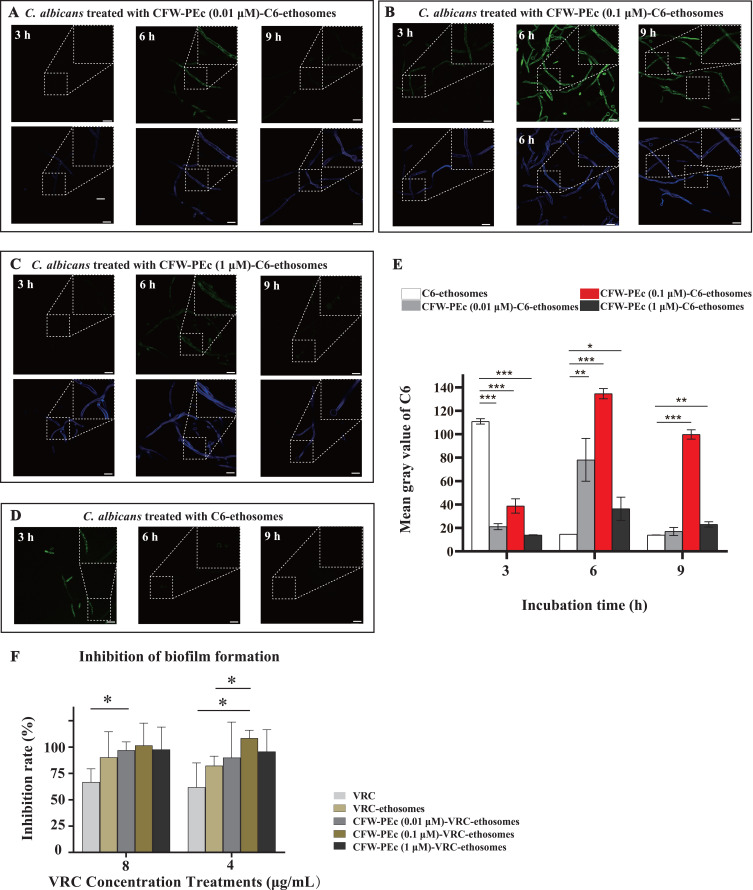
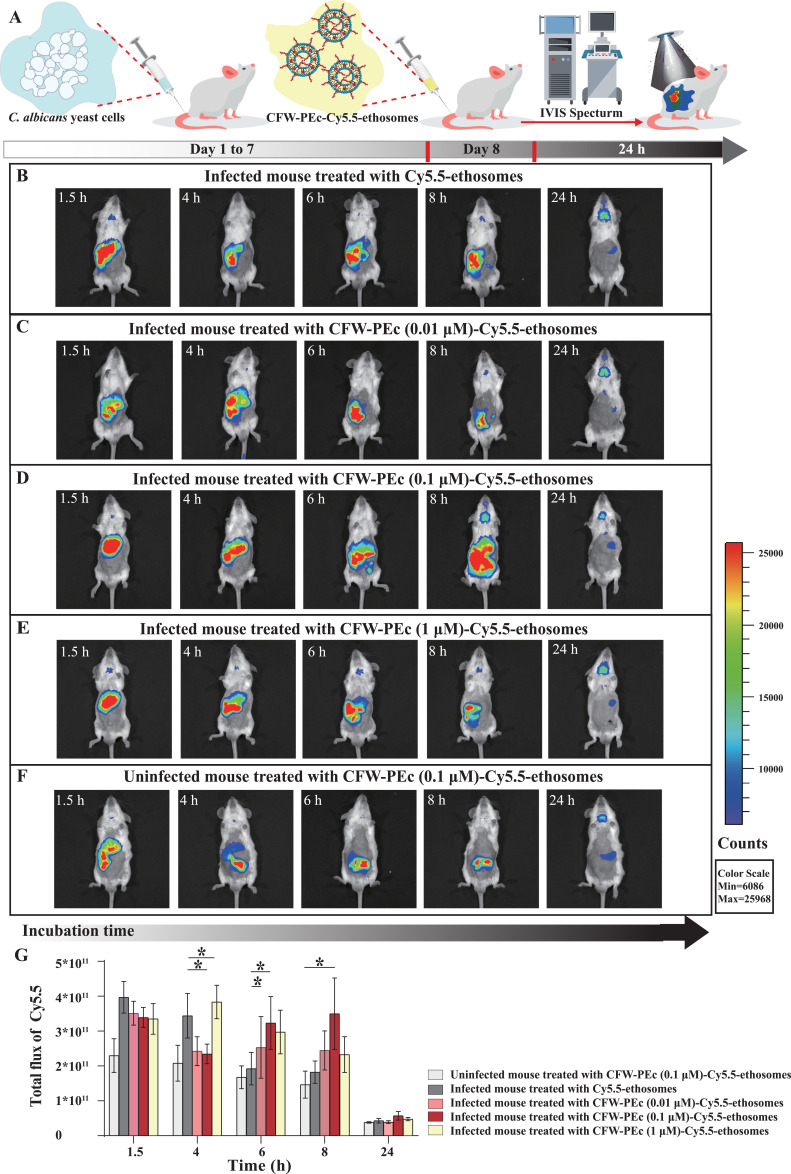
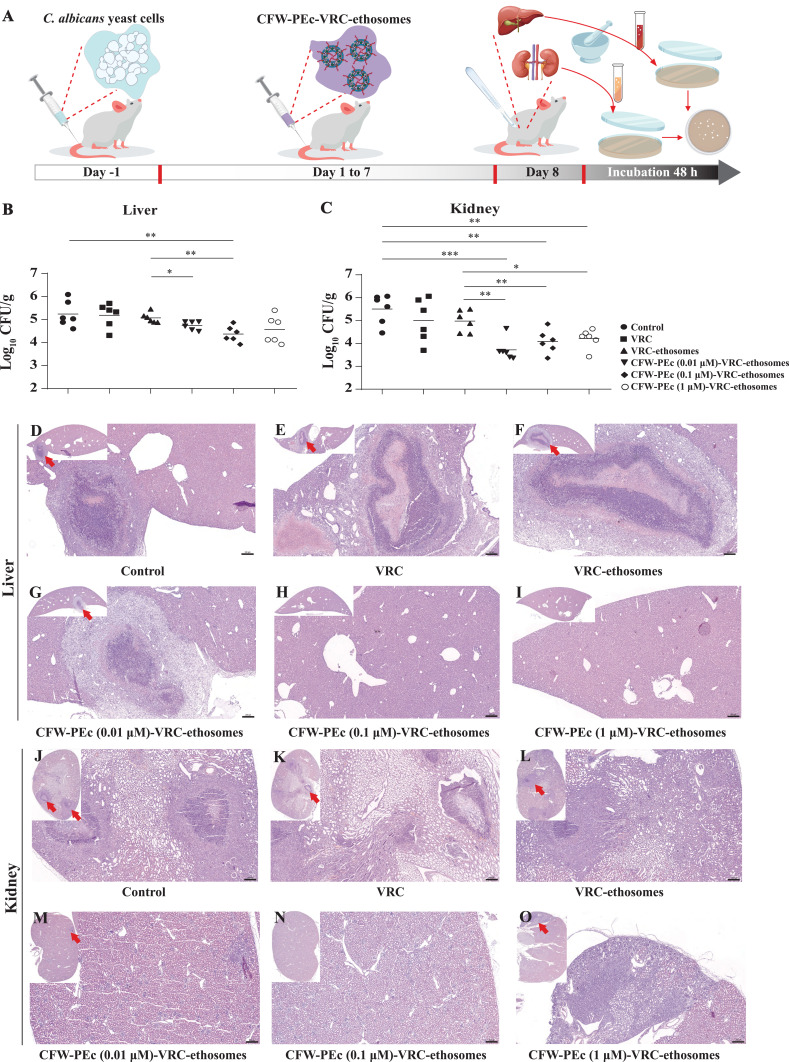
Results: In vitro experiments demonstrated a concentration-dependent inhibition of C. albicans growth by CFW-PEc, with cell inhibition rates reaching nearly 100% at 256 μM. In vivo investigations confirmed a 5-fold reduction in fungal burden in the liver and a 7.8-fold reduction in the kidney compared to the control group following treatment with CFW-PEc (0.1 μM)-VRC-ethosomes. Imaging analyses also confirmed the extended tissue retention of fluorescent dye-loaded CFW-PEc-ethosomes in mice, further underscoring their potential for clinical use.

Discussion: The targeted delivery of antifungal medications via ethosomes coated with CFW-PEc presents a promising strategy to improve antifungal effectiveness while reducing adverse effects, marking a significant advancement in fungal infection therapy.

Keywords: CFW-phosphatidylethanolamine conjugate; antifungal agents; chitin binding; ethosomes; fungal cell walls.


Conflict of interest statement

The authors report no conflicts of interest in this work.

Figures

Scheme 1
Scheme 1
Illustrative depiction of the therapeutic application of CFW-PEc-VRC-ethosomes in mice afflicted with fungal peritonitis. CFW-PEc, a synthesized compound derived from CFW and PE, is employed to formulate ethosomes encapsulating VRC. These ethosomes are administered intravenously to mice suffering from intraperitoneal infections caused by C. albicans. The structural characteristics of C. albicans promote the formation of biofilms at the infection sites, characterized by a loosely structured extracellular matrix predominantly composed of glucans, chitin, and various polymers. The interaction of CFW-PEc with chitin in the cell walls of C. albicans facilitates the targeted delivery of its ethosomes to the Candida infection sites via the bloodstream, thereby enhancing the therapeutic efficacy against the fungal pathogen.
Figure 1
Figure 1
(A) Schematic diagram illustrating the two-step synthesis of CFW-PEc, where succinic anhydride reacts with PE to form an intermediate followed by esterification with CFW to yield CFW-PEc. (B) 1H NMR spectrum of PE in DMSO, demonstrating the initial reactant’s characteristics. (C) 1H NMR spectrum of the synthesized CFW-PEc, highlighting the additional peaks that confirm the successful formation of CFW-PEc.
Figure 2
Figure 2
(A) Fluorescence imaging showing specific localization of CFW-PEc in the cell wall of C. albicans yeast cells cultured in YPD broth. (B) Significant enhancement in fluorescence intensity of CFW-PEc in yeast cells supplemented with 23 mm N-acetylglucosamine, indicating increased binding to chitin. (C) Noticeable reduction in fluorescence intensity with 0.18 mm polyoxin D treatment, suggesting impairment in chitin binding. (D) Minimal fluorescence detected in yeast cells treated with CFW-PEc preincubated with chitin, indicating competitive inhibition of binding. (EH) Fluorescence imaging patterns in C. neoformans cells, similar to those observed in C. albicans. Scale bars are 10 μm. (I) CFW-PEc fluorescence was exclusively detected in C. albicans yeast cells, indicating specificity for fungal cells over 293T cells. (J) CFW-PEc fluorescence in co-culture with MDA-MB-231 cells demonstrates selective retention in C. albicans. Scale bars are 20 μm. (K) Inhibition rates of CFW-PEc against C. albicans yeast cells, highlighting significant efficacy across concentrations (**P ≤ 0.01; ***P ≤ 0.001). (L) Viability comparison of 293T cells treated with CFW versus CFW-PEc, indicating relative safety with CFW-PEc treatment (*P ≤ 0.05).
Figure 3
Figure 3
(AH) Comparative analysis illustrating zeta potential and particle size distribution of VRC-ethosomes (green), CFW-PEc (0.01 μM)-VRC-ethosomes (purple), CFW-PEc (0.1 μM)-VRC-ethosomes (blue), and CFW-PEc (1 μM)-VRC-ethosomes (red), highlighting the differences in their drug delivery profiles. (IJ) Stability assessment of CFW-PEc (0.01 μM–1 μM)-VRC-ethosomes showing no significant changes in particle size and zeta potential after 2 weeks at 25°C, suggesting robust storage conditions.
Figure 4
Figure 4
(A) In vitro antifungal activity of CFW-PEc (0.01–1 µM)-VRC-ethosomes, VRC-ethosomes, and VRC against C. albicans yeast cells, emphasizing significant antifungal efficacy (*P ≤ 0.05; **P ≤ 0.01; ***P ≤ 0.001). (B) Cytotoxicity assessment of CFW-PEc formulations on 293T cells, reinforcing safety profiles with significant differences noted at various concentrations (*P ≤ 0.05; **P ≤ 0.01).
Figure 5
Figure 5
(AD) Confocal microscopy images show the uptake of CFW-PEc (0.01 μM)-C6-ethosomes, CFW-PEc (0.1 μM)-C6-ethosomes, CFW-PEc (1 μM)-C6-ethosomes, and C6- ethosomes in C. albicans yeast cells over time (3, 6, and 9 hours). The peak fluorescence intensity of C6 (green) detected at various time points indicates differences in uptake efficiency influenced by CFW-PEc, while the blue fluorescence originates from CFW-PEc excitation, illustrating its distribution within the cells. All images include scale bars of 10 μm, with magnified regions outlined by white dashed lines for clarity. (E) Quantification of fluorescence intensity for C6-loaded nanoparticles, showing significant differences in uptake efficiency with the highest mean gray value for CFW-PEc (0.1 μM)-C6-ethosomes at 6 hours compared to C6-ethosomes (***P ≤ 0.001).
Figure 6
Figure 6
(AD) Confocal microscopy images illustrating the uptake of CFW-PEc (0.01 μM)-C6-ethosomes, CFW-PEc (0.1 μM)-C6-ethosomes, CFW-PEc (1 μM)-C6-ethosomes, and C6-ethosomes in C. albicans hyphal cells over 3, 6, and 9 hours in spider medium. The images display dual fluorescence channels, with green fluorescence representing C6 uptake and blue fluorescence indicating the distribution of CFW-PEc within the cells. All images include scale bars of 10 μm, with white dashed lines outlining magnified regions for clarity. (E) Quantification of fluorescence intensity for C6-loaded nanoparticles, showing significant differences in uptake efficiency with the highest mean gray value for CFW-PEc (0.1 μM)-C6-ethosomes at 6 hours compared to C6-ethosomes (*P ≤ 0.05; **P ≤ 0.01; ***P ≤ 0.001). (F) Results of the crystal violet assay demonstrating the inhibition rate of biofilm formation in C. albicans hyphal cells treated with CFW-PEc (0.1 μM)-VRC-ethosomes at 4 and 8 μg/mL, highlighting significant efficacy in biofilm inhibition (*P ≤ 0.05).
Figure 7
Figure 7
(A) Schematic representation of the experimental procedure for in vivo fluorescence imaging of Cy5.5-loaded nanoparticles in Kunming mice. (BF) Fluorescence imaging results at various time points post-treatment using an IVIS Spectrum. Each group of four infected Kunming mice received intravenous treatments with different formulations of fluorescent nanoparticles, and their fluorescence was assessed at five different time points. (B) Fluorescence imaging of infected mice treated with Cy5.5-ethosomes, showing strong fluorescence signals in the peritoneal cavity after 1.5 hours. (C) Infected mice treated with CFW-PEc (0.01 μM)-Cy5.5-ethosomes exhibited enhanced fluorescence retention. (D) Infected mice treated with CFW-PEc (0.1 μM)-Cy5.5-ethosomes demonstrated significant fluorescence accumulation, especially at 8 hours. (E) Infected mice treated with CFW-PEc (1 μM)-Cy5.5-ethosomes also showed improved signal retention. (F) Non-infected mice treated with CFW-PEc (0.1 μM)-Cy5.5-ethosomes presented lower fluorescence levels across all time points, indicating reduced non-specific accumulation. (G) Analysis using Living Image software, demonstrating that the total flux of Cy5.5 was significantly higher in infected mice treated with CFW-PEc formulations compared to Cy5.5-ethosomes alone (*P ≤ 0.05).
Figure 8
Figure 8
In vivo assessment of the antifungal activity of CFW-PEc-VRC-ethosomes in Kunming mice infected with C. albicans. (A) Schematic representation of the experimental procedure illustrating the treatment protocol. (B and C) Quantification of CFUs from liver (B) and kidney (C) tissues of infected mice treated with various formulations, showing significantly lower fungal burdens in those receiving CFW-PEc-VRC-ethosomes compared to the controls (*P ≤ 0.05; **P ≤ 0.01; ***P ≤ 0.001). (DI) Histopathological analysis of liver sections stained with H&E, showing varying degrees of necrotic lesions and inflammatory responses in the control and treated groups. Notably, CFW-PEc (0.1 μM)-VRC-ethosomes exhibited minimal pathological changes compared to controls. (JO) Histopathological analysis of kidney tissues indicating inflammation and damage due to C. albicans infection; the treated groups displayed improved tissue integrity. Red arrows highlight pathological changes in liver and kidney indicative of C. albicans infection. All images include scale bars of 200 μm.

Similar articles

References

    1. Lockhart SR, Guarner J. Emerging and reemerging fungal infections. Semin Diagn Pathol. 2019;36(3):177–181. doi:10.1053/j.semdp.2019.04.010 - DOI - PMC - PubMed
    1. Lakoh S, Rickman H, Sesay M, et al. Prevalence and mortality of cryptococcal disease in adults with advanced HIV in an urban tertiary hospital in Sierra Leone: a prospective study. BMC Infect Dis. 2020;20(1):141. doi:10.1186/s12879-020-4862-x - DOI - PMC - PubMed
    1. Otto WR, Green AM. Fungal infections in children with haematologic malignancies and stem cell transplant recipients. Br J Haematol. 2020;189(4):607–624. doi:10.1111/bjh.16452 - DOI - PMC - PubMed
    1. Gushiken AC, Saharia KK, Baddley JW. Cryptococcosis. Infect Dis Clin North Am. 2021;35(2):493–514. doi:10.1016/j.idc.2021.03.012 - DOI - PubMed
    1. Blot S, Rello J, Koulenti D. Diagnosing invasive pulmonary aspergillosis in ICU patients: putting the puzzle together. Curr Opin Crit Care. 2019;25(5):430–437. doi:10.1097/MCC.0000000000000637 - DOI - PubMed

MeSH terms