

The Effect of Systemic Immune-Inflammatory Index (SII) and Prognostic Nutritional Index (PNI) in Early Gastric Cancer
- PMID: 39654858
- PMCID: PMC11625636
- DOI: 10.2147/JIR.S499094
The Effect of Systemic Immune-Inflammatory Index (SII) and Prognostic Nutritional Index (PNI) in Early Gastric Cancer
Abstract
Background: In recent years, the systemic immune-inflammatory index (SII) and prognostic nutritional index (PNI) have been considered potential predictors of survival outcomes in various solid tumors, including gastric cancer. However, there is a notable lack of research focusing on their prognostic implications specifically in the early stage of gastric cancer. This study aims to investigate the prognostic indicators of early gastric cancer (EGC), including neutrophil-to-lymphocyte ratio (NLR), platelet-to-lymphocyte ratio (PLR), SII, PNI, and lymph node metastasis (LNM).
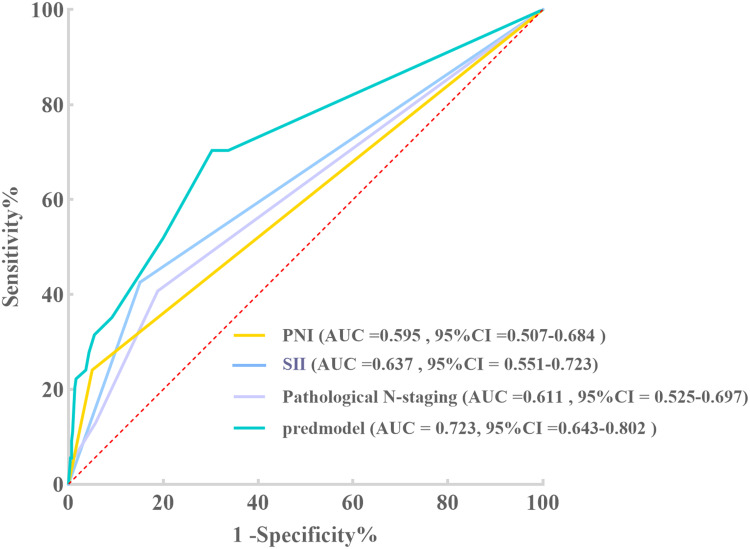
Methods: In this retrospective analysis, we examined 490 patients diagnosed with EGC (pT1Nx). The peripheral blood indices of interest were SII, PNI, PLR, and NLR. The receiver operating characteristic (ROC) curves and the area under the ROC curve (AUC) were used to determine optimal cutoff values and prognostic efficacy for each parameter. Additionally, Kaplan-Meier survival curves and multivariate Cox regression models were utilized to delineate independent prognostic factors.
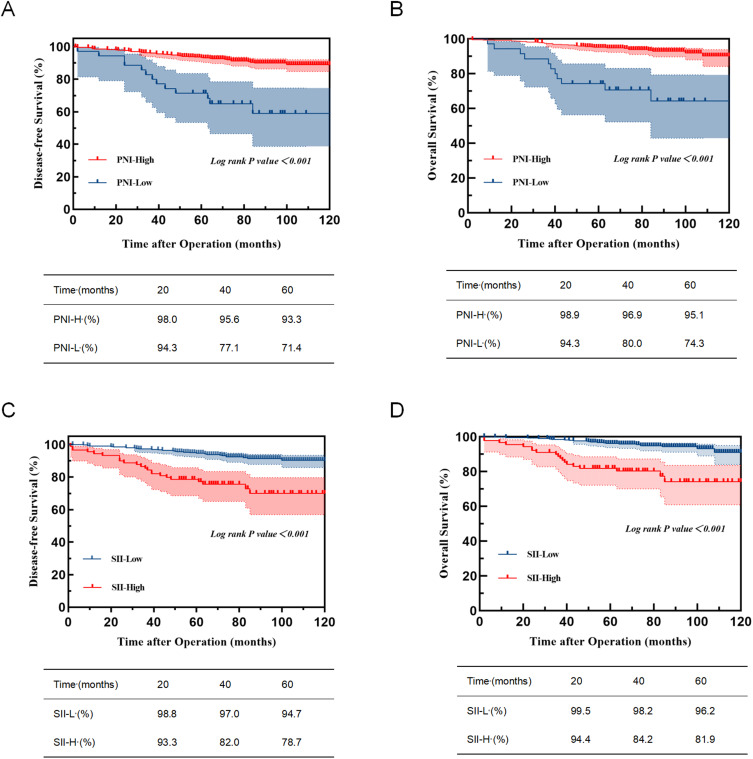
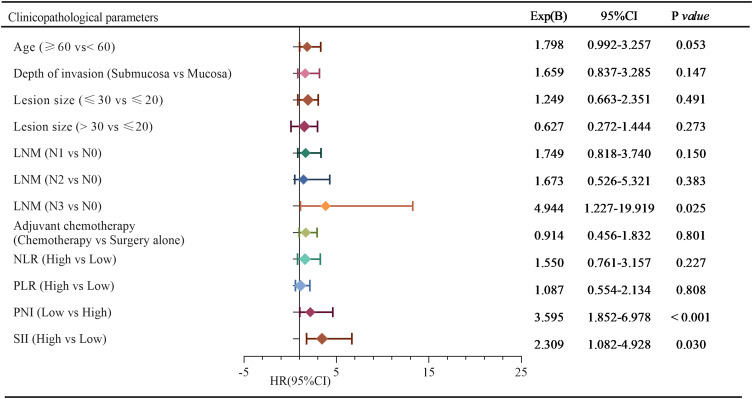
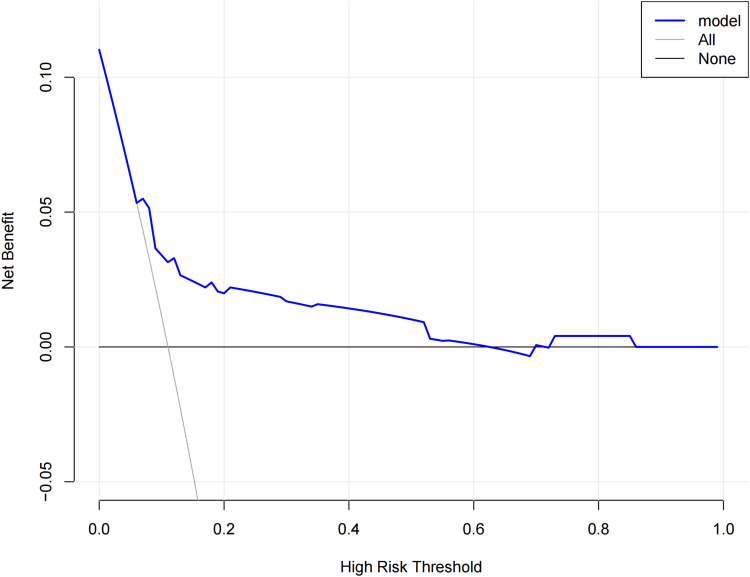
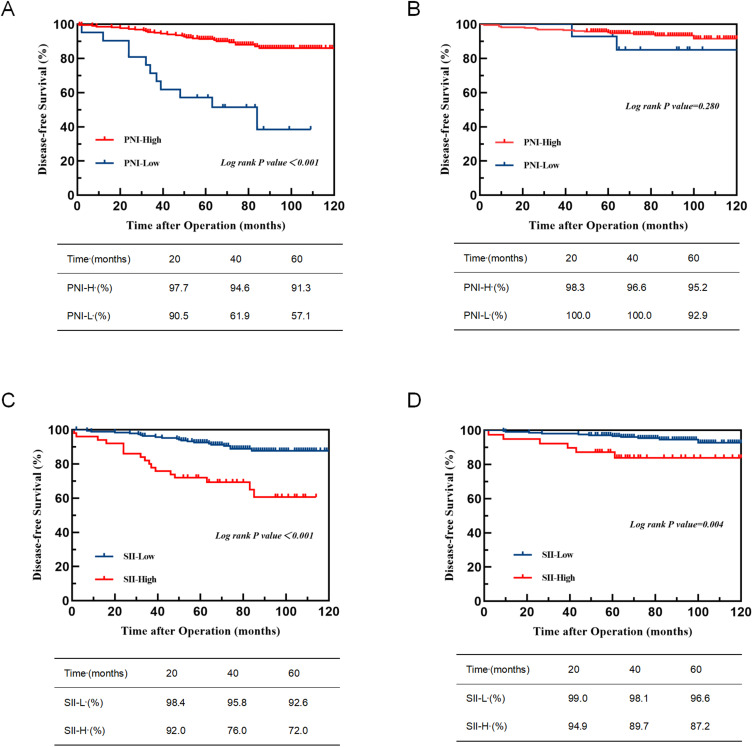
Results: The optimal cutoff values for SII and PNI were determined as 613.05 and 42.21, respectively. Patients in the low SII (SII-L) group demonstrated significantly higher 5-year Disease-Free Survival (DFS) and Overall Survival (OS) rates of 94.7% and 96.2%, compared to the high SII (SII-H) group (DFS: 78.7%; OS: 81.9%), with both differences proving statistically significant (P < 0.001, P < 0.001). Similarly, patients in the high PNI (PNI-H) group showed superior 5-year DFS (93.3%) and OS rates (95.1%) versus the low PNI (PNI-L) group (DFS: 71.4%; OS: 74.3%), also demonstrating statistical significance (P < 0.001, P < 0.001). Multivariate analysis identified SII, PNI, and LNM as independent prognostic factors for EGC. A combined analysis of SII, PNI, and LNM yielded a C-index of 0.723 (P = 0.008).
Conclusion: SII, PNI, and LNM are effective markers for predicting the survival outcomes of patients undergoing radical gastrectomy for EGC.
Keywords: early gastric cancer; lymph node metastasis; prognosis; prognostic nutritional index; systemic inflammatory response index.
© 2024 Jing et al.
Conflict of interest statement
The authors report no conflict of interest in this work.
Figures
References
-
- Miao RL, Li Z, Ji J. Current treatment status and trends of early gastric cancer in China: analyzed based on the data of China Gastrointestinal Cancer Surgery Union. Chinese J Pract Sur. 2019;39(05):419–423. doi: 10.19538/j.cjps.issn1005-2208.2019.05.03 - DOI
LinkOut - more resources
Full Text Sources
