. 2024 Nov 25:15:1481331.
doi: 10.3389/fimmu.2024.1481331. eCollection 2024.

Signature of immune-related metabolic genes predicts the prognosis of hepatocellular carcinoma

Affiliations

Signature of immune-related metabolic genes predicts the prognosis of hepatocellular carcinoma

Weibin Zhuo et al. Front Immunol. .

Abstract

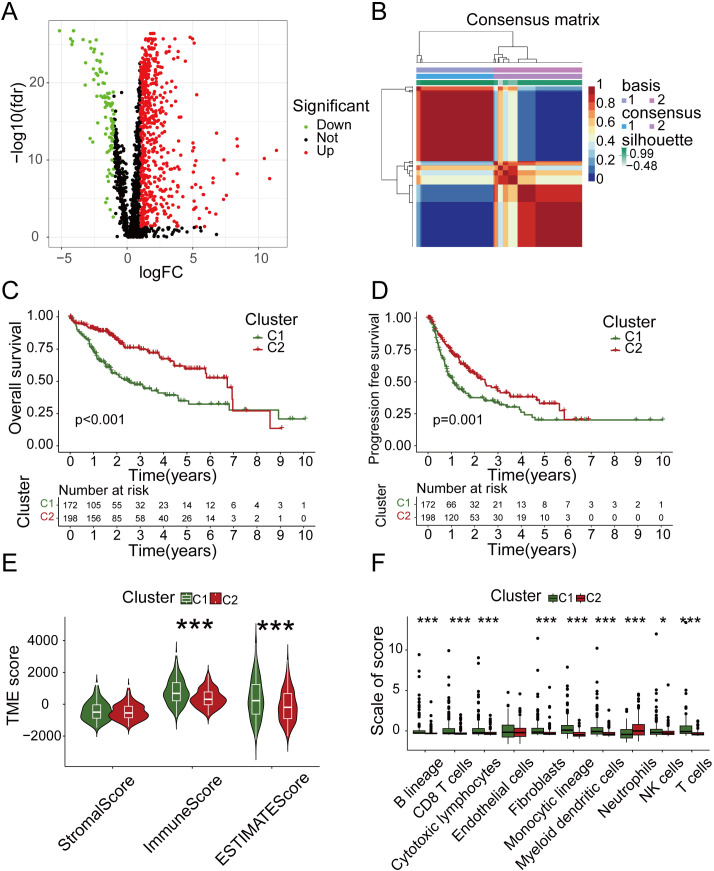
Introduction: The majority of liver cancer cases (90%) are attributed to hepatocellular carcinoma (HCC), which exhibits significant heterogeneity and an unfavorable prognosis. Modulating the immune response and metabolic processes play a crucial role in both the prevention and treatment of HCC. However, there is still a lack of comprehensive understanding regarding the immune-related metabolic genes that can accurately reflect the prognosis of HCC.

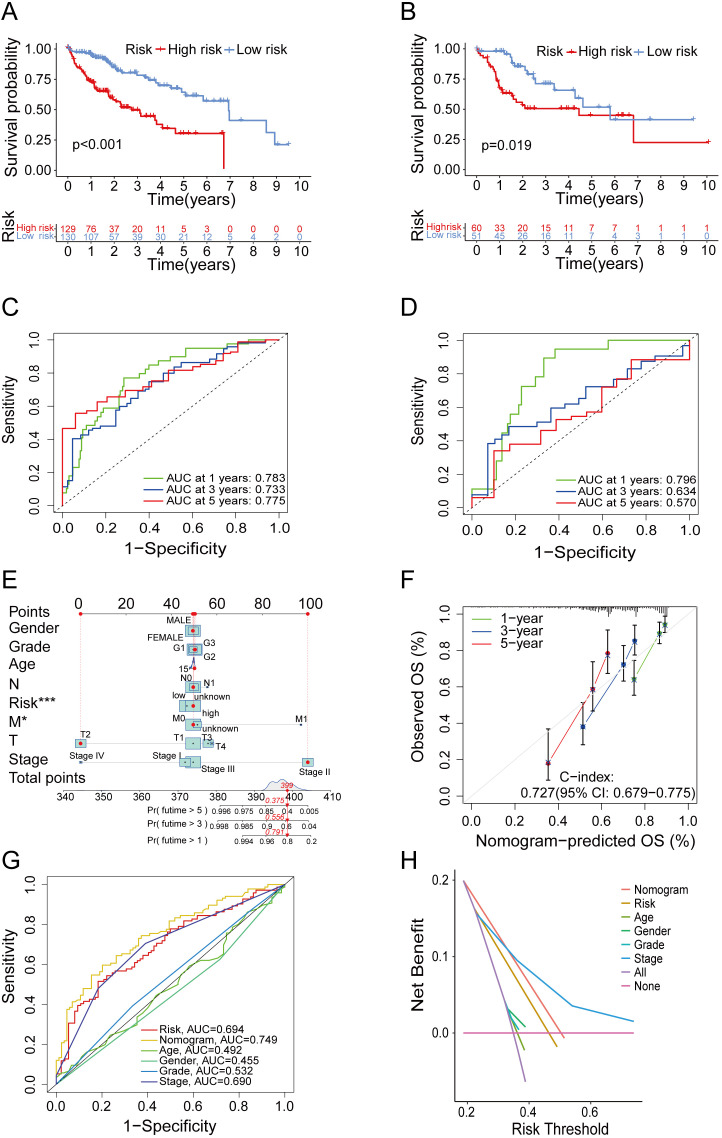
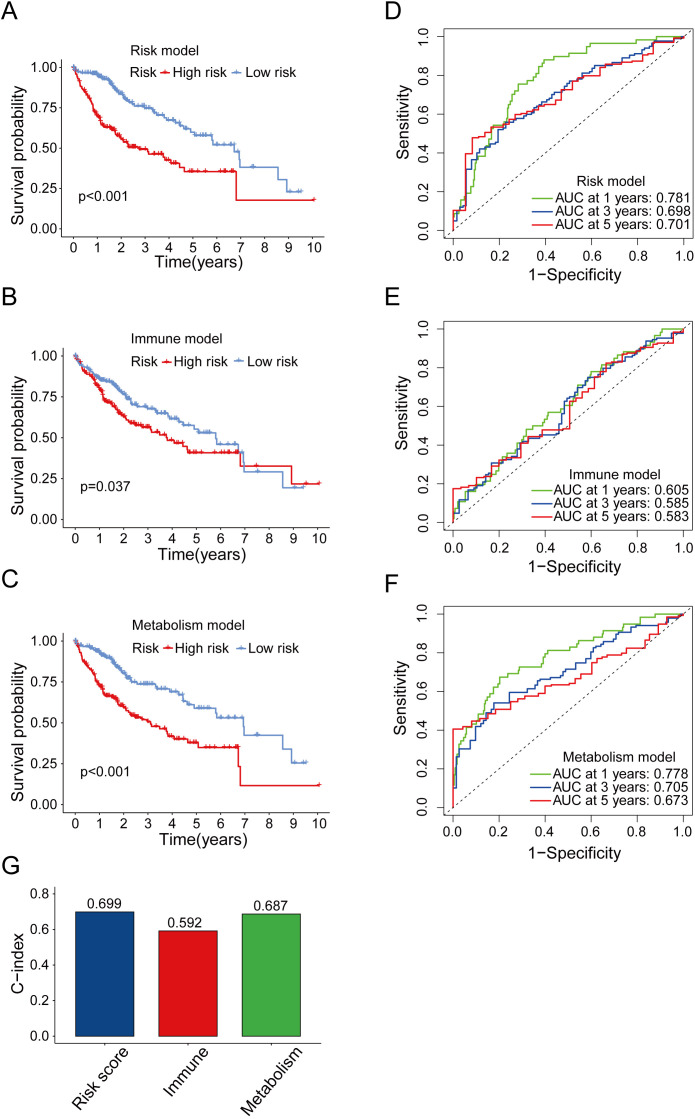
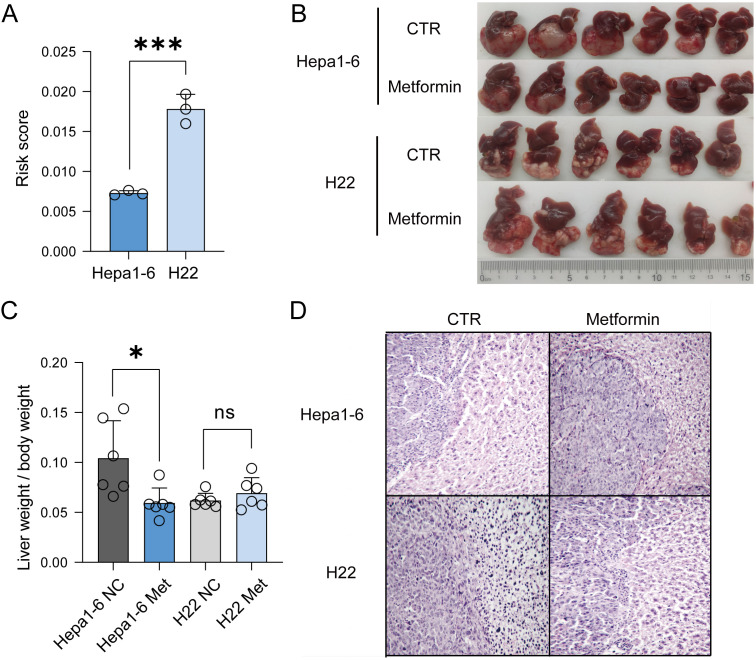
Methods: In order to address this issue, we developed a prognostic prediction model based on immune and metabolic genes. To evaluate the accuracy of our model, we performed survival analyses including Kaplan-Meier (K-M) curve and time-dependent receiver operating characteristic (ROC) curve. Furthermore, we compared the predictive performance of our risk model with existing models. Finally, we validated the accuracy of our risk model using mouse models with in situ transplanted liver cancer.

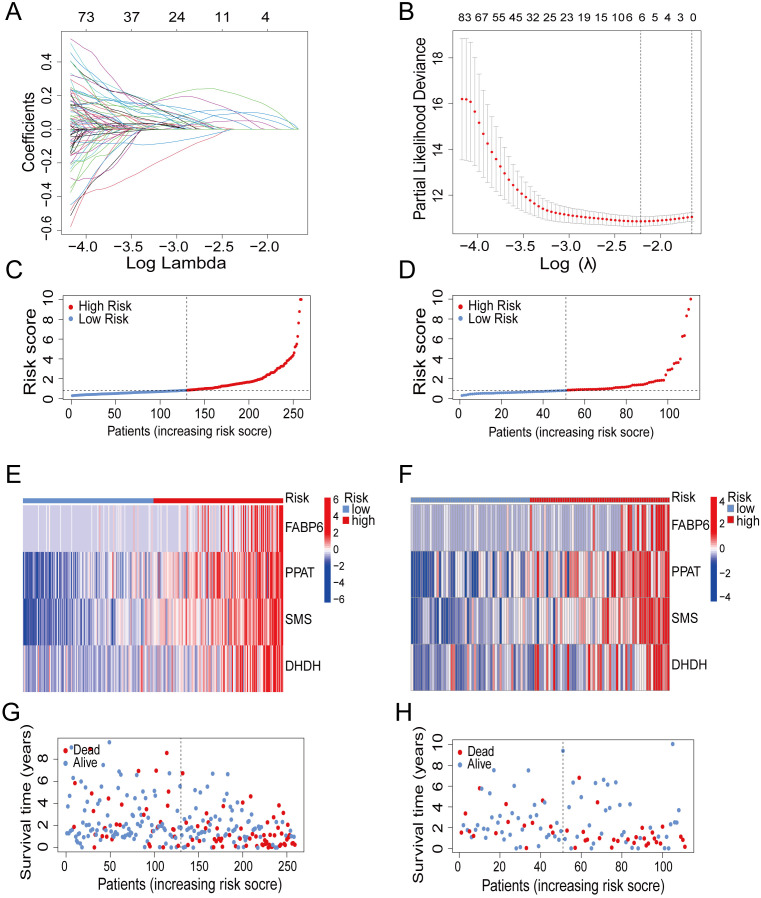
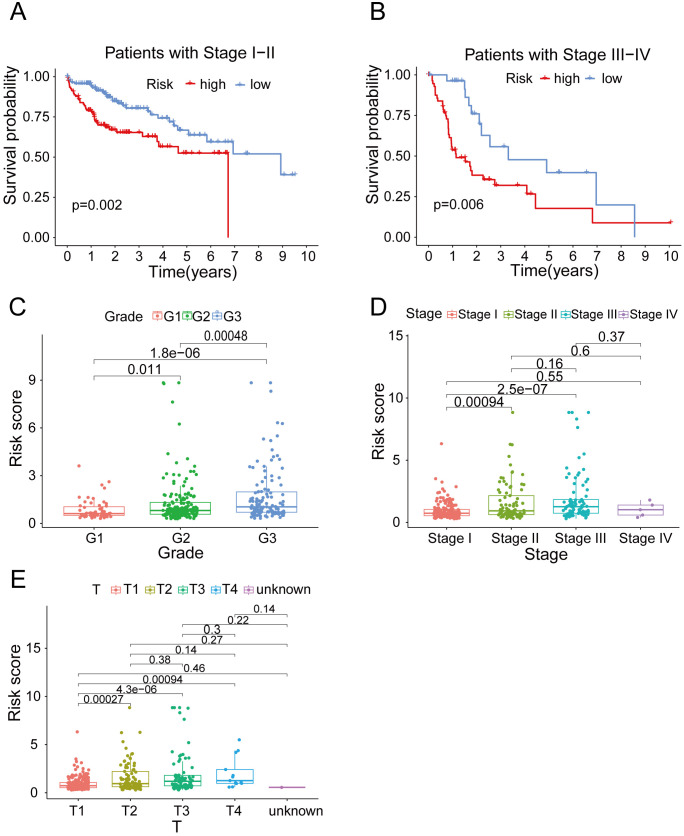
Results: By conducting lasso regression analysis, we identified four independent prognostic genes: fatty acid binding protein 6 (FABP6), phosphoribosyl pyrophosphate amidotransferase (PPAT), spermine synthase (SMS), and dihydrodiol dehydrogenase (DHDH). Based on these findings, we constructed a prognostic model. Survival analysis revealed that the high-risk group had significantly lower overall survival (OS) rates. Besides that, the ROC curve demonstrated the effective prognostic capability of our risk model for hepatocellular carcinoma (HCC) patients. Furthermore, through animal experiments, we validated the accuracy of our model by showing a correlation between high-risk scores and poor prognosis in tumor development.

Discussion: In conclusion, our prognostic model surpasses those solely based on immune genes or metabolic genes in terms of accuracy. We observed variations in prognosis among different risk groups, accompanied by distinct immune and metabolic characteristics. Therefore, our model provides an original evaluation index for personalized clinical treatment strategies targeting HCC patients.

Keywords: immunity; liver cancer; metabolism; prognostic model; risk score.


Conflict of interest statement

The authors declare that the research was conducted in the absence of any commercial or financial relationships that could be construed as a potential conflict of interest.

Figures

Figure 1
Figure 1
NMF subtyping and analysis of tumor microenvironment. (A) Volcano map of differentially expressed genes in normal and tumor samples. (B) Two subgroups were identified as optimal values for consensus clustering. (C) OS analysis of two subtypes. (D) PFS analysis of two subtypes. (E) Tumor microenvironment related scores of two subtypes. (F) The immune infiltration analysis of two subtypes.
Figure 2
Figure 2
Construction of prognostic model. (A) Partial likelihood deviance with changing of log (λ) plotted through LASSO Cox regression in 10-fold cross-validations. (B) Coefficients with changing of log (λ) plotted through LASSO Cox regression in 10-fold cross-validations. (C, D) The distribution of risk scores in the train group and test group. (E, F) Heatmap of 4 genes expression in the train group and test group. (G, H) The survival status of patients in the train group and test group.
Figure 3
Figure 3
Verification of the predictive ability of the model. (A, B) Kaplan–Meier curves of survival in train group (A) and test group (B). (C, D) Time-dependent ROC curve of the risk score model for predicting 1, 3 and 5 years in train group (C) and test group (D). (E) The nomogram for predicting survival proportion of patients in 1, 3 and 5 years. (F) The calibration plots for predicting patient survival at 1, 3 and 5 years. (G) Comparison of time-dependent ROC curve of multiple factors. (H) Comparison of decision curve analysis of multiple factors.
Figure 4
Figure 4
The clinical correlation analysis. (A) OS in the high-risk and low- risk groups of HCC patients in stage I-II. (B) OS in the high-risk and low- risk groups of HCC patients in stage III-IV. (C) The clinical correlation analysis of grade. (D) The clinical correlation analysis of cancer stage. (E) The clinical correlation analysis of T stage.
Figure 5
Figure 5
Comparison between risk model and other prognostic models. (A) OS analysis of high-risk and low-risk groups in risk model. (B) OS analysis of high-risk and low-risk groups in immune model. (C) OS analysis of high-risk and low-risk groups in metabolism model. (D-F) Time-dependent ROC curve of the risk model (D), immune model (E) and metabolism model (F) for predicting 1, 3 and 5 years. (G) Concordance index comparison of three prognostic models.
Figure 6
Figure 6
Verification of the accuracy of the model in vivo experiments. (A) Risk score of Hepa1-6 and H22 liver cancer cells. (B) Using Hepa1-6 and H22 cells to establish orthotopic mouse models. (C) Comparison of liver weight to body weight between the two models. (D) H&E staining indicated that after treatment with metformin, the prognosis of H22 liver cancer was worse than that of Hepa1-6 liver cancer.

Similar articles

Cited by

References

    1. Llovet JM, Kelley RK, Villanueva A, Singal AG, Pikarsky E, Roayaie S, et al. . Hepatocellular carcinoma. Nat Rev Dis Primers. (2021) 7:6. doi: 10.1038/s41572-020-00240-3 - DOI - PubMed
    1. Hussain SA, Ferry DR, El-Gazzaz G, Mirza DF, James ND, McMaster P, et al. . Hepatocellular carcinoma. Ann Oncol. (2001) 12:161–72. doi: 10.1023/a:1008370324827 - DOI - PubMed
    1. Forner A, Reig M, Bruix J. Hepatocellular carcinoma. Lancet. (2018) 391:1301–14. doi: 10.1016/S0140-6736(18)30010-2 - DOI - PubMed
    1. European Association For The Study Of The, L., European Organisation For, R. & Treatment Of, C . EASL-EORTC clinical practice guidelines: management of hepatocellular carcinoma. J Hepatol. (2012) 56:908–43. doi: 10.1016/j.jhep.2011.12.001 - DOI - PubMed
    1. Iwai Y, Hamanishi J, Chamoto K, Honjo T. Cancer immunotherapies targeting the PD-1 signaling pathway. J BioMed Sci. (2017) 24:26. doi: 10.1186/s12929-017-0329-9 - DOI - PMC - PubMed

Substances

LinkOut - more resources