. 2024 Dec 9;10(6):00199-2024.
doi: 10.1183/23120541.00199-2024. eCollection 2024 Nov.

Evaluation of intranasal TLR2/6 agonist INNA-051: safety, tolerability and proof of pharmacology

Affiliations

Evaluation of intranasal TLR2/6 agonist INNA-051: safety, tolerability and proof of pharmacology

Francesca A Mercuri et al. ERJ Open Res. .

Abstract

Background: Local priming of the innate immune system with a Toll-like receptor (TLR)2/6 agonist may reduce morbidity and mortality associated with viral respiratory tract infections, particularly for the elderly and those with chronic diseases. The objectives of the present study were to understand the potential of prophylactic treatment with a TLR2/6 agonist as an enhancer of innate immunity pathways leading to accelerated respiratory virus clearance from the upper airways.

Methods: Two randomised, double-blind, placebo-controlled clinical trials were conducted in healthy adult participants. The first dose-escalation study assessed safety, tolerability and mechanistic biomarkers following single and repeated intranasal administrations of INNA-051. The second was an influenza A viral challenge study assessing the impact of treatment on host defence biomarkers and viral load.

Results: INNA-051 was well tolerated in both studies, with no dose-limiting toxicities identified. Mechanistic biomarkers assessed in both studies demonstrated the expected engagement of pharmacology, including innate immune pathways. There were lower than anticipated rates of infection. Post hoc analysis conducted in laboratory-confirmed infected participants with low or no antibody titre against the challenge virus showed INNA-051 treatment led to a significantly shorter duration of infection and increased expression of genes and pathways associated with host defence responses against influenza.

Conclusions: The safety and pharmacology profile of INNA-051 confirms preclinical studies. INNA-051 increased expression of genes and pathways associated with host defence responses against influenza and was associated with a shorter duration of infection. These studies support further clinical assessment in the context of natural viral respiratory tract infections in individuals at increased risk of severe illness.


Conflict of interest statement

Conflict of interest: F.A. Mercuri, C. Demaison and G. McLachlan are employees of ENA Respiratory Pty Ltd, and receive an annual salary and other benefits. In addition, they have shares and share options and are named inventors on numerous granted or pending patent applications controlled by ENA. Conflict of interest: H.A. McQuilten receives payments as a contract researcher from ENA Respiratory Pty Ltd. S. White, R. Tal-Singer, B.E. Miller and N. Kruger receive payments as paid consultants for ENA Respiratory Pty Ltd, and as part of their compensation have been awarded participation in the company share option plan. R. Tal-Singer is a retiree and shareholder of GSK, and reports personal fees from AstraZeneca, Roche, Vocalis Health, Teva, ImmunoMet, Renovion, Samay Health, GSK and ItayAndBeyond. Conflict of interest: S. Mynhardt, N.P. West, P. Zhang, C. Lemech and R. Hari receive payments to their institutions for carrying out research.

Figures
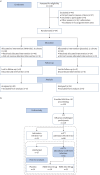
FIGURE 1
FIGURE 1
CONSORT diagrams. a) Healthy volunteer dose escalation study. Single ascending dose (SAD) and multiple ascending dose (MAD) pooled, with active or placebo as allocated interventions. b) Healthy volunteer influenza challenge study of infected modified intent-to-treat (mITT) and modified intent-to-treat – laboratory-confirmed infection (mITT-i) population included in post hoc analysis (full study population in the online supplementary material). HAI: haemagglutinin inhibition.
FIGURE 2
FIGURE 2
Nasal monocyte chemoattractant protein (MCP)-1 and macrophage inflammatory protein (MIP)-1α after treatment with INNA-051 or placebo in single ascending dose (SAD) and multiple ascending dose (MAD) cohorts 1–3. a–c) Participants in SAD study received a single dose of either 20, 60, 150, 300 or 600 μg of INNA-051 (n=6/cohort) or placebo (pooled placebos n=10). d–f) Participants in MAD study received 60, 150 or 300 μg of INNA-051 (n=6/cohort) or placebo (pooled placebos n=6) four treatment doses spaced 3 days apart. Nasal samples taken using Nasosorption FX-I devices at 6, 12, 24 and 48 h and 8 days post-final dose were analysed by MSD ELISA for nasal secretions of SAD cohorts b) MCP-1 and c) MIP-1α, or MAD cohorts e) MCP-1 and f) MIP-1α. Statistical analysis was performed on log10 transformed and baseline subtracted data by mixed-effects model (restricted maximum likelihood) with Dunnett's correction for comparisons to the placebo. *: p<0.05; **: p<0.01; ***: p<0.001; ****: p<0.0001.
FIGURE 3
FIGURE 3
Increased immune gene expression in nasal samples after each of four doses of INNA-051. a) Participants in INNA-051 300 μg multiple ascending dose (MAD) 3 cohort (n=6) and placebo (n=6) received four treatment doses spaced 3 days apart. Nasal samples were taken at baseline and at 8 and 48 h after each dose using Nasosorption FX-I devices. Immune gene expression analysis was performed using the NanoString Counter Human Pan Cancer Immune Profiling panel. b) Principal component analysis (PCA) of NanoString immune gene expression data from pre- and 8 h post-treatment placebo and INNA-051 MAD 300 μg cohorts. First two principal components of each sample with ellipses for each group are plotted. c) Pathway scores representing the first principal component of genes within immune pathways (x-axis) were calculated using the NanoString Pathway Module. d) Immune cell profiling using cell-specific gene co-expression patterns in MAD 2 (150 μg) and MAD 3 (300 μg) cohorts, showing inferred abundance of CD45+ expressing-immune cells. NK: natural killer; TLR: Toll-like receptor; TNF: tumour necrosis factor.
FIGURE 4
FIGURE 4
Genes from the Toll-like receptor signalling pathway remain differentially expressed 8 h post 4th dose in MAD cohorts. A KEGG (Kyoto encyclopaedia of genes and genomes) diagram is a computerised representation of a biological pathway and its components. Genes and gene families within the plot are represented within the Pan Cancer Immune Profile Panel shown in colour or are in grey. Genes and gene families known to be involved in the pathway but not represented within the panel are shown in white. Genes and gene families that are overexpressed in the KEGG pathway are shown in shades of orange (log2 fold-differences 0 to 2.5). Representative figure for MAD cohort 3 (300 mg dose) D-10 (8 h post-dose). Data on KEGG graph rendered in Pathview.
FIGURE 5
FIGURE 5
Post hoc analysis of influenza infection course in modified intent-to-treat – laboratory-confirmed infection (mITT-i) placebo and INNA-051 administration cohorts. a) Participants in influenza challenge study received two treatment doses of placebo (n=14), 150 μg (n=16) or 300 μg (n=21) of INNA-051 spaced 3 days apart then challenged with IAV 24 h after the second administration. Nasal samples were taken prior to challenge twice daily after day 1 post-challenge, to day 8 post-challenge using nasal swabs for measurement of viral RNA. b) Total duration of quantifiable viral RNA detection by quantitative real-time PCR in mITT-i population. c) Least squares mean viral RNA quantity for placebo and 300 μg INNA-051 mITT-i administration cohorts shown over time. Statistically significant differences (p<0.05) between cohorts as determined by the restricted maximum likelihood (REML) method and the Fisher's unadjusted least significant difference test are indicated. Error bars represent standard deviation. d) As a sensitivity analysis, the estimated difference in least squares mean viral RNA quantity in the INNA-051 300 µg mITT-i cohort compared to placebo mITT-i cohort was determined with p-values adjusted by the Dunnett–Hsu method to account for multiple comparisons (indicated where p<0.05). Error bars represent 95% CI. b) INNA-051 150 µg and 300 µg mITT-i administration cohorts were compared to placebo by Wilcoxon rank-sum test, with the Benjamini–Hochberg procedure used to adjust for multiple comparisons. Adjusted p-values are shown.
FIGURE 6
FIGURE 6
Heatmap of influenza response gene expression in nasal samples of modified intent-to-treat – laboratory-confirmed infection (mITT-i) participants from influenza challenge study. Nasosorption samples from mITT-i placebo (n=14), 150 μg (n=16) and 300 μg (n=21) INNA-051 treated participants were analysed for immune gene expression using the panCancer Immune NanoString panel on Day 1 prior to challenge (Day −1; after dose 2), and Days 1, 4 and 7 post-challenge. Genes in heatmap are those in the panel that are present in influenza KEGG pathway hsa05164, with the addition of TLR2, IFNL1 and IFNL2. Red–blue colour gradient represents Z-score across study participants of the normalised mRNA log count for each gene, with red indicating higher relative expression and blue lower relative expression. Genes are arranged by hierarchical clustering.
FIGURE 7
FIGURE 7
Antiviral gene induction by INNA-051 treatment and amplified type I and III interferon (IFN) in response to influenza infection in INNA-051 modified intent-to-treat – laboratory-confirmed infection (mITT-i cohort). a) Log2 normalised counts of type I and III IFN genes present in the panCancer Immune NanoString panel. b) Log2 normalised counts of antiviral genes IFITM1, IFITM2, ISG15, OAS3 and MX1. c) Expression of chemokine genes CCL2, CCL3, CCL20 and IRF3. Log2 normalised counts of indicated genes are represented for study participants from mITT-i placebo and INNA-051 300 μg groups at study day −1 (post-administration number 2, prior to challenge), and Days 1, 4 and 7 post-challenge (post-challenge time points have a shaded background). Placebo n=14; INNA-051 300 μg n=21. Asterisks indicate false discovery rates (FDR) <0.05: *: FDR <0.05; **: FDR <0.01; ***: FDR <0.001; ****: FDR <0.0001.

References

    1. Lee ARYB, Wong SY, Chai LYA, et al. . Efficacy of Covid-19 vaccines in immunocompromised patients: systematic review and meta-analysis. BMJ 2022; 376: e068632. doi:10.1136/bmj-2021-068632 - DOI - PMC - PubMed
    1. Hewitt R, Farne H, Ritchie A, et al. . The role of viral infections in exacerbations of chronic obstructive pulmonary disease and asthma. Ther Adv Respir Dis 2016; 10: 158–174. doi:10.1177/1753465815618113 - DOI - PMC - PubMed
    1. Bloom JD, Gong LI, Baltimore D. Permissive secondary mutations enable the evolution of influenza oseltamivir resistance. Science 2010; 328: 1272–1275. doi:10.1126/science.1187816 - DOI - PMC - PubMed
    1. Reece PA. Neuraminidase inhibitor resistance in influenza viruses. J Med Virol 2007; 79: 1577–1586. doi:10.1002/jmv.20951 - DOI - PubMed
    1. Lampejo T. Influenza and antiviral resistance: an overview. Eur J Clin Microbiol Infect Dis 2020; 39: 1201–1208. doi:10.1007/s10096-020-03840-9 - DOI - PMC - PubMed

LinkOut - more resources