. 2025 Mar 25;151(12):847-862.
doi: 10.1161/CIRCULATIONAHA.124.070563. Epub 2024 Dec 10.

Inositol 1,4,5-Trisphosphate Receptor 1 Gain-of-Function Increases the Risk for Cardiac Arrhythmias in Mice and Humans

Affiliations

Inositol 1,4,5-Trisphosphate Receptor 1 Gain-of-Function Increases the Risk for Cardiac Arrhythmias in Mice and Humans

Bo Sun et al. Circulation. .

Abstract

Background: Ca2+ mishandling in cardiac Purkinje cells is a well-known cause of cardiac arrhythmias. The Purkinje cell resident inositol 1,4,5-trisphosphate receptor 1 (ITPR1) is believed to play an important role in Ca2+ handling, and ITPR1 gain-of-function (GOF) has been implicated in cardiac arrhythmias. However, nearly all known disease-associated ITPR1 variants are loss-of-function and are primarily linked to neurological disorders. Whether ITPR1 GOF has pathological consequences, such as cardiac arrhythmias, is unclear. This study aimed to identify human ITPR1 GOF variants and determine the impact of ITPR1 GOF on Ca2+ handling and arrhythmia susceptibility.

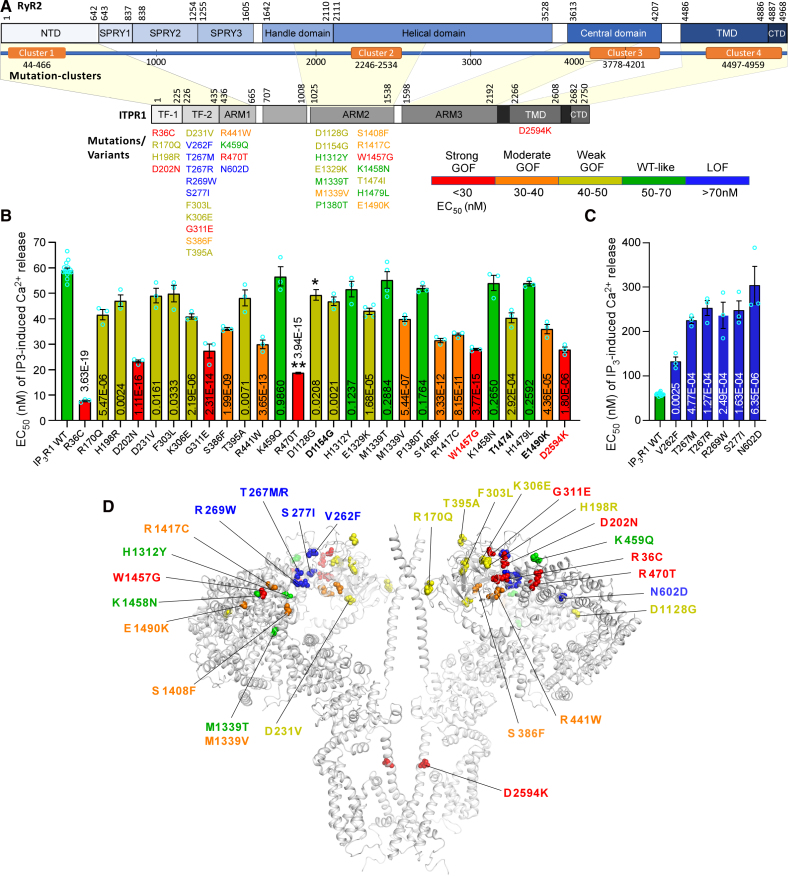
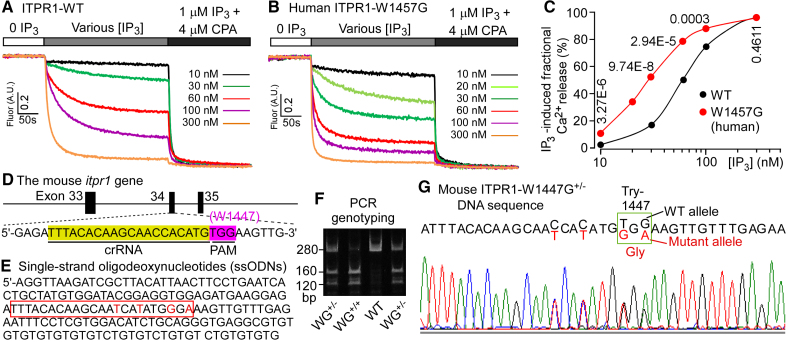
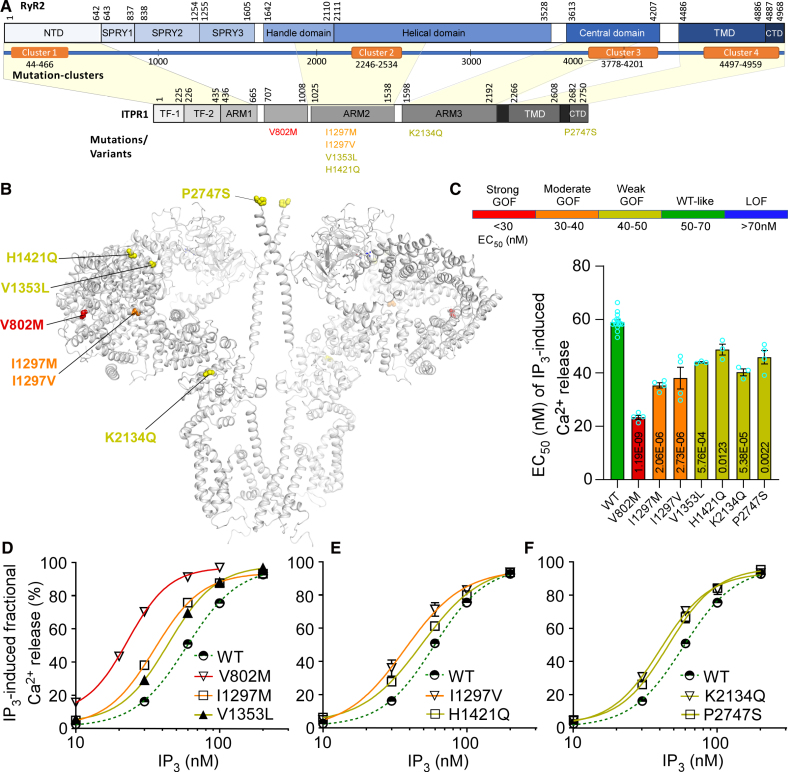
Methods: There are a large number of rare ITPR1 missense variants reported in open data repositories. Based on their locations in the ITPR1 channel structure, we selected and characterized 33 human ITPR1 missense variants from open databases and identified 21 human ITPR1 GOF variants. We generated a mouse model carrying a human ITPR1 GOF variant, ITPR1-W1457G (W1447G in mice).

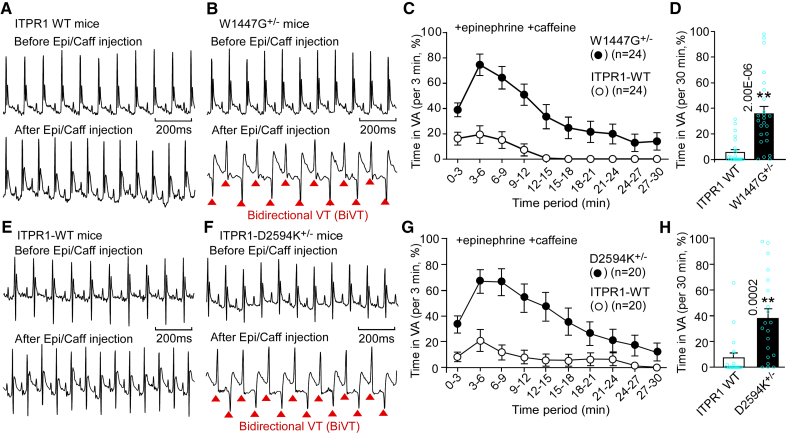
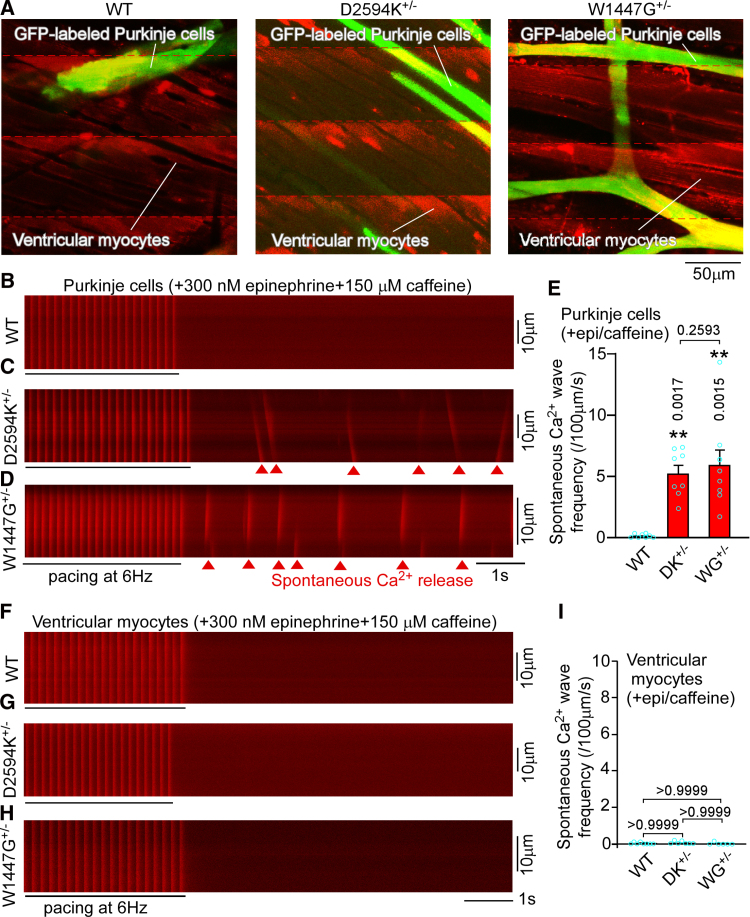
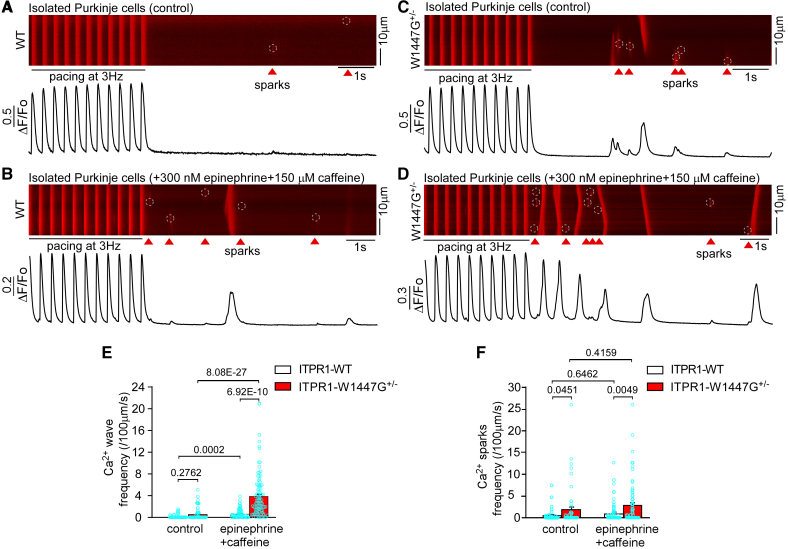
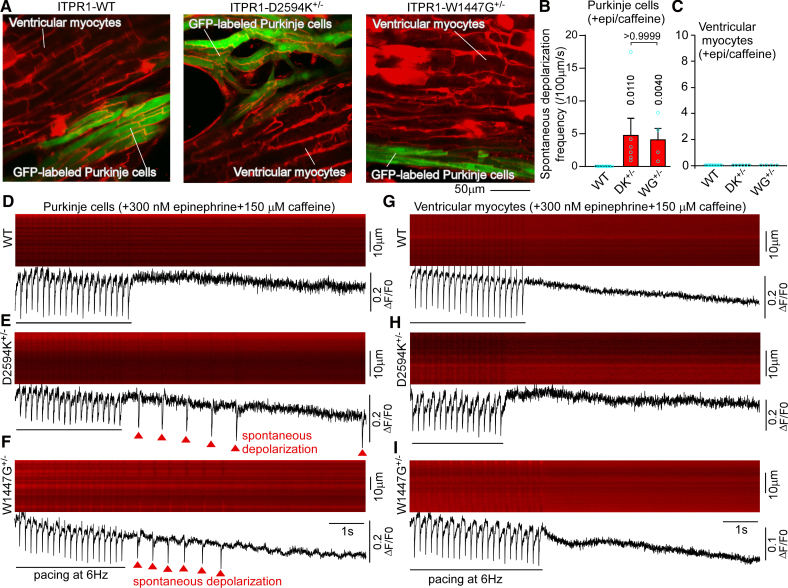
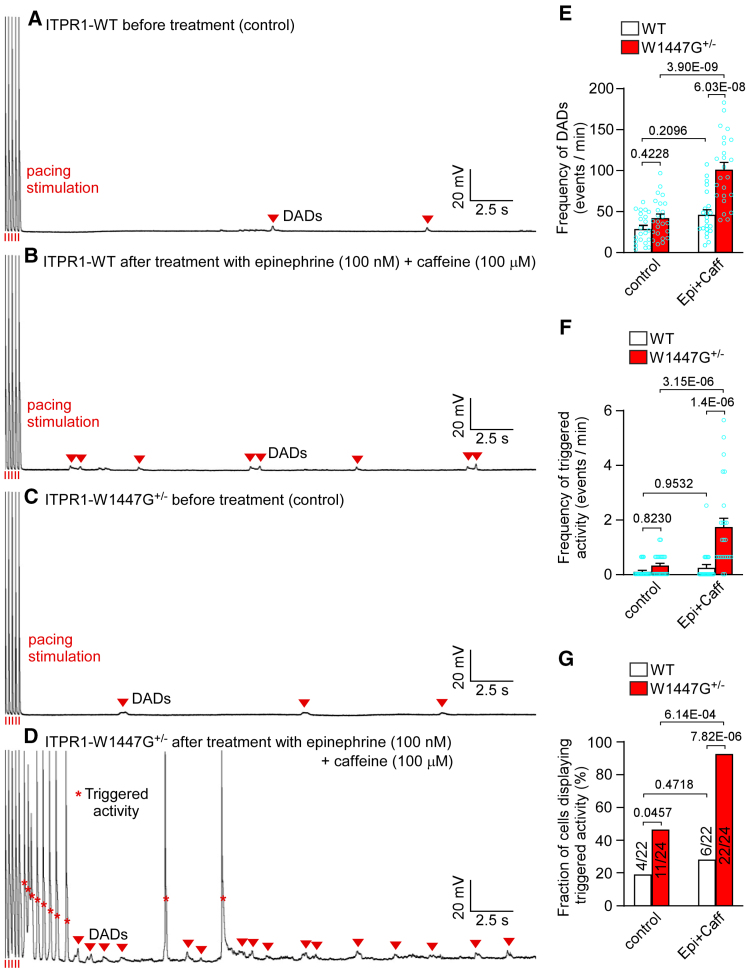
Results: We showed that the ITPR1-W1447G+/- and recently reported ITPR1-D2594K+/- GOF mutant mice were susceptible to stress-induced ventricular arrhythmias. Confocal Ca2+ and voltage imaging in situ in heart slices and Ca2+ imaging and patch-clamp recordings of isolated Purkinje cells showed that ITPR1-W1447G+/- and ITPR1-D2594K+/- variants increased the occurrence of stress-induced spontaneous Ca2+ release, delayed afterdepolarization, and triggered activity in Purkinje cells. To assess the potential role of ITPR1 variants in arrhythmia susceptibility in humans, we looked up a gene-based association study in the UK Biobank data set and identified 7 rare ITPR1 missense variants showing potential association with cardiac arrhythmias. Remarkably, in vitro functional characterization revealed that all these 7 ITPR1 variants resulted in GOF.

Conclusions: Our studies in mice and humans reveal that enhanced function of ITPR1, a well-known movement disorder gene, increases the risk for cardiac arrhythmias.

Keywords: Purkinje cells; cardiac ryanodine receptor; inositol 1,4,5-trisphosphate receptor; sarcoplasmic reticulum; spontaneous Ca2+ release; triggered activity; ventricular arrhythmias.


Conflict of interest statement

None.

Figures

Figure 1.
Figure 1.
Identification, location, and in vitro functional characterization of human ITPR1 variants. A, Schematic diagram of the linear sequences of RyR2 and ITPR1. Major domains of RyR2 are shown as solid blue boxes. The orange boxes indicate 4 disease-associated mutation clusters (hotspots) of RyR2. Major domains of ITPR1 are shown as solid gray/black boxes. The corresponding homologous regions of ITPR1 and RyR2 are indicated by yellow-shaded areas. Human ITPR1 variants characterized are grouped under domains they reside in and are color-coded as those shown in B and C. B and C, EC50 values of IP3 induced Ca2+ release in HEK293 cells expressing ITPR1 WT or mutants with the range of EC50 values color-coded. Data shown are mean±SEM (n=3 or 4; 1-way ANOVA with Dunnett post hoc test for obtaining P values shown in B and C). Three ITPR1 variants, D1154G, T1474I, and E1490K, are also present in the UK Biobank. D, Locations of ITPR1 variants in the 3-dimensional structure of ITPR1 (PDB: 6MU2). The ITPR1-D2594K mutation was generated in our structure-function relationship analysis of the channel pore (not a human variant). The 3-dimensional structural locations of ITPR1 variants, D1154G, E1329K, P1380T, T1474I, and H1479L, have not been resolved and thus were not shown in the 3-dimensional structure (D). GOF indicates gain-of-function; and LOF, loss-of-function.
Figure 2.
Figure 2.
Generation of ITPR1-W1447G+/- GOF mutant knock-in mice. HEK293 cells expressing ITPR1-WT (A) and the human ITPR1-W1457G mutant (B) were transfected with an ER luminal fluorescent Ca2+-sensing protein, G-CEPIA1er. Representative traces of ER Ca2+ (G-CEPIA1er) signals at baseline (0 IP3), after addition of different concentrations of IP3 (10–300 nM), and after addition of 1 μM IP3 plus 4 μM CPA are shown. C, The dose-response curves of IP3-induced fractional Ca2+ release in ITPR1 WT and ITPR1-W1457G mutant cells were determined by measuring the signal drop in ER Ca2+ level after a given IP3 dose and normalized to the total ER Ca2+ store (the drop in ER Ca2+ level after addition of 1 μM IP3 plus 4 μM CPA). Data shown are mean±SEM (n=3; 1-way ANOVA with Dunnett post hoc test for obtaining P values shown in C). D, Location of residue ITPR1-W1447 in exon 34 of the mouse itpr1 gene and the crRNA and PAM sequences used for the CRISPR-mediated mutagenesis of the IP3R1-W1447G mutation. E, Sequence of the single-strand oligodeoxynucleotides (ssODNs) used for homologous DNA repair. F, Genotyping of the ITPR1-W1447G mutant allele using PCR. G, Confirmation of the W1447G+/- mutation in heterozygous mouse samples by DNA sequencing.
Figure 3.
Figure 3.
ITPR1 GOF increases the susceptibility to stress-induced VAs in mice. Representative ECG recordings of WT (A) and W1447G+/- (human W1457G) mutant (B) mice before and after injection of epinephrine (1.6 mg/kg) and caffeine (120 mg/kg). VA duration (%) in WT and W1447G+/- mice within each 3-minute (C) or 30-minute (D) period of ECG recordings. Data shown are mean±SEM (n=24 for WT, and 24 for W1447G+/-; Mann-Whitney U test for obtaining P values shown in D). Representative ECG recordings of ITPR1-WT (E) and ITPR1-D2594K+/- (F) mice before and after injection of epinephrine (1.6 mg/kg) and caffeine (120 mg/kg). VA duration (%) in ITPR1-WT and ITPR1-D2594K+/- mice within each 3-minute (G) or 30-minute (H) period of ECG recordings. Data shown are mean±SEM (n=20 for ITPR1-WT and 20 for ITPR1-D2594K+/-; Mann-Whitney U test for obtaining P values shown in H). Bidirectional ventricular tachycardias (BiVTs) displaying beat-to-beat alternations in QRS morphology and axis are indicated by red arrowheads.
Figure 4.
Figure 4.
ITPR1 GOF variants increase spontaneous Ca2+ release in Purkinje fibers but not in ventricular myocytes in heart slices. Confocal x-y images of Cntn2-GFP/ITPR1-WT (left), Cntn2-GFP/ITPR1-D2594K+/- (middle), and Cntn2-GFP/ITPR1-W1447G+/- (right) mouse heart slices loaded with Rhod-2 AM, showing the GFP-labeled Purkinje fibers and Rhod-2 AM–loaded Purkinje fibers and ventricular myocytes (A). The red dashed lines indicate the occurrence of pacing-induced Ca2+ transients. Heart slices were perfused with 300 nM epinephrine and 150 µM caffeine. Ca2+ dynamics (Rhod-2 signals) in ITPR1-WT (B), ITPR1-D2594K+/- (C), and ITPR1-W1447G+/- (D) Cntn2-GFP–labeled Purkinje fibers and in ITPR1-WT (F), ITPR1-D2594K+/- (G), and ITPR1-W1447G+/- (H) ventricular myocytes were recorded using line-scanning confocal imaging during electrical field stimulation (6 Hz; indicated by a black line) and after the cessation of stimulation. Frequency of spontaneous Ca2+ waves in ITPR1-WT, ITPR1-D2594K+/-, and ITPR1-W1447G+/- Cntn2-GFP–labeled Purkinje fibers (E) and ventricular myocytes (I) in the presence of epinephrine and caffeine. Data shown are mean±SEM (n=8 hearts for ITPR1-WT, 8 hearts for ITPR1-D2594K+/-, and 9 hearts for ITPR1-W1447G+/-; Kruskal-Wallis test with Dunn post hoc test for obtaining the adjusted P values shown in E and I).
Figure 5.
Figure 5.
The ITPR1-W1447G+/- GOF variant increases the propensity for spontaneous Ca2+ release in isolated Purkinje cells. Representative line-scan Ca2+ images of isolated Cntn2-GFP–labeled ITPR1-WT Purkinje cells before (A) and after the treatment of 300 nM epinephrine plus 150 μM caffeine (B) or isolated Cntn2-GFP–labeled ITPR1-W1447G+/- Purkinje cells before (C) and after the treatment of 300 nM epinephrine plus 150 μM caffeine (D) during electrical field stimulation (3 Hz; indicated by a black line) and after the cessation of stimulation. The frequency of spontaneous Ca2+ waves (E) and Ca2+ sparks (F) in isolated Cntn2-GFP/ITPR1-WT and Cntn2-GFP/ITPR1-W1447G+/- Purkinje cells in the control condition or in the presence of epinephrine and caffeine. Red arrowheads and white dashed line circles indicate the occurrence of spontaneous Ca2+ sparks. Data shown are mean±SEM (for ITPR1-WT, n=73 Purkinje cells in the control condition, and n=70 cells in the presence of epinephrine and caffeine from 9 hearts; for ITPR1-W1447G+/-, n=66 Purkinje cells in the control condition and n=88 cells in the presence of epinephrine and caffeine from 9 hearts; Kruskal-Wallis test with Dunn post hoc test for obtaining the adjusted P values shown in E and F).
Figure 6.
Figure 6.
ITPR1 GOF variants enhance spontaneous depolarizations in Purkinje cells but not in ventricular myocytes in heart slices. Confocal x-y images of Cntn2-GFP/ITPR1-WT (left), Cntn2-GFP/ITPR1-D2594K+/- (middle), and Cntn2-GFP/ITPR1-W1447G+/- (right) mouse heart slices loaded with RH237 voltage-sensing dye, showing the GFP-labeled Purkinje cells and RH237-loaded Purkinje cells and ventricular myocytes (A). Heart slices were perfused with 300 nM epinephrine plus 150 µM caffeine. The RH237 signals (membrane potential) in ITPR1-WT (D), ITPR1-D2594K+/- (E), and ITPR1-W1447G+/- (F) Cntn2-GFP–labeled Purkinje cells and in ITPR1-WT (G), ITPR1-D2594K+/- (H), and ITPR1-W1447G+/- (I) ventricular myocytes were recorded using line-scanning confocal imaging during electrical field stimulation (6 Hz; indicated by a black line) and after the cessation of stimulation. Frequency of spontaneous membrane depolarizations in ITPR1-WT, ITPR1-D2594K+/-, and ITPR1-W1447G+/- Cntn2-GFP–labeled Purkinje cells (B) and ventricular myocytes (C) in the presence of epinephrine and caffeine. The trace underneath each RH237 line-scan image represents the average intensity of the RH237 fluorescence signal along the entire scan-line. Data shown are mean±SEM (n=11 hearts for ITPR1-WT, 6 hearts for ITPR1-D2594K+/-, and 4 hearts for ITPR1-W1447G+/-; Kruskal-Wallis test with Dunn post hoc test for obtaining the adjusted P values shown in B and C).
Figure 7.
Figure 7.
The ITPR1-W1447G+/- GOF variant enhances triggered activity in isolated Purkinje cells. Membrane potentials in Cntn2-GFP/ITPR1-WT Purkinje cells before (A) and after the treatment of epinephrine and caffeine (B) or in Cntn2-GFP/ITPR1-W1447G+/- Purkinje cells before (C) and after the treatment of epinephrine and caffeine (D) were recorded using whole cell patch-clamp recordings in the current clamp mode. E, The frequency of delayed afterdepolarizations (DADs), (F) the frequency of triggered activity, and (G) the fraction of cells displaying triggered activity in Cntn2-GFP/ITPR1-WT and Cntn2-GFP/ITPR1-W1447G+/- Purkinje cells before (control) and after epinephrine and caffeine treatment. Red arrowheads indicate the presence of DADs, red asterisks triggered activity, and red vertical bars pacing stimulations. Data shown are mean±SEM (n=22 cells from 7 ITPR1-WT hearts, n=24 cells from 8 ITPR1-W1447G+/- hearts; 2-way ANOVA with Tukey post hoc test was performed for obtaining P values shown in E and F and x2 test for determining P values shown in G).
Figure 8.
Figure 8.
Human ITPR1 variants associated with increased risk for cardiac arrhythmias increase the sensitivity of ITPR1 to activation by IP3. A, A schematic diagram of the linear sequences of RyR2 and ITPR1. Major domains of RyR2 are shown as solid blue boxes. The orange boxes indicate 4 disease-associated variant clusters (hotspots) of RyR2. Major domains of ITPR1 are shown as solid gray/black boxes. The corresponding homologous regions of ITPR1 and RyR2 are Indicated by yellow-shaded areas. Human ITPR1 variants characterized are grouped under domains they reside in and are color-coded as those shown in C. B, Locations of ITPR1 variants in the 3-dimensional structure of ITPR1 (PDB: 6MU2). C, EC50 values of IP3 induced Ca2+ release in HEK293 cells expressing ITPR1 WT or variants with the range of EC50 values color-coded. Data shown are mean±SEM (n=3 or 4; 1-way ANOVA with Dunnett post hoc test for obtaining P values shown in C). D through F, The dose-response curves of IP3-induced fractional Ca2+ release in HEK293 cells expressing ITPR1 WT, V802M, I1297M, and V1353L (D), I1297V and H1421Q (E), and K2134Q and P2747S (F) were determined by measuring the signal drop in ER Ca2+ level after a given IP3 dose and normalized to the total ER Ca2+ store (the drop in ER Ca2+ level after addition of 1 μM IP3 plus 4 μM CPA). Data shown are mean±SEM (n=3 or 4). GOF indicates gain-of-function; and LOF, loss-of-function.

Similar articles

References

    1. Patel S, Joseph SK, Thomas AP. Molecular properties of inositol 1,4,5-trisphosphate receptors. Cell Calcium. 1999;25:247–264. doi: 10.1054/ceca.1999.0021 - PubMed
    1. Stathopulos PB, Seo MD, Enomoto M, Amador FJ, Ishiyama N, Ikura M. Themes and variations in ER/SR calcium release channels: structure and function. Physiology (Bethesda). 2012;27:331–342. doi: 10.1152/physiol.00013.2012 - PubMed
    1. Parys JB, De Smedt H. Inositol 1,4,5-trisphosphate and its receptors. Adv Exp Med Biol. 2012;740:255–279. doi: 10.1007/978-94-007-2888-2_11 - PubMed
    1. Berridge MJ. The inositol trisphosphate/calcium signaling pathway in health and disease. Physiol Rev. 2016;96:1261–1296. doi: 10.1152/physrev.00006.2016 - PubMed
    1. Berridge MJ. Inositol trisphosphate and calcium signalling mechanisms. Biochim Biophys Acta. 2009;1793:933–940. doi: 10.1016/j.bbamcr.2008.10.005 - PubMed