. 2024 Dec 2;13(12):11.
doi: 10.1167/tvst.13.12.11.

Quantifying the Corneal Nerve Whorl Pattern

Affiliations

Quantifying the Corneal Nerve Whorl Pattern

Maryse Lapierre-Landry et al. Transl Vis Sci Technol. .

Abstract

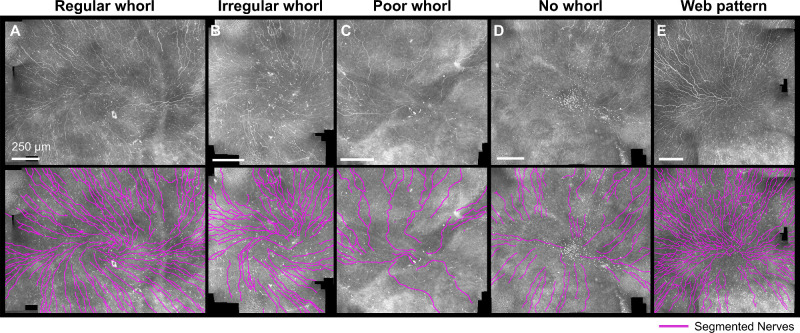
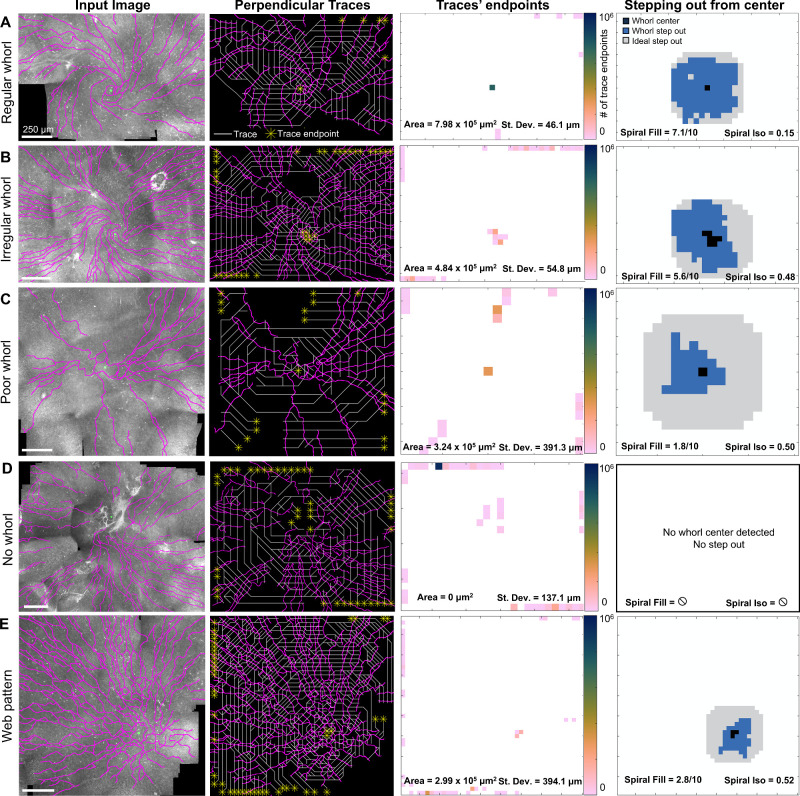
Purpose: The corneal nerves within the sub-basal nerve plexus (SBNP) display a distinctive whorl-like pattern, a highly dynamic structure that could be a marker of diseases. Previous studies have reported a decrease in whorl nerve density in patients with diabetes, indicating an avenue for noninvasive monitoring of diabetic neuropathy. However, conflicting results have since been reported, highlighting the need for improved quantitative analysis of the corneal whorl. We present an automated algorithm to characterize the whorl shape and test the hypothesis that the whorl organization is affected by diabetic neuropathy.

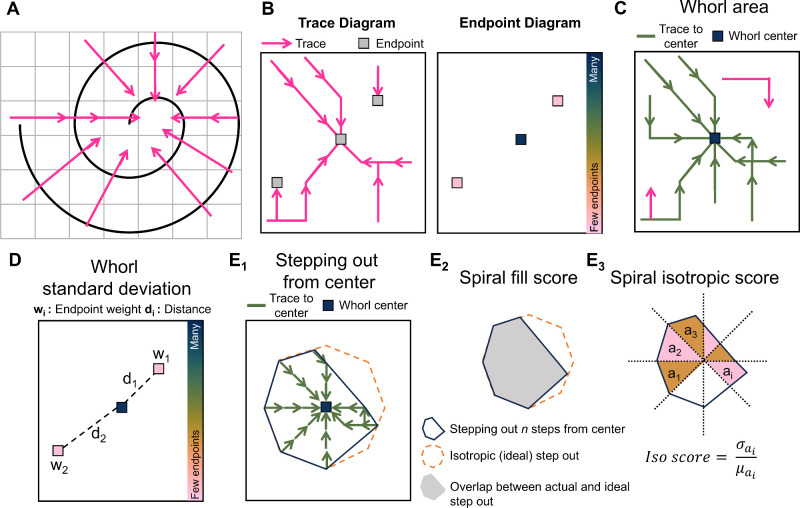
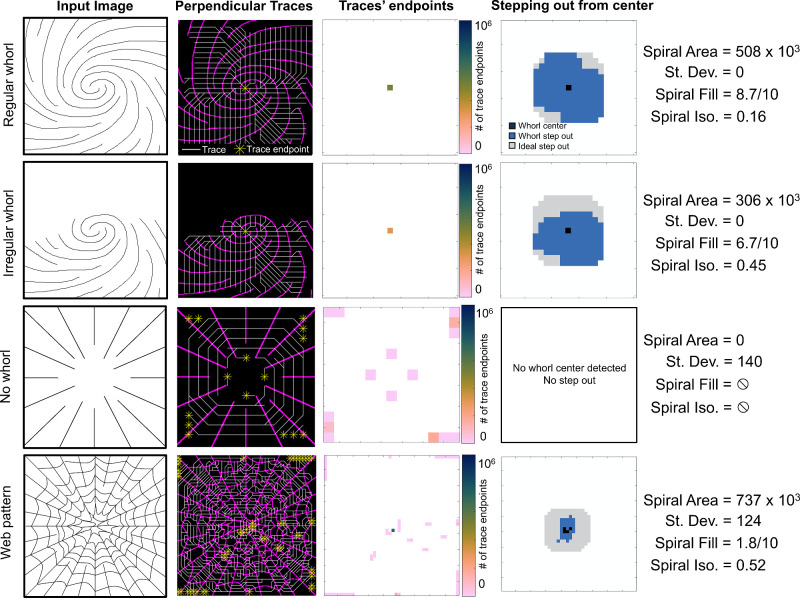
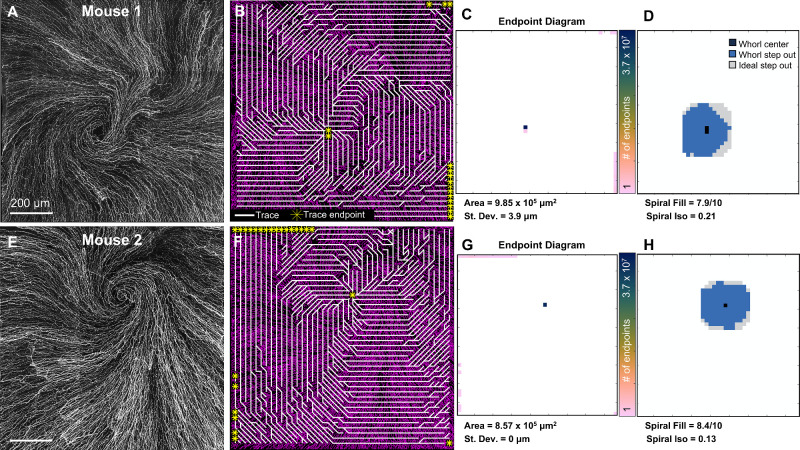
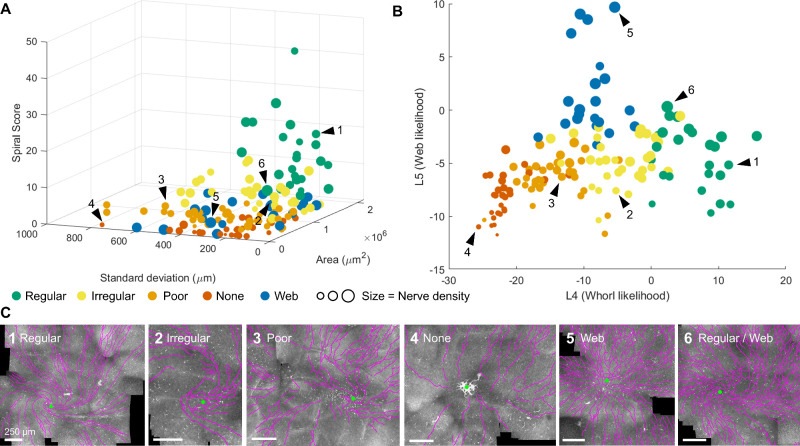
Methods: The SBNP whorl was analyzed as a vector field, from which seven whorl metrics were calculated. The efficacy of these whorl metrics was demonstrated in synthetic images, ex vivo mouse corneas, and in a publicly available dataset of wide-field in vivo confocal microscopy (IVCM) images of diabetic and control subjects. Linear discriminant analysis and the Peacock test were used to test for statistical differences. Our analysis code is made freely available.

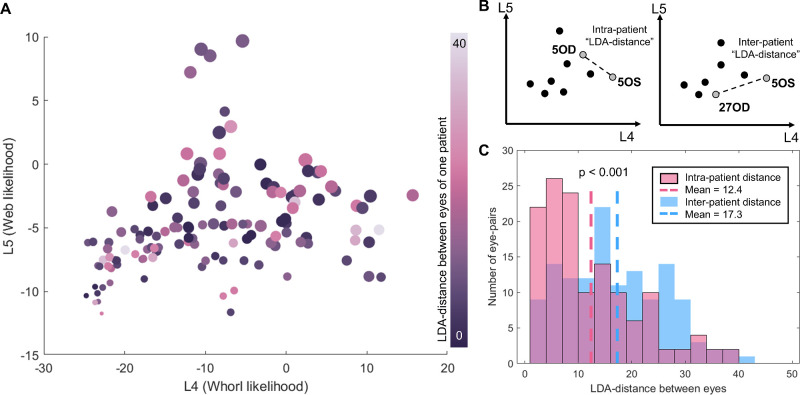
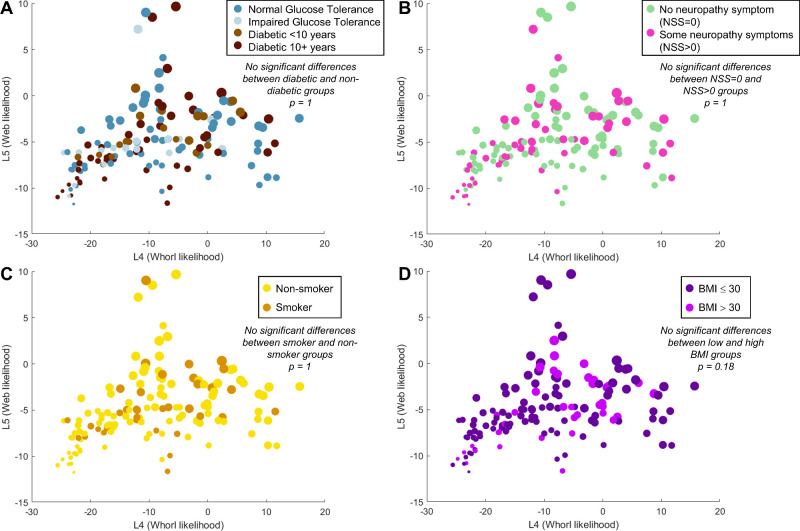
Results: Using our whorl metrics, we were able to quantify different whorl patterns in our patient population and statistically compare cohorts. We determined that whorl patterns tend to present bilaterally in patients (P < 0.001), but there were no significant differences between whorl patterns in patients with diabetes and control subjects, nor between patients with or without neuropathy symptoms.

Conclusions: We present a generalizable framework to statistically compare corneal nerve patterns in cohorts of patients.

Translational relevance: SBNP whorl patterns could serve as a noninvasive marker for ocular diseases, whereas few quantitative IVCM endpoints have been identified to date.


Conflict of interest statement

Disclosure: M. Lapierre-Landry, None; E. Lu, None; M. McPheeters, None; M.A.K. Widjaja-Adhi, None; D.L. Wilson, None; R.R. Sayegh, None; P.R.Taylor, None; M. Golczak, None; M.W. Jenkins, None

Figures

Figure 1.
Figure 1.
The diverse appearance of the whorl area in IVCM images. Representative wide-field IVCM images acquired in human subjects (top row) with nerves segmented (bottom row) for different whorl patterns qualitatively labeled as regular whorl, irregular whorl, poor whorl, no whorl, and a web-like non-spiraling pattern. Original images from Ref. .
Figure 2.
Figure 2.
Analyzing the corneal whorl pattern using whorl metrics. (A) Perpendicular vectors point toward the center of a spiral. (B) Creating traces by connecting the vectors and recording where traces end in the endpoint diagram. (C) The whorl area is the total image area that is connected by a trace to the whorl center. (D) The whorl standard deviation is calculated based on the distances (di) of each endpoint (with area wi) with respect to the whorl center. (E) By following traces for n step outward from the center, the step-out area (E1, blue) is compared to the ideal isotropic step-out (E1, orange). The spiral fill score (E2) is the overlap between the actual and ideal step-out. The spiral isotropic score (E3) is the coefficient of variance calculated from 45 degree slices with area ai of the step-out.
Figure 3.
Figure 3.
Demonstration of whorl metrics on synthetic images of common nerve patterns. Traces (white) are drawn perpendicular to the nerves (magenta) and ending at endpoints (yellow). The number of endpoints at each location is used to calculate the spiral area and standard deviation. The whorl step-out is compared to the ideal (isotropic) step-out to calculate the spiral fill and spiral isotropic scores. For all images, patch size is proportional to the average distance between nerves.
Figure 4.
Figure 4.
Whorl metrics in the mouse cornea. (A) Ex vivo confocal image of the sub-basal nerve whorl in a mouse. (B) Perpendicular traces (white) tend to have endpoints (yellow) at the center of the whorl. (C) Endpoint diagram displaying the number of trace endpoints at each location from which the whorl area and standard deviation are calculated. (D) Step-out diagram from which the spiral fill and spiral isotropic scores are calculated. (E) Whorl metrics calculated in a second mouse with (F) trace diagram, (G) endpoint diagram, and (H) step-out diagram. Size of the depicted field-of-view is the same for all visualizations on the same row.
Figure 5.
Figure 5.
Whorl metrics to quantify nerve patterns in human IVCM images, with typical results for (A) a regular whorl, (B) an irregular whorl, (C) a poor whorl shape, (D) no whorl visible, and (E) a high nerve-density, non-rotational web pattern. Segmented nerves (magenta) with manually identified whorl convergence points (green circles). Perpendicular traces (white) with trace endpoints (yellow stars). The endpoints diagram reports the number of endpoints at each image location from which the whorl area and standard deviation were calculated. The stepping out from the center operation follows all traces for five patches starting from the center and is compared to an ideal isotropic step-out to calculate the spiral fill score and the spiral isotropic score.
Figure 6.
Figure 6.
Multi-dimensional representation of the whorl metrics. (A) All 145 human corneas represented as a function of their whorl area, whorl standard deviation, spiral score, and nerve density (marker size). (B) All corneas as a function of a linear combinations of all whorl metrics obtained from linear discriminant analysis (LDA). L4 = 2.7 * nArea − 1.03 * nStDev + 1.08 * nDens + 6.4 * nSpF − 2.6 * nSpI + 0.6 * nSp + 9.5 * nIsoEnd − 9.7; L5 = 0.9 * nArea − 0.3 * nStDev + 3.0 * nDens − 3.5 * nSpF + 0.8 * nSpI + 2.2 * nSp + 9.0 * nIsoEnd − 5.1, with nArea, normalized whorl area; nStDev, normalized standard deviation; nDens, normalized density; nSpF, normalized spiral fill score; nSpI, normalized spiral isotropic score; nSp, normalized spiral score; nIsoEnd, normalized isotropic endpoint score. (C) Example IVCM images with segmented nerves (magenta) and whorl convergence point (green dot). The location of the example images 1 through 6 are indicated by black arrow heads in A and B.
Figure 7.
Figure 7.
Similarities of the whorl pattern between eyes. (A) Distance between eyes on the LDA graph for 67 patients where both eyes were available for analysis. (B) The intra-patient LDA distance is defined as the distance between both eyes of one patient, whereas the inter-patient LDA distance is between two eyes belonging to different patients. (C) The intra-patient distances for 67 patients are significantly smaller than the inter-patient distance tested on random combinations of the same 67 eye pairs. P < 0.001 Student t-test.
Figure 8.
Figure 8.
Testing for significant differences in whorl shape amongst patient populations. (A) Whorl shape distribution on the LDA graph based on diabetic status. No statistical differences as per the Peacock's test (P = 1). (B) No statistical differences in whorl shapes based on the neuropathy symptom score (NSS; Peacock's test P = 1). (C) No statistical differences in whorl shapes based on smoking status (Peacock's test P = 1). (D) No statistical differences based on subject's body-mass index (BMI) being within obesity range (Peacock's test P = 0.18).

References

    1. Shaheen BS, Bakir M, Jain S.. Corneal nerves in health and disease. Surv Ophthalmol. 2014; 59(3): 263–285. - PMC - PubMed
    1. Al-Aqaba MA, Dhillon VK, Mohammed I, Said DG, Dua HS.. Corneal nerves in health and disease. Prog Retin Eye Res. 2019; 73: 100762. - PubMed
    1. Chen Y, Wang S, Alemi H, Dohlman T, Dana R.. Immune regulation of the ocular surface. Exp Eye Res. 2022; 218: 109007. - PMC - PubMed
    1. Patel DV, McGhee CNJ.. Mapping of the normal human corneal sub-basal nerve plexus by in vivo laser scanning confocal microscopy. Invest Ophthalmol Vis Sci. 2005; 46(12): 4485–4488. - PubMed
    1. Patel DV, McGhee CNJ. In vivo laser scanning confocal microscopy confirms that the human corneal sub-basal nerve plexus is a highly dynamic structure. Invest Ophthalmol Vis Sci. 2008; 49(8): 3409–3412. - PubMed

Publication types