Cells in the Polyaneuploid Cancer Cell State Are Prometastatic
- PMID: 39656186
- PMCID: PMC11873732
- DOI: 10.1158/1541-7786.MCR-24-0689
Cells in the Polyaneuploid Cancer Cell State Are Prometastatic
Abstract
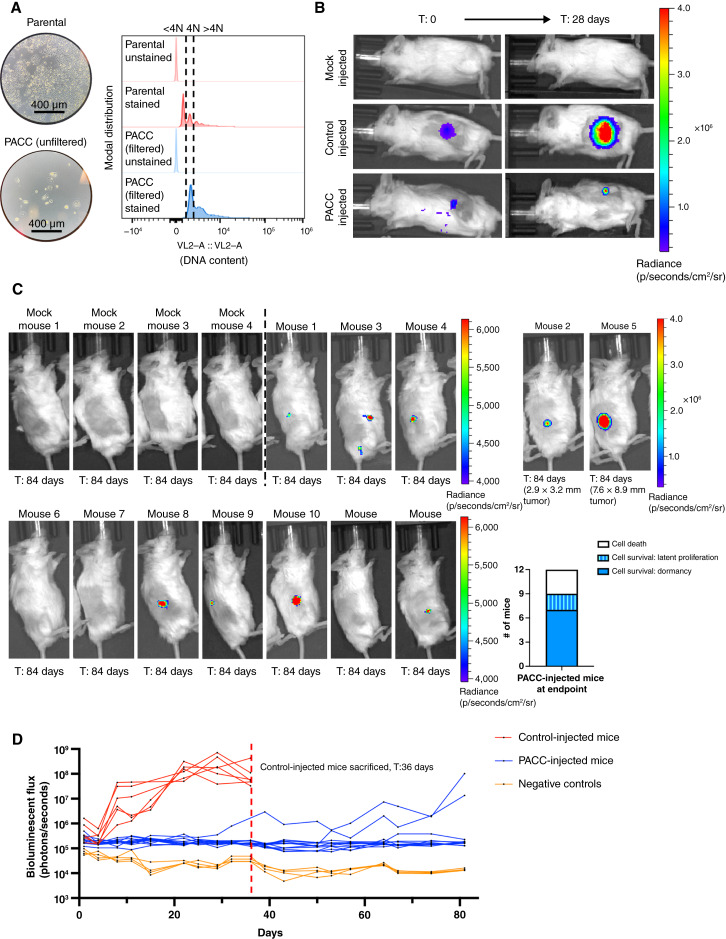
Our research aims to understand the adaptive-ergo potentially metastatic-responses of prostate cancer to changing microenvironments. Emerging evidence implicates a role of the polyaneuploid cancer cell (PACC) state in metastasis, positing the PACC state as capable of conferring metastatic competency. Mounting in vitro evidence supports increased metastatic potential of cells in the PACC state. Additionally, our recent retrospective study revealed that PACC presence in patient prostate tumors at the time of radical prostatectomy was predictive of future metastasis. To test for a causative relationship between PACC state biology and metastasis in prostate cancer, we leveraged a novel method designed for flow cytometric detection of circulating tumor cells (CTC) and disseminated tumor cells (DTC) from animal models. This approach provides both quantitative and qualitative information about the number and PACC status of recovered CTCs and DTCs. Specifically, we applied this approach to the analysis of subcutaneous, caudal artery, and intracardiac murine models. Collating data from all models, we found that 74% of recovered CTCs and DTCs were in the PACC state. Furthermore, in vivo colonization assays proved that PACC populations can regain proliferative capacity at metastatic sites. Additional in vitro analyses revealed a PACC-specific partial epithelial-to-mesenchymal transition phenotype and a prometastatic secretory profile, together providing preliminary evidence of prometastatic mechanisms specific to the PACC state. Implications: Considering that many anticancer agents induce the PACC state, our data position the increased metastatic competency of PACC state cells as an important unforeseen ramification of neoadjuvant regimens, which may help explain clinical correlations between chemotherapy and metastatic progression.
©2024 The Authors; Published by the American Association for Cancer Research.
Conflict of interest statement
A.J. Zurita reports grants from Pfizer Astellas, and ABX and other support from Merck, Clarity, Curium, and Fusion outside the submitted work. J. Hicks reports partial support from the Breast Cancer Research Foundation (nonprofit). K.J. Pienta reports grants from NIH NCI and the Prostate Cancer Foundation, support from Keystone Biopharma, Inc. during the conduct of the study, as well as other support from Kreftect, Inc. outside the submitted work. S.R. Amend reports grants from the Department of Defense, and the Prostate Cancer Foundation during the conduct of the study, as well as other support from Keystone Biopharma outside the submitted work. No disclosures were reported by the other authors.
Figures


Update of
-
Cells in the Polyaneuploid Cancer Cell State are Pro-Metastatic.bioRxiv [Preprint]. 2024 Jul 16:2024.07.12.603285. doi: 10.1101/2024.07.12.603285. bioRxiv. 2024. Update in: Mol Cancer Res. 2025 Mar 03;23(3):219-235. doi: 10.1158/1541-7786.MCR-24-0689. PMID: 39071340 Free PMC article. Updated. Preprint.
Similar articles
-
Cells in the Polyaneuploid Cancer Cell State are Pro-Metastatic.bioRxiv [Preprint]. 2024 Jul 16:2024.07.12.603285. doi: 10.1101/2024.07.12.603285. bioRxiv. 2024. Update in: Mol Cancer Res. 2025 Mar 03;23(3):219-235. doi: 10.1158/1541-7786.MCR-24-0689. PMID: 39071340 Free PMC article. Updated. Preprint.
-
Epithelial-to-mesenchymal transition leads to disease-stage differences in circulating tumor cell detection and metastasis in pre-clinical models of prostate cancer.Oncotarget. 2016 Nov 15;7(46):76125-76139. doi: 10.18632/oncotarget.12682. Oncotarget. 2016. PMID: 27764810 Free PMC article.
-
Presence of cells in the polyaneuploid cancer cell (PACC) state predicts the risk of recurrence in prostate cancer.Prostate. 2023 Feb;83(3):277-285. doi: 10.1002/pros.24459. Epub 2022 Nov 13. Prostate. 2023. PMID: 36372998 Free PMC article.
-
Circulating and disseminated tumor cells: harbingers or initiators of metastasis?Mol Oncol. 2017 Jan;11(1):40-61. doi: 10.1002/1878-0261.12022. Mol Oncol. 2017. PMID: 28085223 Free PMC article. Review.
-
Biology and significance of circulating and disseminated tumour cells in colorectal cancer.Langenbecks Arch Surg. 2012 Apr;397(4):535-42. doi: 10.1007/s00423-012-0917-9. Epub 2012 Feb 15. Langenbecks Arch Surg. 2012. PMID: 22350614 Review.
Cited by
-
Oncogenic signaling in the Drosophila prostate-like accessory gland activates a pro-tumorigenic program in the absence of proliferation.Dis Model Mech. 2025 Apr 1;18(4):dmm052001. doi: 10.1242/dmm.052001. Epub 2025 Apr 30. Dis Model Mech. 2025. PMID: 40304035 Free PMC article.
-
Single-Cell Proteomic Characterization of Drug-Resistant Prostate Cancer Cells Reveals Molecular Signatures Associated with Morphological Changes.Mol Cell Proteomics. 2025 Apr;24(4):100949. doi: 10.1016/j.mcpro.2025.100949. Epub 2025 Mar 14. Mol Cell Proteomics. 2025. PMID: 40090465 Free PMC article.
References
-
- Fidler IJ. The pathogenesis of cancer metastasis: the ‘seed and soil’ hypothesis revisited. Nat Rev Cancer 2003;3:453–8. - PubMed
MeSH terms
Grants and funding
LinkOut - more resources
Full Text Sources
Medical