. 2025 Feb;399(2):247-265.
doi: 10.1007/s00441-024-03932-4. Epub 2024 Dec 10.

TNBS colitis induces architectural changes and alpha-synuclein overexpression in mouse distal colon: A morphological study

Affiliations

TNBS colitis induces architectural changes and alpha-synuclein overexpression in mouse distal colon: A morphological study

Arianna Casini et al. Cell Tissue Res. 2025 Feb.

Abstract

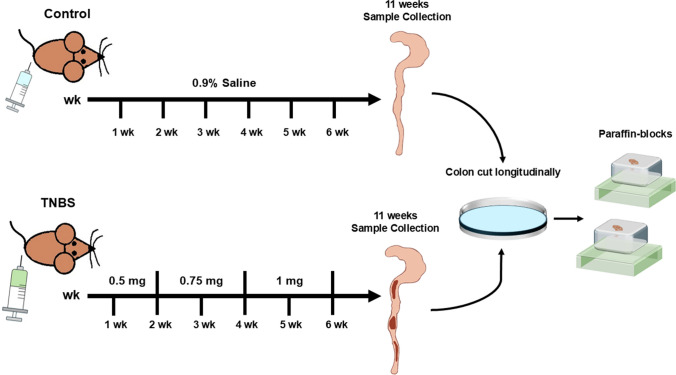
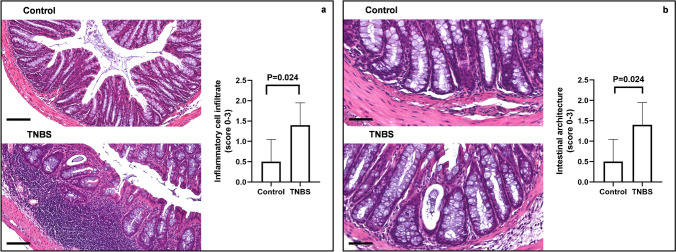
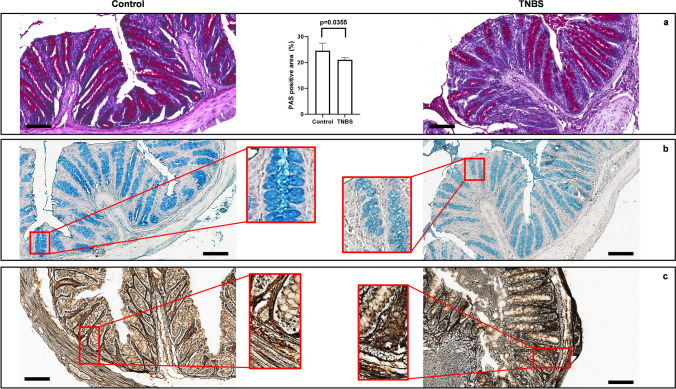
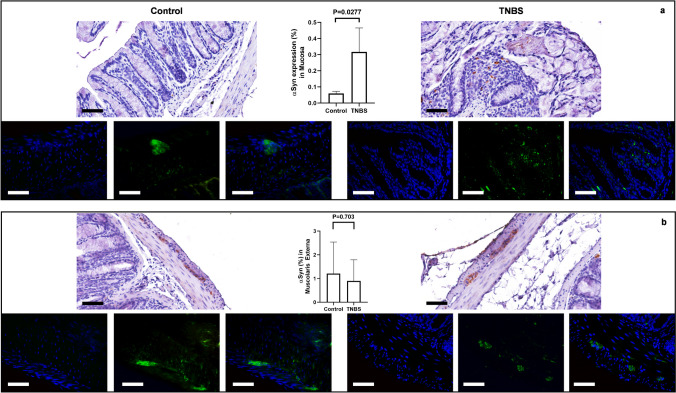
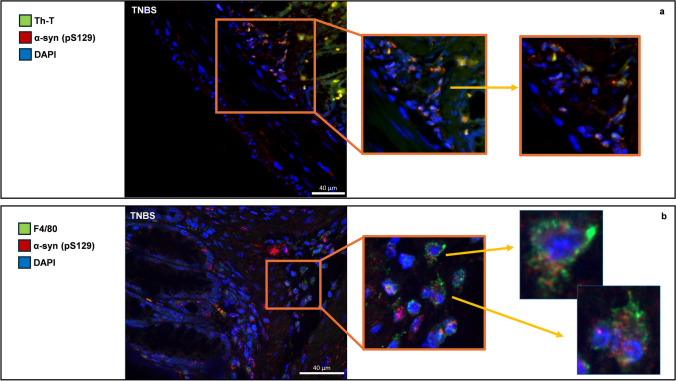
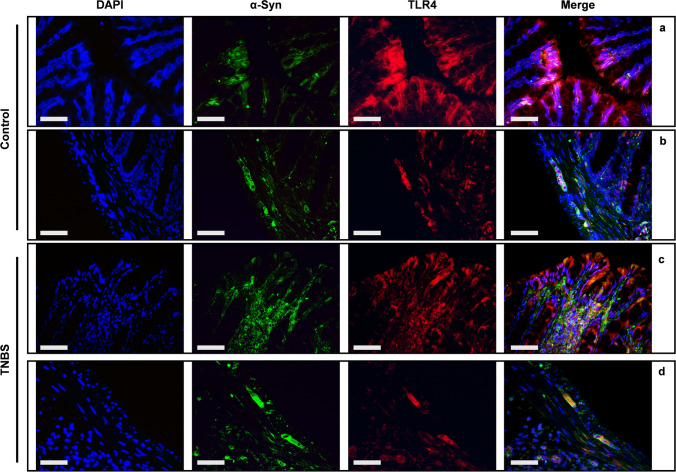
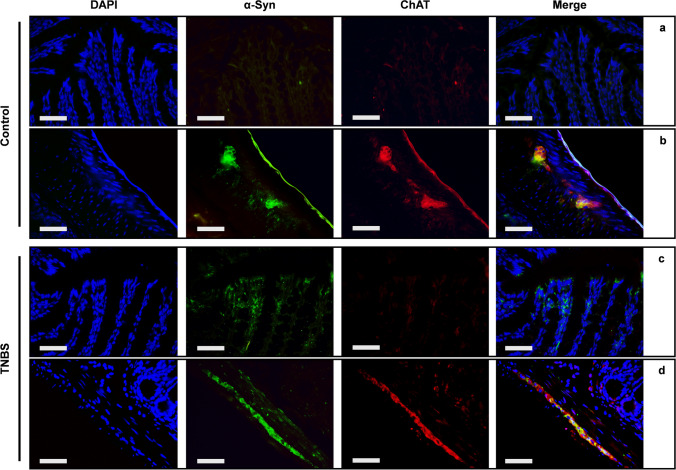
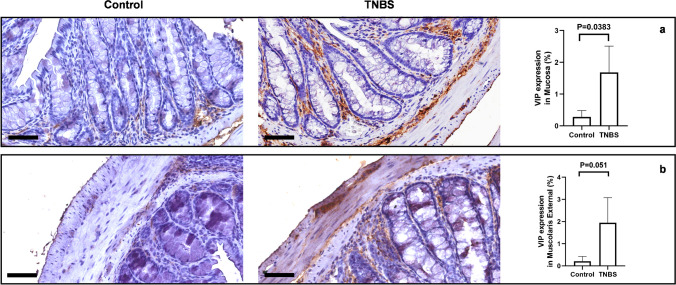
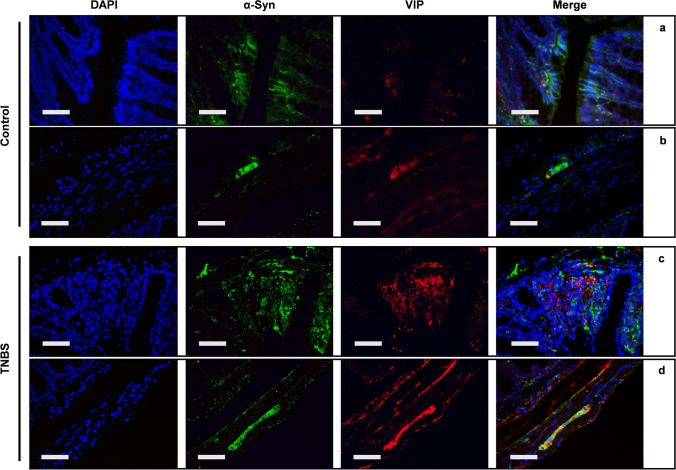
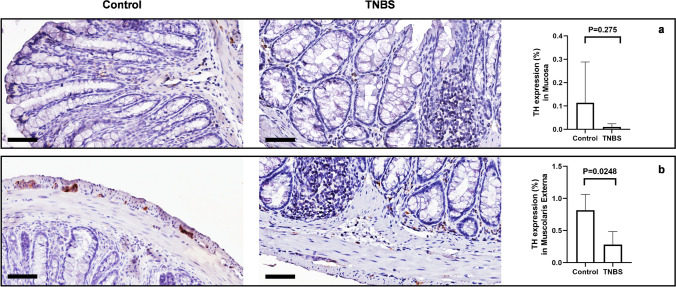
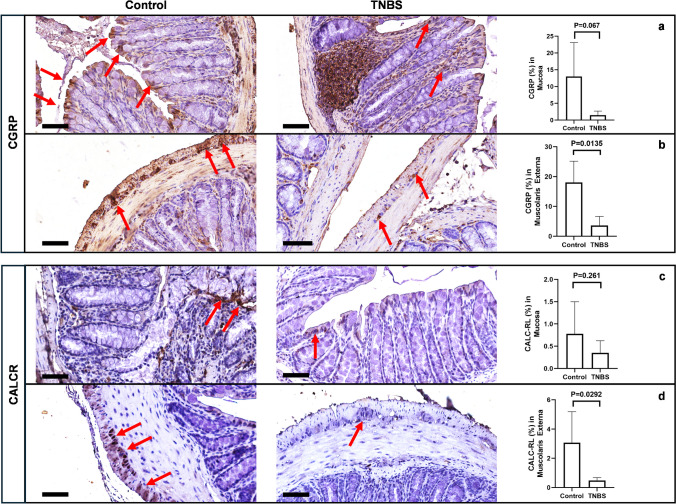
Alpha-synuclein (α-syn) is widely expressed in presynaptic neuron terminals, and its structural alterations play an important role in the pathogenesis of Parkinson's disease (PD). Aggregated α-syn has been found in brain, in the peripheral nerves of the enteric nervous system (ENS) and in the intestinal neuroendocrine cells during synucleinopathies and inflammatory bowel disorders. In the present study, we evaluated the histomorphological features of murine colon with 2,4,6-trinitrobenzene sulfonic acid (TNBS)-induced colitis, a common model of colitis. Thereafter, we investigated the expression of α-syn, Toll-like receptor 4 (TLR4), choline acetyltransferase (ChAT), vasoactive intestinal peptide (VIP), tyrosine hydroxylase (TH), calcitonin gene-related peptide (CGRP), and calcitonin-like receptor (CALCR). Finally, we investigated the presence of phosphorylated α-syn (pS129 α-syn) aggregates and their relationship with inflammatory cells. Colon from TNBS mice showed an increase in inflammatory cells infiltrate and significative changes in the architecture of the intestinal mucosa. α-Syn expression was significantly higher in inflamed colon. VIP was increased in both the mucosa and muscularis externa of TNBS mice, while TH, CGRP, and CALCR were significantly reduced in TNBS mice. Amyloid aggregates of pS129 α-syn were detectable in the ENS, as in the macrophages around the glands of the mucosa correlating with the markers of inflammation. This study describes - for the first time - the altered expression of α-syn and the occurrence of amyloid α-syn aggregates in the inflammatory cells under colitis, supporting the critical role of bowel inflammation in synucleinopathies and the involvement of α-syn in IBD.

Keywords: Alpha-synuclein; Colitis; Enteric nervous system; Gut-brain axis; Inflammatory bowel disease.


Conflict of interest statement

Declarations. Ethics approval: Ethics approval is not applicable in this study. Conflicts of interest: The authors declare no competing interests.

Figures

Fig. 1
Fig. 1
Experimental design of TNBS-induced colitis in mice
Fig. 2
Fig. 2
Histological alterations in the TNBS-induced colitis. Representative images of H&E-staining of colon tissue showing changes in (a) inflammatory cell infiltrates and in (b) intestinal architecture between controls and TNBS-treated mice compared to controls. Colonic samples from control mice showed normal appearance with absence of inflammation (a) and typical architecture (b). Following TNBS treatment, the colon specimens displayed a marked increase of inflammatory infiltrate in lamina propria and submucosa layer compared to control mice. The intestinal architecture was changed in the colon of TNBS-treated-mice, displaying crypt dilatation or depletion, as well as branching and destroyed crypts in comparison to control mice. Optical magnification (OM) of inflammatory cell infiltrate = 20 × , scale bars = 100 μm. OM of intestinal architecture images = 40 × , scale bars = 50 μm
Fig. 3
Fig. 3
Goblet cells and myenteric plexuses are altered after TNBS-induced colitis. (a) TNBS-treated mice show significant reduction of basic mucus-secreting goblet cells, as detected by PAS staining, compared to control mice (SD for control = 2.934; SD for TNBS = 0.819; p-value = 0.0355). (b) Alcian blue staining (employed to evaluate the acidic mucin-secreting goblet cells) shows a decrease in the Alcian blue staining intensity in TNBS treated mice, in comparison with control mice. (c) Silver impregnation (SI) staining shows the changes and the degeneration of enteric neuronal structures in the colonic wall of TNBS-treated mice, in comparison to control mice, as clearly demonstrated by the increased amount of argyrophilic elements detected in the colon of TNBS mice in comparison to control mice (enlarged squared panels). OM of PAS, Alcian blue and silver staining: 20 × , scale bars = 100 μm
Fig. 4
Fig. 4
α-Syn expression is altered in TNBS-induced colitis. (a) In control mice, α-syn was localized in scattered cells of the lamina propria, placed around the crypts. Following the treatment with TNBS, the expression of α-syn was significantly increased in the mucosa with the presence of immunoreactive varicous fibers and peri-glandular cells at the level of lamina propria. SD for control = 0.0121; SD for TNBS = 0.1488; p-value = 0.0277. (b) In control mice, α-syn was expressed in the ganglia of the myenteric plexus where it discloses a homogenous and compact staining in neuronal cells. In TNBS-treated mice, the ganglia of the myenteric plexus disclose a morphologically altered positivity with α-syn expression characterized by a punctate and scattered staining in the context of the enteric neuronal cells. Quantitative analysis (linear bars with individual dots) confirmed that α-syn-immunoreactivity was significantly increased in the mucosa of TNBS-treated mice, in comparison to control mice, whereas not significant differences were detected in the expression of α-syn by the ganglia of the myenteric plexus between TNBS-treated and control mice. SD for control = 1.332; SD for TNBS = 0.8939; p-value = 0.703. OM 40 × — scale bars = 50 μm
Fig. 5
Fig. 5
(a) IF showing ThT (green) and pS129 α-syn (red) in the colonic wall of TNBS mice. ThT increases in fluorescence upon binding to amyloid fibrils, and its presence was higher in inflamed intestine together with pS129 α-syn, a widely described marker of amyloid aggregation. Aggregates of α-syn (b) double IF for pS129 α-syn (red) and F4/80 pan-macrophagic marker (green) in the distal colon of TNBS-treated mice. Large aggregates of pS129 α-syn are detectable in the mucosa of the distal colon after TNBS treatment, and they extensively co-expressed with macrophages placed around the colonic glands. Aggregates of pS129 α-syn are evident in the context of these cells where they form clusters of dot-like staining in the cytoplasm and around the nucleus. OM 20 ×. Scale bars 40 µm
Fig. 6
Fig. 6
Co-expression of α-syn and TLR4 in the colon of TNBS-induced colitis double IF with anti α-syn and anti-TLR4 antibodies in the mucosa (a and c) and in the muscularis externa (b and d) of control and TNBS-treated mice. An extensive co-expression between TLR4 and α-syn is detectable in TNBS-treated mice, in both mucosal layer and myenteric plexus. OM 40 × scale bars = 50 μm
Fig. 7
Fig. 7
TNBS treatment alters the ChAT expression in both mucosal and muscular layer. (a) ChAT expression is present in scattered mucosa cells of control mice and increases in the fibers around mucosal gland and in the submucosa of TNBS-treated mice, as revealed by quantitative analysis. SD of control = 0.01862; SD of TNBS = 1.42; p-value = 0.2121. (b) In the muscularis externa, ChAT is slightly expressed in the myenteric neurons of control mice, where it is drastically increased after TNBS treatment. SD of control = 0.7642; SD of TNBS = 1.115; p-value = 0.0146. OM 40 × scale bars = 50 μm
Fig. 8
Fig. 8
α-Syn and ChAT are co-expressed in both mucosa and myenteric plexus. In control mice, co-expression between ChAT (red) and α-syn (green) was very week in mucosal layer (a). Whereas an extensive co-expression (merge — yellow) was detected in the myenteric neurons (b). Slightly increased co-expression of ChAT and α-syn (merge — yellow) features the mucosa and the lamina propria of TNBS-treated colon (c). While a wide co-expression is constantly detected in the myenteric plexus (d). OM 40 × scale bars = 50 μm
Fig. 9
Fig. 9
VIP expression is increased in TNBS-treated mice. (a) VIP is expressed by scattered mucosal cells and by submucosal neurons of control mice. Increased expression of VIP is detected in the submucosal plexus and in the fibers innervating the mucosal glands, after treatment with TNBS. SD of control = 0.197; SD of TNBS = 0.83; p-value = 0.0383. (b) A similar profile is detectable in the muscularis externa, where VIP is almost unexpressed in the myenteric neurons of control mice, while it dramatically increases in the same neurons after TNBS treatment. SD of control = 0.218; SD of TNBS = 1.133; p-value = 0.051. OM 40 × scale bars = 50 μm
Fig. 10
Fig. 10
α-Syn and VIP are co-expressed both in mucosa and myenteric plexus of TNBS-treated mice double IF for α-syn (green) and VIP (red). Expression of both VIP and α-syn is increased in the mucosa and in the submucosal plexus of TNBS-treated mice (c), in comparison to control mice (a). Co-expression is detected in the fibers gathering the mucosal glands and the inflammatory infiltrate of TNBS-treated mice. Similarly, increased VIP expression is detected in the myenteric ganglia of TNBS-treated mice (d), in comparison to control mice (b) and extensive co-expression between VIP and α-syn is evident in myenteric neurons, after TNBS treatment. OM 40 ×
Fig. 11
Fig. 11
TNBS-treated mice show decreased TH expression in myenteric plexuses. (a) TH expression was slightly weak in the mucosa and the submucosa, and no significant changes in TH-immunoreactivity in the mucosa were detectable between controls and TNBS-treated mice. SD of control = 0.1748; SD of TNBS = 0.0138; p-value = 0.275. (b) In control mice, TH is highly expressed by sparse neurons of myenteric plexus. After TNBS treatment, a significant loss of TH-positive enteric neurons is detectable. SD of control = 0.246; SD of TNBS = 0.201; p-value = 0.0248. OM 40 × scale bars = 50 μm
Fig. 12
Fig. 12
CGRP and CALCRL expression are reduced in the colon of TNBS mice. (a) In control mice, CGRP (α and β) is expressed by the neurons of submucosal plexus, with the fibers projecting to the mucosa and gathering mucous glands (red arrows). The mucosal and submucosal expression is reduced after TNBS treatment (SD of control = 10.10; SD of TNBS = 1.218; p-value = 0.067), and a widespread positivity for CGRP becomes visible in the inflammatory infiltrate, at both mucosa and submucosa. (b) Similarly, CGRP is strongly expressed in the myenteric plexus of control mice, and a significant reduction is detectable after treatment with TNBS (red arrows). SD of control = 7.093; SD of TNBS = 3.055; p-value = 0.0135. (c) A slight but not significant reduction of CALCR expression is detected in the mucosa and the submucosa after treatment with TNBS (red arrows). SD of control = 0.72; SD of TNBS = 0.2707; p-value = 0.261. (d) In the muscularis externa, control mice express CALCR in myenteric neurons, where it results significantly reduced after treatment with TNBS (red arrows). SD of control = 2.125; SD of TNBS = 0.189; p-value = 0.0292. OM 40 × scale bars = 50 μm

References

    1. Annerino DM, Arshad S, Taylor GM, Adler CH, Beach TG, Greene JG (2012) Parkinson’s disease is not associated with gastrointestinal myenteric ganglion neuron loss. Acta Neuropathol 124:665–680 - PMC - PubMed
    1. Anwar S, Peters O, Millership S, Ninkina N, Doig N, Connor-Robson N, Threlfell S, Kooner G, Deacon RM, Bannerman DM, Bolam JP, Chandra SS, Cragg SJ, Wade-Martins R, Buchman VL (2011) Functional alterations to the nigrostriatal system in mice lacking all three members of the synuclein family. J Neurosci 31:7264–7274 - PMC - PubMed
    1. Bechtold BJ, Lynch KD, Oyanna VO, Call MR, White LA, Graf TN, Oberlies NH, Clarke JD (2024) Pharmacokinetic effects of different models of nonalcoholic fatty liver disease in transgenic humanized OATP1B mice. Drug Metab Dispos 52:355–367 - PMC - PubMed
    1. Boltin D, Perets TT, Vilkin A, Niv Y (2013) Mucin function in inflammatory bowel disease: an update. J Clin Gastroenterol 47:106–111 - PubMed
    1. Bonaccorsi di Patti MC, Angiulli E, Casini A, Vaccaro R, Cioni C, Toni M (2022) Synuclein analysis in adult Xenopus laevis. Int J Mol Sci 23:6058 - PMC - PubMed

Substances

LinkOut - more resources