

Static Versus Dynamic Model Predictions of Competitive Inhibitory Metabolic Drug-Drug Interactions via Cytochromes P450: One Step Forward and Two Steps Backwards
- PMID: 39656410
- PMCID: PMC11762507
- DOI: 10.1007/s40262-024-01457-1
Static Versus Dynamic Model Predictions of Competitive Inhibitory Metabolic Drug-Drug Interactions via Cytochromes P450: One Step Forward and Two Steps Backwards
Abstract
Background: Predicting metabolic drug-drug interactions (DDIs) via cytochrome P450 enzymes (CYP) is essential in drug development, but controversy has reemerged recently about whether in vitro-in vivo extrapolation (IVIVE) using static models can replace dynamic models for some regulatory filings and label recommendations.
Objective: The aim of this study was to determine if static and dynamic models are equivalent for the quantitative prediction of metabolic DDIs arising from competitive CYP inhibition.
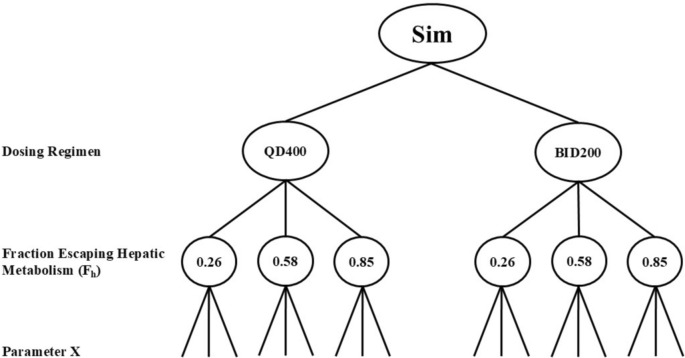
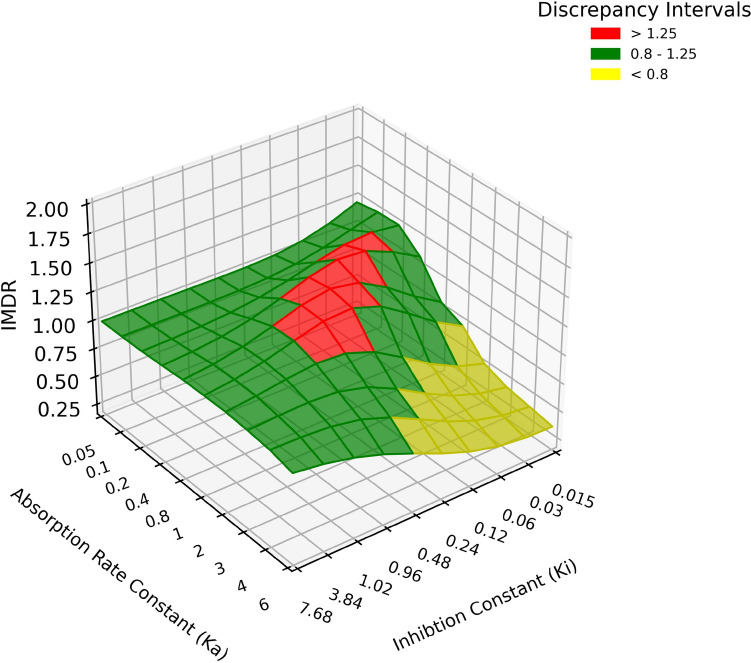
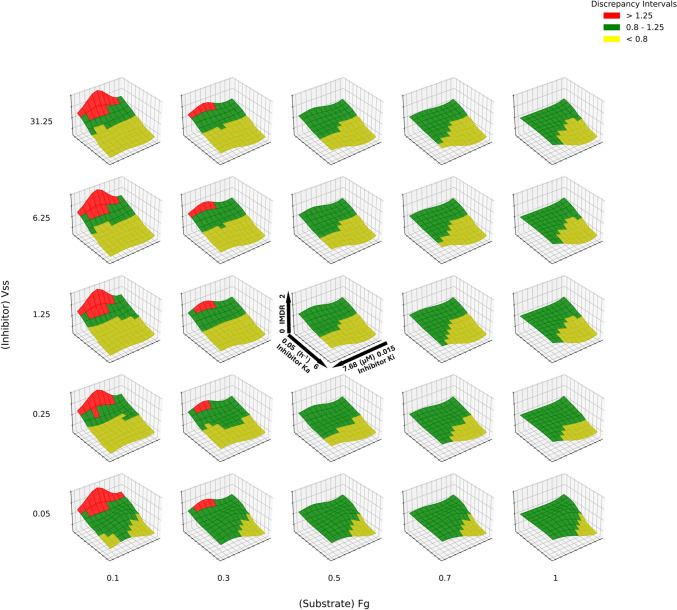
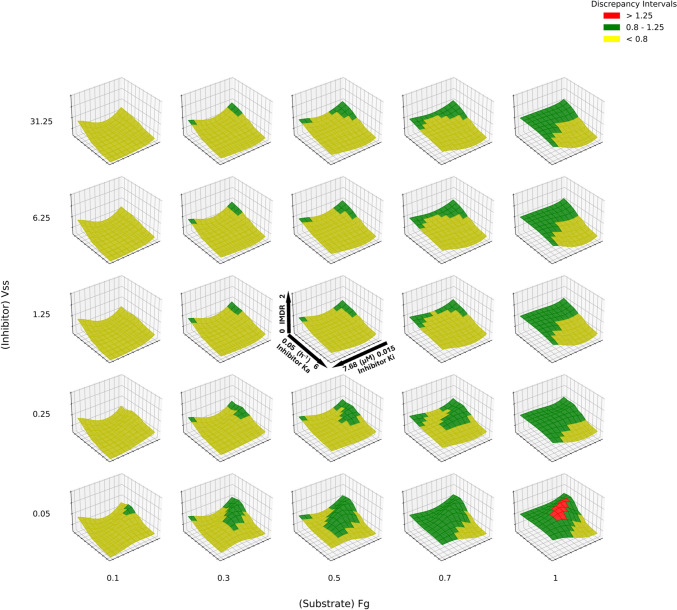
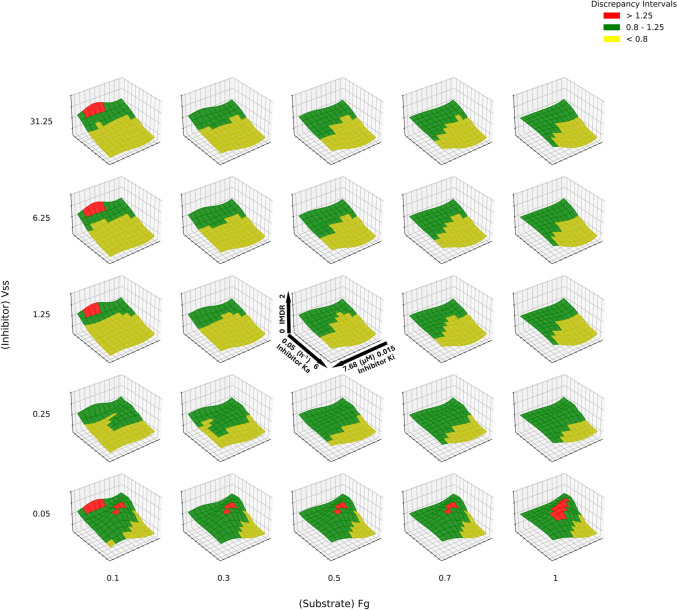
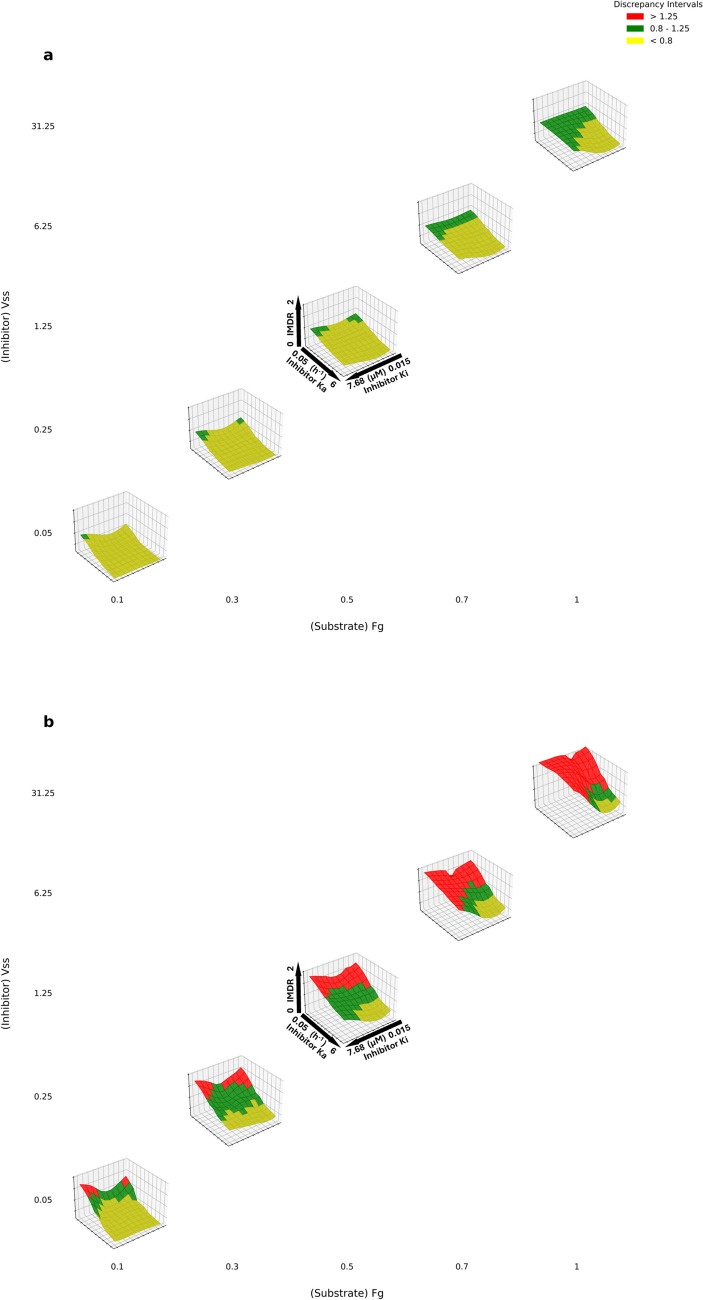
Methods: Drug parameter spaces were varied to simulate 30,000 DDIs between hypothetical substrates and inhibitors of CYP3A4. Predicted area under the plasma concentration-time profile ratios for substrates (AUCr = AUC(presence of precipitant)/AUC(absence of precipitant)) were compared between dynamic simulations (Simcyp® V21) and corresponding static calculations, giving an inter-model discrepancy ratio (IMDR = AUCrdynamic/AUCrstatic). Dynamic simulations were conducted using a 'population' representative and a 'vulnerable patient' representative with maximal concentration (Cmax) or average steady-state concentration (Cavg,ss) as the inhibitor driver concentrations. IMDRs outside the interval 0.8-1.25 were defined as discrepancy between models.
Results: The highest rate of IMDR <0.8 and IMDR >1.25 discrepancies in the 'population' representative was 85.9% and 3.1%, respectively, when using Cavg,ss as the inhibitor driver concentration. Using the 'vulnerable patient' representative showed the highest rate of IMDR >1.25 discrepancies at 37.8%.
Conclusion: Static models are not equivalent to dynamic models for predicting metabolic DDIs via competitive CYP inhibition across diverse drug parameter spaces, particularly for vulnerable patients. Caution is warranted in drug development if static IVIVE approaches are used alone to evaluate metabolic DDI risks.
© 2024. The Author(s).
Conflict of interest statement
Declarations. Conflicts of Interest: Ivan Tiryannik, Aki T. Heikkinen, Iain Gardner, Masoud Jamei, Anthonia Onasanwo, and Amin Rostami-Hodjegan are paid employees of Certara Predictive Technologies and may hold shares in Certara. The authors indicate no other conflicts of interest. Author Contributions: Conceptualisation: Amin Rostami-Hodjegan; Methodology: Ivan Tiryannik, Aki T. Heikkinen, Iain Gardner, Masoud Jamei, Amin Rostami-Hodjegan, Thomas M. Polasek; Software: Anthonia Onasanwo, Ivan Tiryannik; Formal analysis: Ivan Tiryannik; Investigation: Ivan Tiryannik, Aki T. Heikkinen, Iain Gardner; Data curation: Ivan Tiryannik; Writing – original draft: Ivan Tiryannik; Writing – review & editing: Aki T. Heikkinen, Iain Gardner, Masoud Jamei, Amin Rostami-Hodjegan, Thomas M. Polasek, Anthonia Onasanwo; Visualisation: Ivan Tiryannik. Data and Code Availability Statement: The authors confirm that the visualised data supporting the findings of this study are available within the article and its supplementary materials. The individual simulation data sets are available from the corresponding author, Ivan Tiryannik, upon reasonable request. The code created for compound batch generation, analysis, and visualisation can be found on this public GitHub repository: https://github.com/ivantiryannik/Simcyp-R-BatchWorkflow . Funding: Not applicable. Ethics Approval: Not applicable. Consent to Participate: Not applicable. Consent for Publication: Not applicable.
Figures
Similar articles
-
Physiologically Based Pharmacokinetic Modeling to Predict Drug-Drug Interactions of Soticlestat as a Victim of CYP Induction and Inhibition, and as a Perpetrator of CYP and P-Glycoprotein Inhibition.Clin Pharmacol Drug Dev. 2025 May;14(5):368-381. doi: 10.1002/cpdd.1526. Epub 2025 Mar 27. Clin Pharmacol Drug Dev. 2025. PMID: 40145722 Free PMC article.
-
Predictions of metabolic drug-drug interactions using physiologically based modelling: Two cytochrome P450 3A4 substrates coadministered with ketoconazole or verapamil.Clin Pharmacokinet. 2010 Apr;49(4):239-58. doi: 10.2165/11318130-000000000-00000. Clin Pharmacokinet. 2010. PMID: 20214408
-
Physiologically based pharmacokinetic modeling to assess metabolic drug-drug interaction risks and inform the drug label for fedratinib.Cancer Chemother Pharmacol. 2020 Oct;86(4):461-473. doi: 10.1007/s00280-020-04131-y. Epub 2020 Sep 4. Cancer Chemother Pharmacol. 2020. PMID: 32886148 Free PMC article.
-
Mini-series: I. Basic science. Uncertainty and inaccuracy of predicting CYP-mediated in vivo drug interactions in the ICU from in vitro models: focus on CYP3A4.Intensive Care Med. 2009 Mar;35(3):417-29. doi: 10.1007/s00134-008-1384-1. Epub 2009 Jan 9. Intensive Care Med. 2009. PMID: 19132343 Review.
-
Prediction of pharmacokinetic drug-drug interaction caused by changes in cytochrome P450 activity using in vivo information.Pharmacol Ther. 2010 Feb;125(2):230-48. doi: 10.1016/j.pharmthera.2009.10.011. Epub 2009 Dec 3. Pharmacol Ther. 2010. PMID: 19951720 Review.
Cited by
-
Caution with PBPK Modeling Based on the In Vitro Kinetics for Bilirubin Hepatic Uptake and Glucuronidation: Commentary on Dong et al.Clin Pharmacol Ther. 2025 Aug;118(2):301-303. doi: 10.1002/cpt.3734. Epub 2025 May 26. Clin Pharmacol Ther. 2025. PMID: 40418110 Free PMC article. No abstract available.
-
A Review on New Frontiers in Drug-Drug Interaction Predictions and Safety Evaluations with In Vitro Cellular Models.Pharmaceutics. 2025 Jun 6;17(6):747. doi: 10.3390/pharmaceutics17060747. Pharmaceutics. 2025. PMID: 40574059 Free PMC article. Review.
References
-
- Snyder B, Polasek TM, Doogue MP. Drug interactions: principles and practice. Aust Prescr. 2012;35:85–8. 10.18773/austprescr.2012.037.
-
- International Council for Harmonisation of Technical Requirements for Pharmaceuticals for Human Use. ICH M12 Guideline on drug interaction studies. 2024. https://www.ema.europa.eu/en/documents/scientific-guideline/ich-m12-guid.... Accessed 21 June 2024.
-
- US Food and Drug Administration. Guidance for Industry: In Vitro Drug Interaction Studies — Cytochrome P450 Enzyme- and Transporter-Mediated Drug Interactions. 2020. https://www.fda.gov/media/134582/download. Accessed 12 Feb 2024.
-
- European Medicines Agency. Guideline on the investigation of drug interactions. 2012. https://www.ema.europa.eu/en/documents/scientific-guideline/guideline-in.... Accessed 12 Feb 2024.
MeSH terms
Substances
LinkOut - more resources
Full Text Sources
