

Early Diabetic Retinopathy Evaluation With OCTA: A Study on Vascular Branching and Fragmentation
- PMID: 39656470
- PMCID: PMC11636659
- DOI: 10.1167/iovs.65.14.21
Early Diabetic Retinopathy Evaluation With OCTA: A Study on Vascular Branching and Fragmentation
Abstract
Purpose: The purpose of this study was to quantitatively evaluate the branching patterns and vascular fragmentation features in preclinical and early diabetic retinopathy (DR) using optical coherence tomography angiography (OCTA).
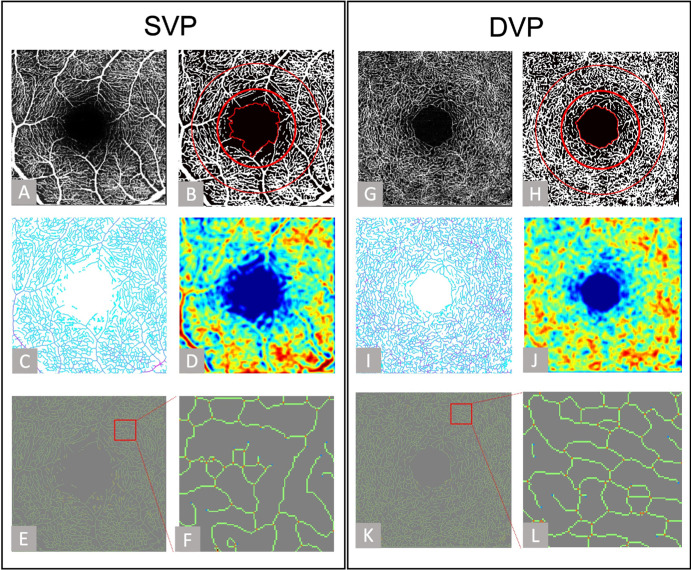
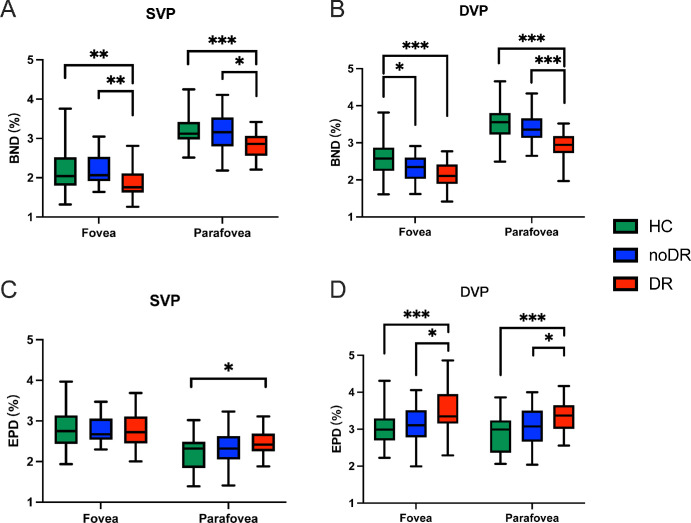
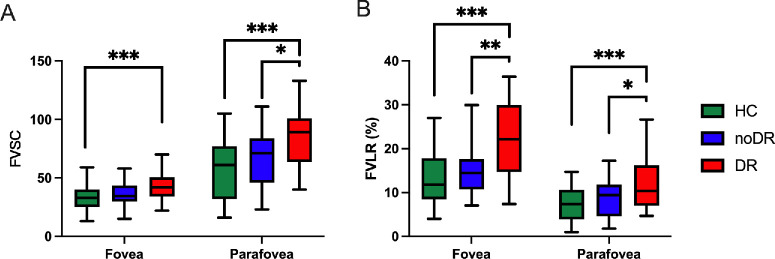
Methods: OCTA metrics, including branch node number (BNN), branch node density (BND), end point number (EPN), end point density (EPD), fragmented vessel segment count (FVSC), and fragmented vascular length ratio (FVLR), were measured in foveal and parafoveal regions within superficial and deep vascular plexus (SVP and DVP) in the retina.
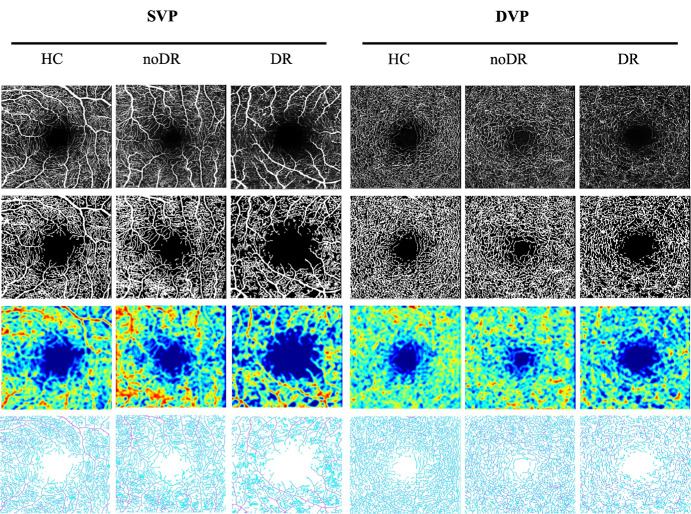
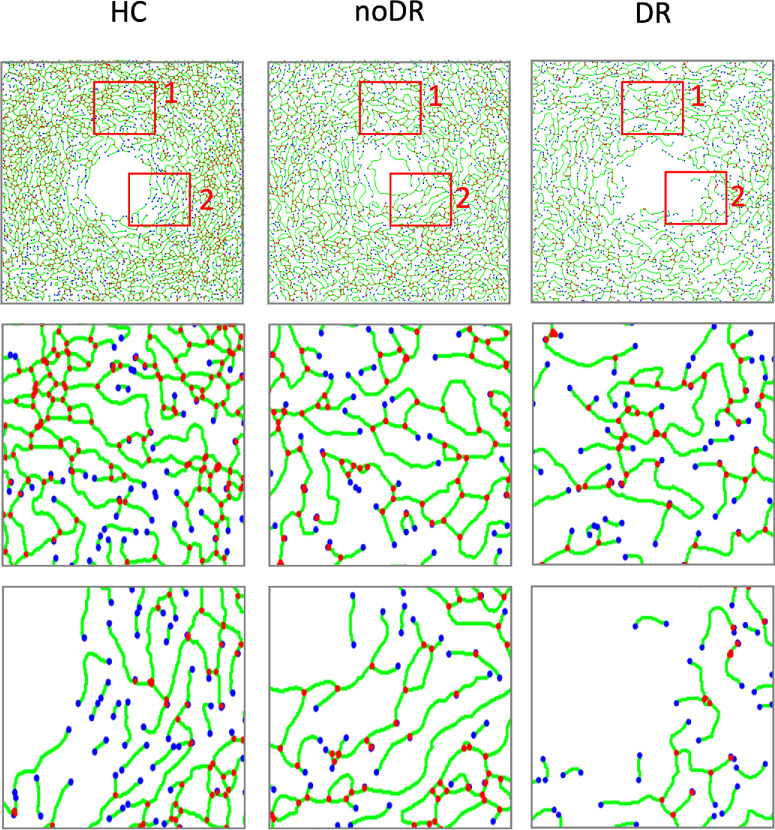
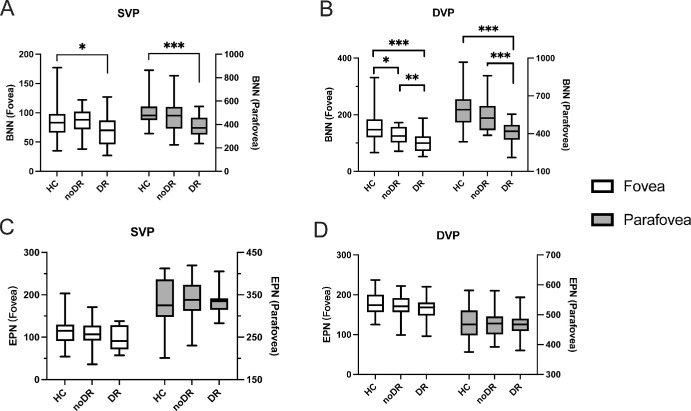
Results: Compared to healthy control (HCs), both BNN and BND exhibited a significant decrease in individuals with mild DR across both retinal layers, and also in diabetes mellitus without DR (no DR) within DVP. EPD showed a significant increase in mild DR cases compared to HCs, except for the foveal region in SVP; however, EPN did not demonstrate a significant difference among the three groups. Increases in both FVSC and FVLR were significant across all areas and in both layers of the retina. Notably, these metrics showed more pronounced differentiation in the DVP than the SVP.
Conclusions: Foveal BND and BNN in DVP reveal vascular alterations indicative of preclinical DR. Indicators such as EPD, FVSC, and FVLR in DVP correlate with early DR changes and are useful for its early detection. These initial findings demonstrate the potential and benefits of these quantitative OCTA indices for delineating DR-associated alterations in the retinal microvasculature, indicating their potential clinical utility for improved DR screening.
Conflict of interest statement
Disclosure:
Figures
Similar articles
-
Vessel Density around Foveal Avascular Zone as a Potential Imaging Biomarker for Detecting Preclinical Diabetic Retinopathy: An Optical Coherence Tomography Angiography Study.Semin Ophthalmol. 2020 Aug 17;35(5-6):316-323. doi: 10.1080/08820538.2020.1845386. Epub 2020 Dec 1. Semin Ophthalmol. 2020. PMID: 33258720
-
Visualization of 3 Distinct Retinal Plexuses by Projection-Resolved Optical Coherence Tomography Angiography in Diabetic Retinopathy.JAMA Ophthalmol. 2016 Dec 1;134(12):1411-1419. doi: 10.1001/jamaophthalmol.2016.4272. JAMA Ophthalmol. 2016. PMID: 27812696 Free PMC article.
-
Microvascular retinal changes in pre-clinical diabetic retinopathy as detected by optical coherence tomographic angiography.Graefes Arch Clin Exp Ophthalmol. 2020 Mar;258(3):513-520. doi: 10.1007/s00417-019-04590-x. Epub 2020 Jan 2. Graefes Arch Clin Exp Ophthalmol. 2020. PMID: 31897704
-
Implication of Deep-Vascular-Layer Alteration Detected by Optical Coherence Tomography Angiography for the Pathogenesis of Diabetic Retinopathy.Ophthalmologica. 2019;241(4):179-182. doi: 10.1159/000495624. Epub 2019 Jan 16. Ophthalmologica. 2019. PMID: 30650416 Review.
-
Evaluation of Posterior Ocular Blood Flow in Diabetic Retinopathy Patients Without Macular Edema Using Optical Coherence Tomography Angiography.Photodiagnosis Photodyn Ther. 2023 Dec;44:103777. doi: 10.1016/j.pdpdt.2023.103777. Epub 2023 Sep 3. Photodiagnosis Photodyn Ther. 2023. PMID: 37669724 Review.
Cited by
-
Association between inferior posterior staphyloma on choroidal vessels running patterns in healthy eyes.Int J Retina Vitreous. 2025 Mar 27;11(1):37. doi: 10.1186/s40942-025-00661-w. Int J Retina Vitreous. 2025. PMID: 40149010 Free PMC article.
References
-
- Agra CLD, Lira RPC, Pinheiro FG, Sa L, Filho V.. Optical coherence tomography angiography: microvascular alterations in diabetic eyes without diabetic retinopathy. Arq Bras Oftalmol . 2021; 84(2): 149–157. - PubMed
-
- Chen Q, Ma QK, Wu CM, et al. .. Macular vascular fractal dimension in the deep capillary layer as an early indicator of microvascular loss for retinopathy in type 2 diabetic patients. Invest Ophthalmol Vis Sci . 2017; 58(9): 3785–3794. - PubMed
-
- Ogurtsova K, da Rocha Fernandes J, Huang Y, et al. .. IDF Diabetes Atlas: global estimates for the prevalence of diabetes for 2015 and 2040. Diabetes Res Clin Pract . 2017; 128: 40–50. - PubMed
MeSH terms
LinkOut - more resources
Full Text Sources
Medical
