. 2024 Nov 18;16(5):3069-3088.
doi: 10.14336/AD.2024.0835.

Brain Resident Ly6Chi Monocytes Are Necessary for Maintaining Adult Hippocampal Neurogenesis

Affiliations

Brain Resident Ly6Chi Monocytes Are Necessary for Maintaining Adult Hippocampal Neurogenesis

Yiran Huang et al. Aging Dis. .

Abstract

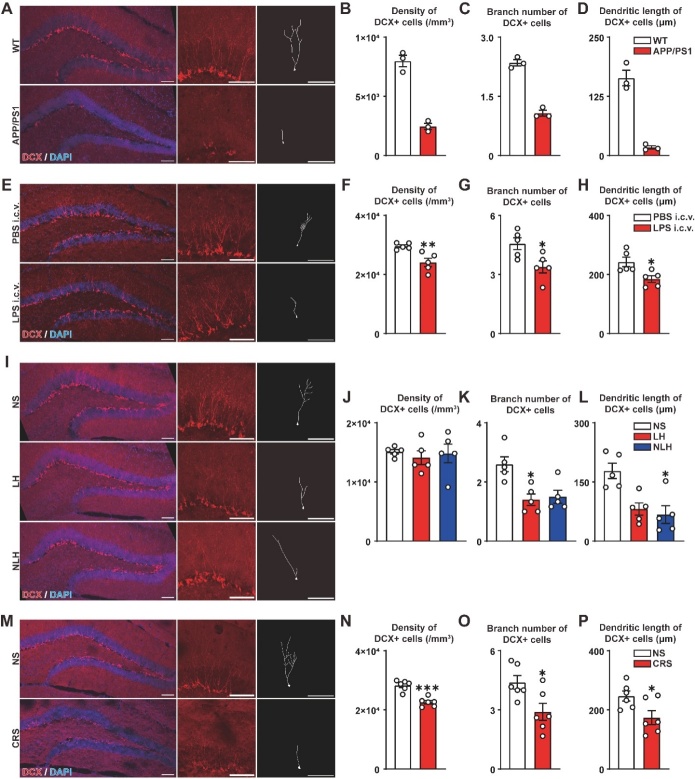
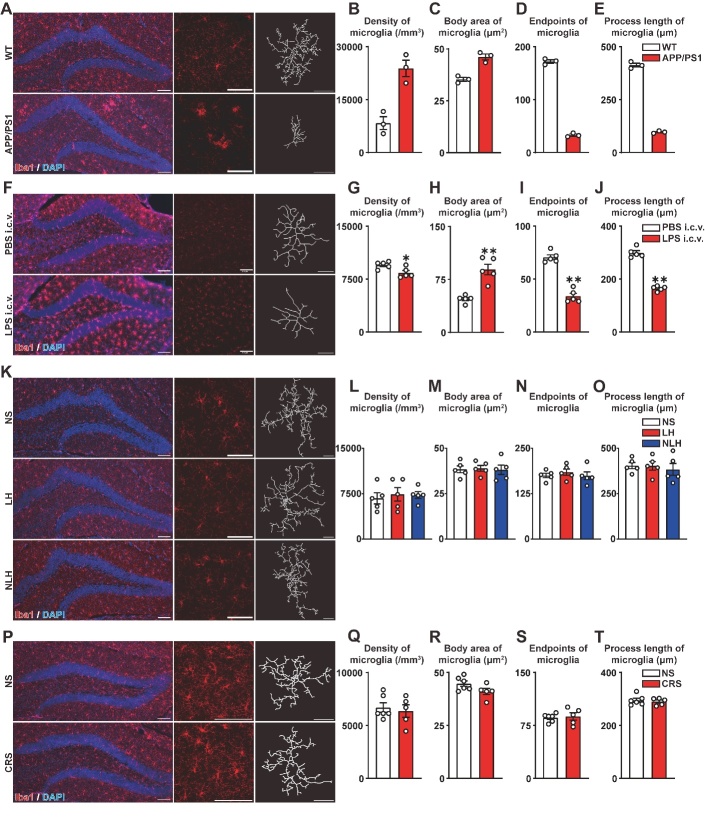
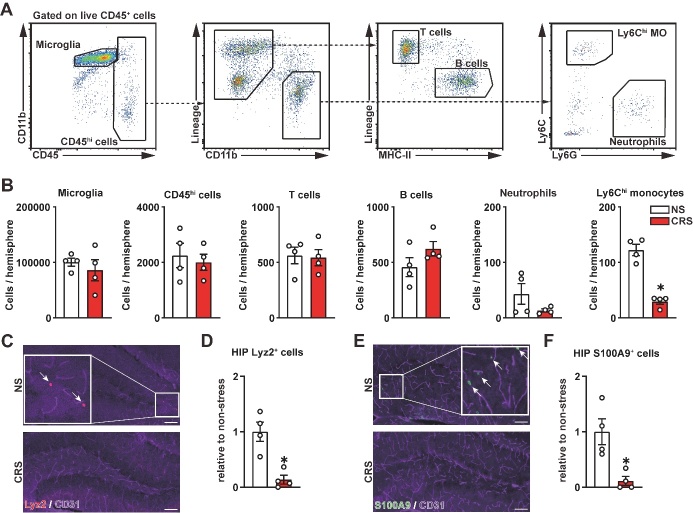
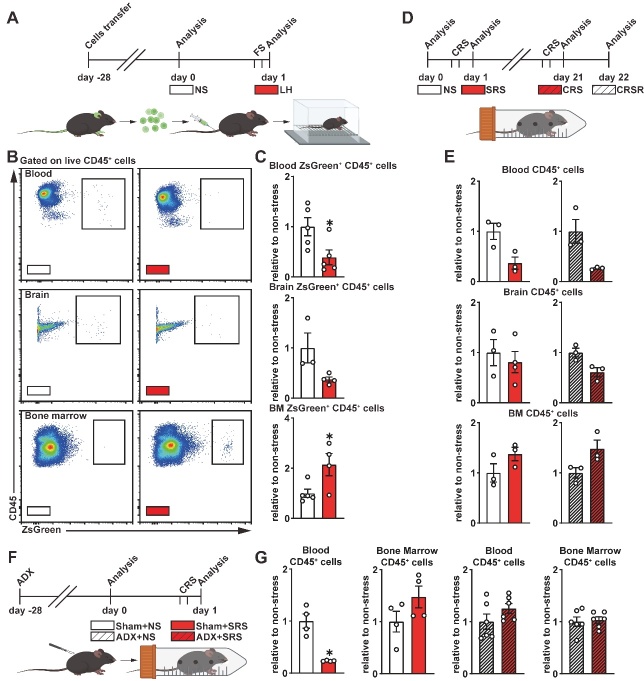
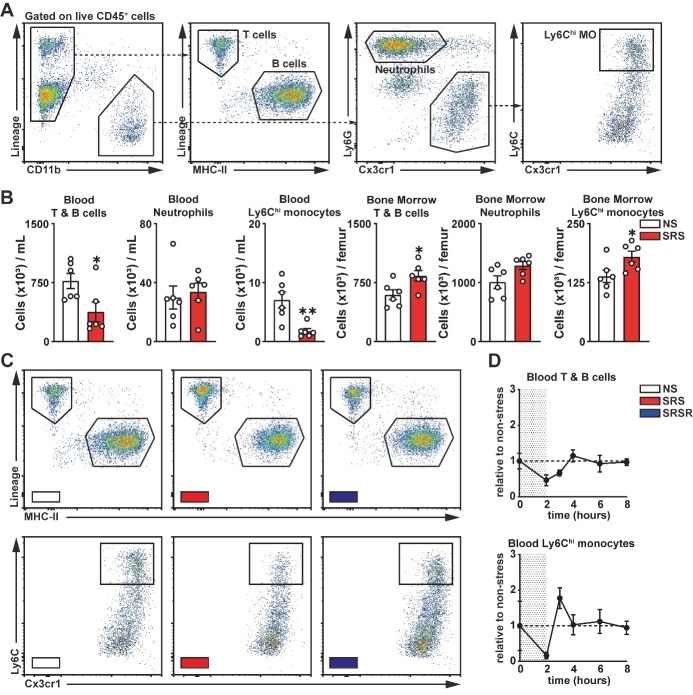
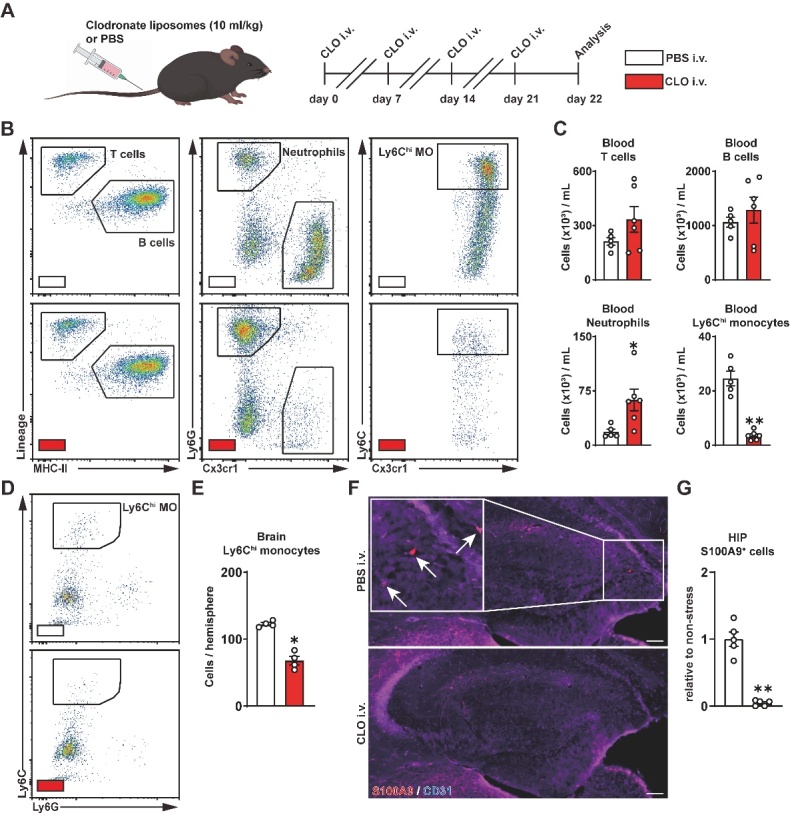
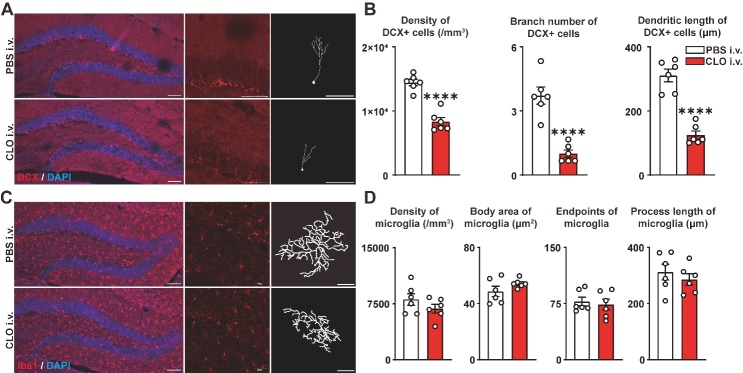
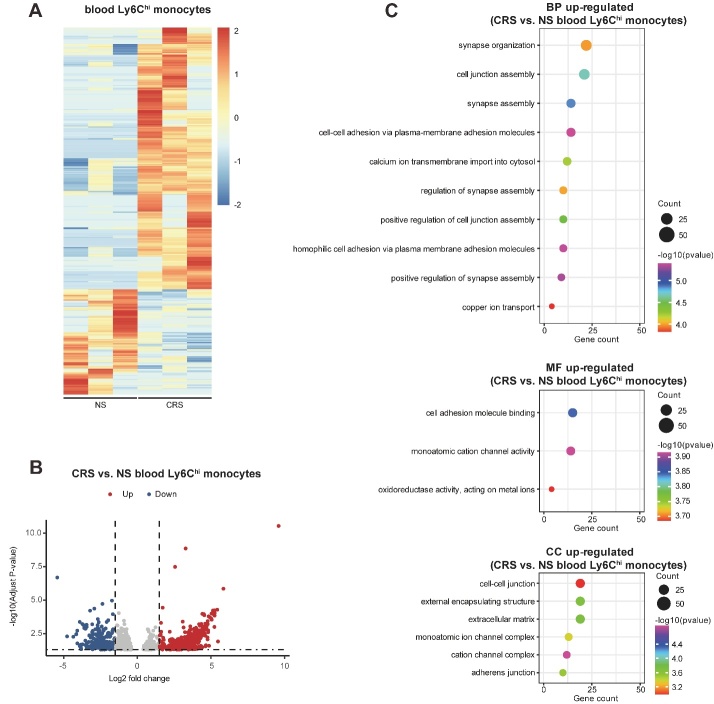
Adult hippocampal neurogenesis (AHN) is crucial to various brain functions. Neurodegeneration, neuroinflammation and stress can impair AHN, contributing to the development of neurological and psychiatric disorders. Stress is known to extensively affect both the brain and peripheral immune system. However, the cellular and molecular mechanisms underlying stress-induced impairments in AHN remain unclear. In this study, we found that, unlike neuroinflammatory conditions, stress significantly inhibited AHN independently of microglial activation, suggesting a novel mechanism mediating stress-impaired AHN. Since stress modulates peripheral immune cells, we examined the distribution of immune cells infiltrating the brain. We found a significant decrease of infiltrated Ly6Chi monocytes in the brain parenchyma. In the blood, adoptively transferred ZsGreen+ Ly6Chi monocytes drastically reduced due to stress-induced homing to the bone marrow. Adrenalectomy (ADX) experiments revealed that monocyte homing is regulated by glucocorticoid and may cause impairments in AHN. Depleting peripheral circulating monocytes reduced brain-resident Ly6Chi monocytes and replicated the stress-induced inhibition of AHN, independent of microglia activation. RNA sequencing analysis of Ly6Chi monocytes revealed a stress-induced transcriptional profile, suggesting their supportive role in neuronal functions. Together, these findings demonstrate a novel and essential role of brain resident Ly6Chi monocytes in maintaining AHN at basal level, which is important for brain functions.


Figures

Figure 1.
Figure 1.
Neurodegeneration, neuroinflammation and stress inhibit adult hippocampal neurogenesis. (A) Hippocampal coronal sections of the brains of mice in the WT and APP/PS1 groups were stained with DCX antibody. Scale bar = 100 μm, Scale bar of morphological analysis = 100 μm. (B, C, D) Quantification of the density of DCX+ newborn immature neuron (B), average dendritic branch number (C), and average dendritic branch length (D). n = 3 mice in each group. (E) Hippocampal coronal sections of the brains of mice in the PBS i.c.v. and LPS i.c.v. groups were stained with DCX antibody. Scale bar = 100 μm, Scale bar of morphological analysis = 100 μm. (F, G, H) Quantification of the density of DCX+ newborn immature neuron (F), average dendritic branch number (G), and average dendritic branch length (H). n = 5 mice in each group. (I) Hippocampal coronal sections of the brains of mice in the NS, LH and NLH groups were stained with DCX antibody. Scale bar = 100 μm, Scale bar of morphological analysis = 100 μm. (J, K, L) Quantification of the density of DCX+ newborn immature neuron (J), average dendritic branch number (K), and average dendritic branch length (L). n = 5 mice in each group. (M) Hippocampal coronal sections of the brains of mice in the NS and CRS groups were stained with DCX antibody. Scale bar = 100 μm, Scale bar of morphological analysis = 100 μm. (N, O, P) Quantification of the density of DCX+ newborn immature neuron (N), average dendritic branch number (O), and average dendritic branch length (P). n = 6 mice in each group. For (B-D, F-H, J-L, N-P), data are represented as mean ± SEM. Statistical analysis was performed using Kruskal-Wallis test (J-L), Mann Whitney test (B-D, F-H) and two-tailed unpaired t-tests (N-P); *p < 0.05, **p < 0.01, ***p < 0.001.
Figure 2.
Figure 2.
Microglia activation is not involved in stress-induced inhibition of AHN. (A) Hippocampal coronal sections of the brains of mice in the WT and APP/PS1 groups were stained with Iba1 antibody. Scale bar = 100 μm, Scale bar of morphological analysis = 20 μm. (B, C, D, E) Quantification of the density of Iba1+ microglia (B), average body area (C), number of endpoints (D), and average process length of microglia (E). n = 3 mice in each group. (F) Hippocampal coronal sections of the brains of mice in the PBS i.c.v. and LPS i.c.v. groups were stained with Iba1 antibody. Scale bar = 100 μm, Scale bar of morphological analysis = 20 μm. (G, H, I, J) Quantification of the density of Iba1+ microglia (G), average body area (H), number of endpoints (I), and average process length of microglia (J). n = 5 mice in each group. (K) Hippocampal coronal sections of the brains of mice in the NS, LH and NLH groups were stained with Iba1 antibody. Scale bar = 100 μm, Scale bar of morphological analysis = 20 μm. (L, M, N, O) Quantification of the density of Iba1+ microglia (L), average body area (M), number of endpoints (N), and average process length of microglia (O). n = 5-6 mice in each group. (P) Hippocampal coronal sections of the brains of mice in the NS and CRS groups were stained with Iba1 antibody. Scale bar = 100 μm, Scale bar of morphological analysis = 20 μm. (Q, R, S, T) Quantification of the density of Iba1+ microglia (Q), average body area (R), number of endpoints (S), and average process length of microglia (T). n = 5 mice in each group. For (B-E, G-J, L-O, Q-T), data are represented as mean ± SEM. Statistical analysis was performed using Kruskal-Wallis test (L-O), Mann Whitney test (B-E, G-J) and two-tailed unpaired t-tests (Q-T); *p < 0.05, **p < 0.01.
Figure 3.
Figure 3.
CRS stress decreased resident Ly6Chi monocytes in the hippocampal DG. (A) Representative gating strategy of all major immune cell populations in the brain. Microglia are defined as CD45int CD11b+, T cells are defined as CD45hi CD11b- Lineage+ MHC-II-, B cells are defined as CD45hi CD11b- Lineage+ MHC-II+, neutrophils are defined as CD45hi CD11b+ Lineage- Ly6G+ Ly6C-and Ly6Chi monocytes are defined as CD45hi CD11b+ Lineage- Ly6G- Ly6Chi. (B) Quantification of the absolute number of major immune cells in brain of mice in the NS and CRS groups. n = 4 mice in each group. (C) Representative hippocampal coronal sections of the brains of Lyz2-tdTomato mice in the NS and CRS groups were stained with CD31 antibody. Scale bar = 100μm. (D) Quantification of the relative number of Lyz2+ cells in hippocampus after CRS stress. n = 4 mice in each group. (E) Representative hippocampal coronal sections of the brains of mice in the NS and CRS groups were stained with S100A9 and CD31 antibody. Scale bar = 100μm. (F) Quantification of the relative number of S100A9+ cells in hippocampus after CRS stress. n = 4 mice in each group. For (B, D, F), data are represented as mean ± SEM. Statistical analysis was performed using Mann Whitney test; *p < 0.05.
Figure 4.
Figure 4.
Stress drives the homing of peripheral immune cells to the bone marrow. (A) Schematic overview of LH stress followed by cells transfer. (B) Representative flow-cytometry plots of transferred cells in blood, brain, and bone marrow of recipient mice after LH stress. Transferred cells are defined as CD45+ ZsGreen+. (C) Quantification of the relative number of transferred cells in blood, brain, and bone marrow of recipient mice after LH stress. n = 3-5 mice in each group. (D) Schematic overview of SRS and CRS stress. (E) Quantification of the relative number of CD45+cells in blood, brain and bone marrow of mice in the NS, SRS, CRSR and CRS groups. n = 3 mice in each group. (F) Schematic overview of SRS followed by bilateral adrenalectomy (ADX). (G) Mice underwent ADX or sham surgery and were allowed to recover for 4 weeks prior to submission to SRS Quantification of the relative number of CD45+cells in blood, brain, and bone marrow of mice in the Sham + NS, Sham + SRS, ADX+NS and ADX+SRS groups. n = 4-6 mice in each group. For (C, E, G), data are represented as mean ± SEM. Statistical analysis was performed using Mann Whitney test (C, E, G - Sham+NS (4) & Sham+SRS (4)) and two-tailed unpaired t-tests (G - ADX+NS (6) & ADX+SRS (6)); *p < 0.05.
Figure 5.
Figure 5.
Stress drastically diminished Ly6Chi monocytes in peripheral blood. (A) Representative gating strategy of all major immune cell populations in the blood. T cells are defined as CD45+ CD11b- Lineage+, B cells are defined as CD45+ CD11b- Lineage+ MHC-II+, neutrophils are defined as CD45+ CD11b+ Lineage- Cx3cr1- Ly6G+ and Ly6Chi monocytes are defined as CD45+ CD11b+ Lineage- Cx3cr1+ Ly6Chi. (B) Quantification of the absolute number of major immune cells in blood and bone marrow of mice in the NS and SRS groups. n = 6 mice in each group. (C) Representative flow-cytometry plots of T&B cells and Ly6Chi monocytes in the blood of mice in the NS, SRS and SRSR groups. (D) T&B cells and Ly6Chi monocytes numbers in blood measured after the indicated time of recovery from single restraint stress episode, expressed as relative of mice in the NS group. n = 3 mice in each group. For (B, D), data are represented as mean ± SEM. Statistical analysis was performed using two-tailed unpaired t-tests (B) and Kruskal-Wallis test (D); *p < 0.05, **p < 0.01.
Figure 6.
Figure 6.
Depletion of circulating monocytes decreases numbers of resident Ly6Chi monocytes in the hippocampal DG. (A) Schematic overview of depletion of circulating monocytes. (B) Representative gating strategy of all major immune cell populations in the blood of mice in the PBS i.v. and CLO i.v. groups. T cells are defined as CD45+ CD11b- Lineage+, B cells are defined as CD45+ CD11b- Lineage+ MHC-II+, neutrophils are defined as CD45+ CD11b+ Lineage- Cx3cr1- Ly6G+ and Ly6Chi monocytes are defined as CD45+ CD11b+ Lineage- Cx3cr1+ Ly6Chi. (C) Quantification of the absolute number of major immune cells in the blood of mice in the PBS i.v. and CLO i.v. groups. n = 5-6 mice in each group. (D) Representative flow-cytometry plots of Ly6Chi monocytes in the brain of mice in the PBS i.v. and CLO i.v. groups. (E) Quantification of the absolute number of Ly6Chi monocytes in the brain of mice in the PBS i.v. and CLO i.v. groups. n = 4 mice in each group. (F) Hippocampal coronal sections of the brains of mice in the PBS i.v. and CLO i.v. groups were stained with S100A9 and CD31 antibody. Scale bar = 100μm. (G) Quantification of the relative number of S100A9+ cells in hippocampus after depletion of circulating monocytes. n = 5 mice in each group. For (C, E, G), data are represented as mean ± SEM. Statistical analysis was performed using two-tailed unpaired t-tests (C) and Mann Whitney test (E, G); *p < 0.05, **p < 0.01
Figure 7.
Figure 7.
Depletion of circulating monocytes reproduced the inhibitory effects of AHN by stress. (A) Hippocampal coronal sections of the brains of mice in the PBS i.v. and CLO i.v. groups were stained with DCX antibody. Scale bar = 100μm, Scale bar of morphological analysis = 100 μm. (B) Quantification of the density of DCX+ newborn immature neuron, average dendritic branch number and average dendritic branch length. n = 6 mice in each group. (C) Hippocampal coronal sections of the brains of mice in the PBS i.v. and CLO i.v. groups were stained with Iba1 antibody. Scale bar = 100μm, Scale bar of morphological analysis = 20 μm. (D) Quantification of the density of Iba1+ microglia, average body area, number of endpoints and average process length of microglia. n = 6 mice in each group. For (B, D), data are represented as mean ± SEM. Statistical analysis was performed using two-tailed unpaired t-tests; ****p < 0.0001.
Figure 8.
Figure 8.
CRS changed the transcriptional signature in Ly6Chi monocytes. (A) Heatmap of differentially expressed genes of sorted blood Ly6Chi monocytes after CRS stress. (n = 3 samples per group, 5 mice pooled per sample). (B) Volcano plot indicating differentially regulated genes (FC > |1.5|, p < 0.05 and was detected in at least two samples) of sorted blood Ly6Chi monocytes after CRS stress. (n = 3 per group, 5 mice pooled per sample). (C) Top gene ontology (GO) terms from significantly upregulated genes in Ly6Chi monocytes of CRS versus NS mice.

Similar articles

References

    1. Gomes-Leal W (2021). Adult hippocampal neurogenesis and affective disorders: New neurons for psychic well-being. Front Neurosci, 15:594448. - PMC - PubMed
    1. Deng W, Aimone JB, Gage FH (2010). New neurons and new memories: How does adult hippocampal neurogenesis affect learning and memory? Nat Rev Neurosci, 11:339-350. - PMC - PubMed
    1. Ravi M, Miller AH, Michopoulos V (2021). The immunology of stress and the impact of inflammation on the brain and behavior. BJPsych Adv, 27(Suppl 3):158-165. - PMC - PubMed
    1. Anacker C, Hen R (2017). Adult hippocampal neurogenesis and cognitive flexibility — linking memory and mood. Nat Rev Neurosci, 18:335-346. - PMC - PubMed
    1. Salta E, Lazarov O, Fitzsimons CP, Tanzi R, Lucassen PJ, Choi SH (2023). Adult hippocampal neurogenesis in Alzheimer’s disease: A roadmap to clinical relevance. Cell Stem Cell, 30:120-136. - PMC - PubMed

LinkOut - more resources