. 2024 Dec 10;135(4):e177429.
doi: 10.1172/JCI177429.

C2230, a preferential use- and state-dependent CaV2.2 channel blocker, mitigates pain behaviors across multiple pain models

Affiliations

C2230, a preferential use- and state-dependent CaV2.2 channel blocker, mitigates pain behaviors across multiple pain models

Cheng Tang et al. J Clin Invest. .

Abstract

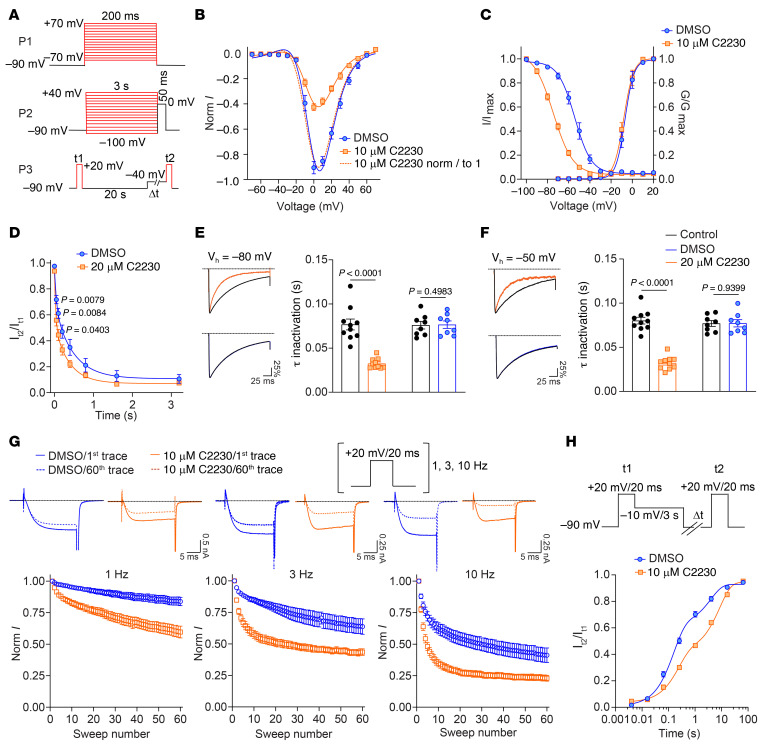
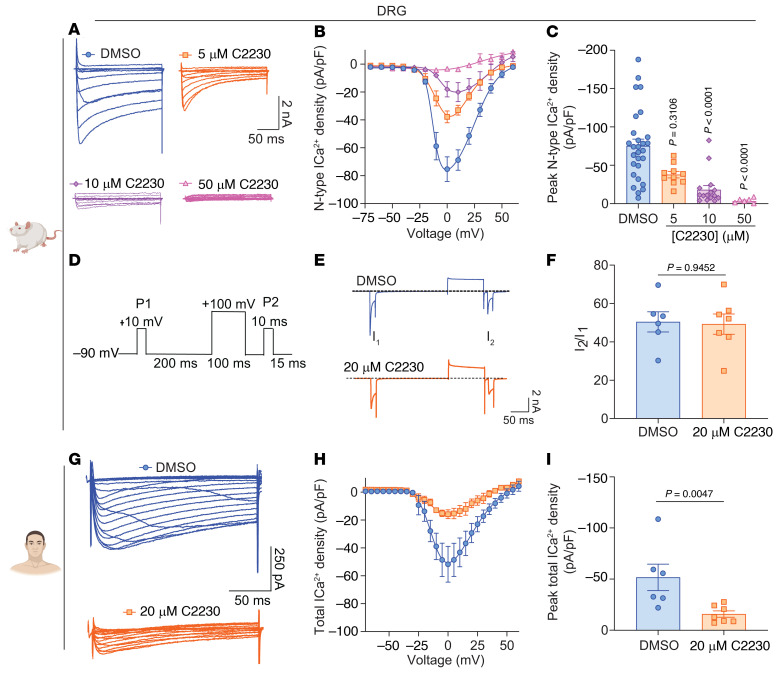
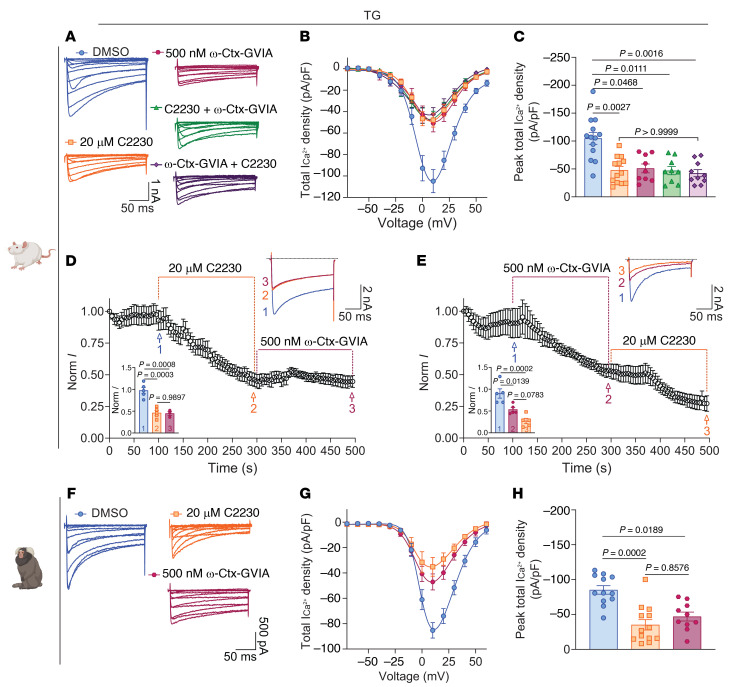
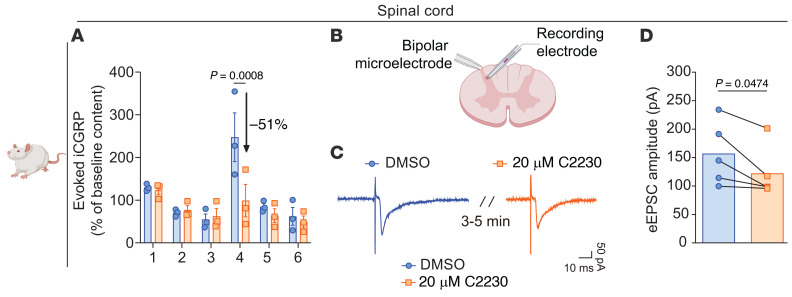
Antagonists - such as Ziconotide and Gabapentin - of the CaV2.2 (N-type) calcium channels are used clinically as analgesics for chronic pain. However, their use is limited by narrow therapeutic windows, difficult dosing routes (Ziconotide), misuse, and overdoses (Gabapentin), as well as a litany of adverse effects. Expansion of novel pain therapeutics may emerge from mechanism-based interrogation of CaV2.2. Here, we report the identification of C2230, an aryloxy-hydroxypropylamine, as a CaV2.2 blocker. C2230 trapped and stabilized inactivated CaV2.2 in a slow-recovering state and accelerated the open-state inactivation of the channel, conferring an advantageous use-dependent inhibition profile. C2230 inhibited CaV2.2 during high-frequency stimulation, while sparing other voltage-gated ion channels. C2230 inhibited CaV2.2 in dorsal root and trigeminal ganglia neurons from rats, marmosets, and humans in a G-protein-coupled-receptor-independent manner. Further, C2230 reduced evoked excitatory postsynaptic currents and excitatory neurotransmitter release in the spinal cord, leading to relief of neuropathic, orofacial, and osteoarthritic pain-like behaviors via 3 different routes of administration. C2230 also decreased fiber photometry-based calcium responses in the parabrachial nucleus, mitigated aversive behavioral responses to mechanical stimuli after neuropathic injury, and preserved protective pain responses, all without affecting motor or cardiovascular function. Finally, site-directed mutation analysis demonstrated that C2230 binds differently than other known CaV2.2 blockers, making it a promising lead compound for analgesic development.

Keywords: Calcium channels; Neuroscience; Pain; Pharmacology.


Figures

Figure 1
Figure 1. Identification of the aryloxy-hydroxypropylamine compound C2230 as a preferential CaV2.2 channel antagonist.
(A) Chemical structure of a racemic mixture of C2230. (B) Typical current traces from CaV2.2-expressing (Rattus norvegicus) HEK293 cells in the presence and absence of 5 μM C2230 at the holding potentials (Vh) of –50 mV and –80 mV (n = 10–16 cells). (C) Dose-response relationships of C2230 inhibiting CaV2.2 currents at the 2 Vh (n = 12–14 cells). (D and E) Time-course of C2230 inhibiting the CaV2.2 currents and subsequent recovery upon compound washing off (E), the typical traces in D represent the currents at time points of 1, 2, and 3, as indicated in E. Perfusion of 0.1% DMSO served as the negative control (n = 7–8 cells). (F and G) Dose-response relationships of C2230 inhibiting the heterologously expressed KV2.1, NaV1.5, CaV1.2, CaV3.1, CaV3.2, and CaV3.3 channels, with the IC50s being determined as 28.0 ± 5.4 μM and 65.8 ± 12.2 μM for KV2.1, 8.7 ± 1.0 μM and 18.1 ± 3.5 μM for NaV1.5, 22.7 ± 6.3 μM and 26.9 ± 6.0 μM for CaV1.2, 9.2 ± 1.6 μM and 7.6 ± 0.9 μM for CaV3.1, 9.9 ± 1.7 μM and 8.3 ± 2.5 μM for CaV3.2, and 13.5 ± 2.2 μM and 10.5 ± 1.3 μM for CaV3.3, at the Vh of –80 mV (F) and –50 mV (G), respectively (n = 5–9 cells). The CaV2.2 curves were included for comparison. All data are from at least 3 independent experiments.
Figure 2
Figure 2. Use- and state-dependent inhibition of CaV2.2 by C2230.
(A) Voltage protocols assessing activation (P1), steady-state inactivation (P2), the development of time-dependent inactivation (P3) of CaV2.2 channels. (B) CaV2.2 current-voltage relationships before (DMSO 0.1%) and after C2230 (10 μM) treatment. Currents in each recording cell were normalized to the maximum peak current before C2230 treatment (blue and orange solid curves) or its own maximum peak current (orange dashed curve) (n = 13 cells). (C) Steady-state activation and inactivation relationships of CaV2.2 channels in the absence and presence of 10 μM C2230 (n = 12 cells). (D) Time-dependent development of CaV2.2 channels’ closed-state inactivation in the absence and presence of 20 μM C2230 (n = 12–13 cells, P values as indicated, Unpaired t test). (E and F) Mean normalized current traces (left) and bar graphs (right) of τ of inactivation (s) at Vh of –80 mV (E) and –50 mV (F) (n = 8–10 cells, P values as indicated, Paired t test). (G) Time-dependent current decay of CaV2.2 channels during 60 consecutive step depolarizations at frequencies of 1, 3, and 10 Hz, with and without 10 μM C2230. The upper panel depicts the typical current traces at the first and the 60th depolarization in each group (n = 9–11 cells) while the summary data is shown in the lower panels. (H) Time-dependent recovery of CaV2.2 channels from inactivated state as evaluated using the voltage protocol (upper panel; n = 14 cells) with the time constants for fast recovery (τfast) and slow recovery (τslow) being increased from 0.151 ± 0.022 s to 0.232 ± 0.026 s, and 5.719 ± 1.079 s to 9.382 ± 1.079 s by C2230 treatment, respectively (P < 0.05 for both τfast and τslow comparisons, Mann-Whitney test). The proportion of fast recovering channels were reduced in the C2230 group compared with that in the DMSO group (66.7 ± 3.0% to 42.4 ± 2.0%; P < 0.001; Mann-Whitney test). All data are from at least 3 independent experiments. See Supplemental Table 3 for full statistical analysis.
Figure 3
Figure 3. C2230 inhibits CaV2.2 (N-type) calcium currents and total calcium currents in rat and human dorsal root ganglia sensory neurons, respectively.
(A) Representative traces of N-type calcium currents from rat dorsal root ganglion (DRGs) neurons incubated with 0.1% DMSO (control; blue circles), 5 μM C2230 (orange squares), 10 μM C2230 (purple diamonds) and 50 μM C2230 (pink triangles). (B) Summary of N-type ICa2+ current density-voltage relationship. (C) Bar graphs of peak N-type ICa2+ density from rat DRGs pretreated as indicated. P values as indicated, Kruskal-Wallis test followed by Dunn’s post hoc test, n = 6–28 cells per condition from 3 independent experiments. (D) Paired-pulse voltage protocol for evaluating the possible GPCR-mediated inhibition on CaV currents, in which the +100 mV/100 ms strong depolarization was used to drive Gβγ dissociation from the CaV channels. (E) Typical DRG total CaV current traces elicited by the paired-pulse voltage protocol in (D), in the absence (DMSO) or presence of 20 μM C2230. (F) Summary I2/I1 ratio in (E) (P values as indicated, Mann-Whitney test n = 6–7 from 2 independent experiments). (G) Representative traces of total calcium currents from human DRGs incubated with 0.1% DMSO (control; blue circles) or 20 μM C2230 (orange squares). (H) Summary of total ICa2+ current density-voltage relationship. (I) Bar graphs of peak total ICa2+ density from human DRGs pretreated as indicated. P values as indicated, Mann-Whitney test, n = 6–7 cells per condition from 1 independent experiment. Error bars indicate mean ± SEM. See Supplemental Table 3 for full statistical analysis.
Figure 4
Figure 4. C2230 inhibits total calcium currents in rat and marmoset trigeminal sensory neurons.
(A) Representative traces of total calcium currents from rat trigeminal ganglia (TG) neurons treated with 0.1% DMSO (control; blue), 20 μM C2230 (orange), 500 nM ω-conotoxin-GVIA (ω-Ctx-GVIA; burgundy), C2230 + ω-Ctx-GVIA (green), or ω-Ctx-GVIA + C2230 (dark purple). (B) Summary of total ICa2+ density-voltage relationship. (C) Bar graphs of peak total ICa2+ density from rat TGs -treated as indicated. P values as indicated, Kruskal-Wallis test followed by Dunn’s post hoc test, n = 9–13 cells per condition from 3 independent experiments. (D) Time-course of CaV2.2 current inhibition by sequential perfusion of C2230 and ω-Ctx-GVIA. Inset: Bar graph illustrating the normalized current (Norm I) of each condition at the indicated time points. P values as indicated, 1-way ANOVA followed by Tukey multiple comparison test, n = 3–5 cells per condition from 2 independent experiments. (E) Time-course of CaV2.2 currents inhibition by sequential perfusion of ω-Ctx-GVIA and C2230 perfusion. Inset: Bar graph illustrating the normalized current (Norm I) at the time points as indicated. P values as indicated, 1-way ANOVA followed by Tukey multiple comparison test, n = 5 cells per condition from 2 independent experiments. (F) Representative traces of total calcium currents from marmoset TGs incubated with 0.1% DMSO (control; blue circles), 20 μM C2230 (orange squares), or 500 nM ω-Ctx-GVIA (burgundy hexagons). (G) Summary of total ICa2+ density-voltage relationship. (H) Bar graphs of peak total ICa2+ density from marmoset TGs pretreated as indicated. P values as indicated, Kruskal-Wallis test followed by Dunn’s post hoc test, n = 10–13 cells per condition from 1 independent experiment. Error bars indicate mean ± SEM. See Supplemental Table 3 for full statistical analysis.
Figure 5
Figure 5. C2230 decreases spinal cord neurotransmission.
(A) KCl (90 mM) depolarization-evoked immunoreactive calcitonin gene-related peptide (iCGRP) release was measured from spinal cords isolated from naive female rats following 10 minutes preincubation with 0.1% DMSO (control) or 20 μM of C2230. Bar graph showing iCGRP levels observed in bath solution normalized to the weight of each spinal cord section. Fraction 1, Baseline 1 measurement; Fraction 2, Baseline 2 measurement; Fraction 3, Treatment with vehicle and C2230; Fraction 4, Treatment with vehicle and C2230 + 90 mM KCl; Fraction 5, Wash 1; Fraction 6, Wash 2. P value as indicated; 2-way ANOVA with Šidák’s multiple comparisons test; n = 3 rats. (B) Cartoon representation of the electrophysiology setup used to measure evoked excitatory postsynaptic currents (eEPSCs) in spinal cord slices. A stimulus (~200 μA, 0.1 ms) was applied to the tract of Lissauer via a bipolar microelectrode connected to a flexible stimulus isolator. eEPSCs were recorded from neurons located in the substantia gelatinosa (lamina I/II). (C) Representative traces of eEPSCs recorded in the presence of 0.1% DMSO (control) or 20 μM of C2230. (D) Bar graph showing the amplitude of eEPSCs for these 2 conditions. P value as indicated; paired t test; n = 5 cells from 1 independent experiment. Data are expressed as mean ± SEM. See Supplemental Table 3 for full statistical analysis.
Figure 6
Figure 6. Intraperitoneal administration of C2230 induces reversal of pain-like behaviors induced by spinal nerve ligation in male and female mice.
(A) Spinal nerve ligation (SNL) model schematic and timeline of the experimental approach used to determine the antinociceptive effects induced by C2230 on tactile and cold allodynia. Dose-response curves of the paw withdrawal mechanical threshold measurements after i.p. administration of vehicle or C2230 in male (B) and female (D) mice; n = 8 mice per group. Quantification of the area under the curve (AUC) of panels B and D between the baseline and 6 hours after i.p. injection in male (C) and female (E) mice, respectively. P values as indicated by 1-way ANOVA followed by Dunnett post hoc test; n = 8 mice per group. Dose-response curves of the aversion time to acetone stimulation after vehicle or C2230 i.p. administration in male (F) and female (H) mice. Quantification of the AUC of F and H between baseline and 6 hours after i.p. injection in male (G) and female (I) mice. P values as indicated; 1-way ANOVA followed by Dunnett post hoc test; n = 8 mice per group; values are expressed as mean ± SEM. See Supplemental Table 3 for full statistical analysis.
Figure 7
Figure 7. Repeated administration of C2230 maintains long-term efficacy in alleviating neuropathic pain–like behavior without the development of tolerance.
(A) Timeline for spared nerve injury (SNI) or sham surgery and repeated administration of C2230 (i.p.; 10 mg/kg). (B) Time course of von Frey mechanical thresholds after i.p. administration of vehicle or C2230. C2230 is efficacious at alleviating SNI-induced mechanical hypersensitivity at 3- 6- and 9-week timepoints. (C) Time course of aversion time responses after i.p. administration of vehicle or C2230. C2230 is efficacious at alleviating SNI-induced cold hypersensitivity at 3- 6- and 9-week timepoints; n = 8–10 mice/group. 2-way repeated measures (RM) ANOVA with Dunnnet’s post hoc test. Data are shown as means ± SEM. ****P < 0.0001. See Supplemental Table 3 for full statistical analysis.
Figure 8
Figure 8. Intraperitoneal administration of C2230 (10 mg/kg) reduces spared nerve injury–induced increases in glutamatergic parabrachial nucleus activity.
(A) Timeline schematic describing the order of events in parabrachial nucleus (PBN) recording experiments. (B) Representative viral expression and fiber track in the PBN. Change in the activity of GCamp6s in glutamatergic PBN neurons in response to 0.07 g or 1.0 g filament at baseline (C and G), after spared nerve injury (SNI) (D and H), 2 hours following i.p. administration of C2230 (10 mg/kg) (E and I) or vehicle (F and J). (K) Quantified AUC for GCamp6s activity in response to 0.07 g filament stimulation; mixed-effects analysis followed by Dunnett’s multiple comparisons test. P values as indicated, n = 9–11 mice. (L) Summary of peak change in fluorescence from baseline GCamp6s activity following 0.07 g stimulation; mixed-effects analysis followed by Dunnett’s multiple comparisons. P values as indicated, n = 9–11 mice. (M) Quantified AUC for GCamp6s activity in response to 1.0 g filament stimulation; mixed effect analysis followed by Dunnett’s multiple comparisons. P values as indicated, n = 9–11 mice. (N) Summary of peak change in fluorescence from baseline GCamp6s activity following 1.0 g stimulation; mixed effects analysis followed by Dunnett’s multiple comparisons. P values as indicated, n = 9–11 mice. Values are expressed as mean ± SEM. See Supplemental Table 3 for full statistical analysis.
Figure 9
Figure 9. Intraperitoneal administration of C2230 (10 mg/kg) decreases aversive responses to mechanical stimulation after SNL.
(A) Schematic timeline of the 2-chamber conditioned place aversion (CPA) test performed in SNL-injured rats. Quantification of the time spent in the vF-conditioned chamber (vF) and no stimuli (NS) chamber by vehicle-injected rats (B) and C2230-treated rats with SNL injury (C), respectively. (D) Quantification of CPA scores of vehicle-injected rats and C2230-treated rats with SNL injury. (E and F) Quantification of the traveled distance of vehicle-injected rats and C2230-treated rats with SNL injury during either the preconditioning or the test phase of the CPA protocol. P values as indicated; B and C: Bonferroni’s multiple comparison test. D: Unpaired t test; n = 12 rats per condition (6 male and 6 female mice); values are expressed as mean ± SEM. See Supplemental Table 3 for full statistical analysis.
Figure 10
Figure 10. Intranasal administration of C2230 (200 μg/20 μL) effectively alleviates pain-like behaviors induced by chronic constriction of the infraorbital nerve.
(A) Constriction of the infraorbital nerve (CION) model schematic and timeline of the experimental approach used to determine the antinociceptive effects of C2230. Time course of von Frey mechanical thresholds after i.n. administration of vehicle or C2230 in male (B) and female (D) rats; n = 8–10 rats per group. Quantification of the AUC of B and D between 17 days after CION and 3 hours after i.n. injection in male (C) and female (E) rats, respectively. P values as indicated, Mann-Whitney test; n = 8–10 rats per group. Time course of the pinprick response score after vehicle or C2230 i.n. administration in male (F) and female (H) rats. Quantification of the AUC of F and H between 17 days after CION and 3 hours after i.n. injection in male (G) and female (I) rats. P values as indicated, Mann-Whitney test; n = 8–10 rats per group. Values are expressed as mean ± SEM. See Supplemental Table 3 for full statistical analysis.
Figure 11
Figure 11. Intraperitoneal administration of C2230 (10 mg/kg) reverses monoiodoacetate-induced mechanical and cold allodynia.
(A) Schematic depicting the monoiodoacetate (MIA) model of OA-like pain and timeline of the experimental approach used to determine the antinociceptive effects of C2230 in mice with osteoarthritis. Time course of baseline mechanical withdrawal threshold measurements conducted before (pre-MIA), after (post-MIA), and every hour after injection, for male (B) and female (D) mice. Quantification of the AUC in B and D, respectively, between post MIA to 6 hours after i.p. injection in males (C) and females (E). P value as indicated; unpaired t test. n = 6 male and 6 female mice per experimental group. Time course of aversion time duration to the acetone assessed before (pre-MIA), after (post-MIA), and every 2 hours after injection for male (F) and female mice (H). Quantification of the AUC in F and H respectively between post-MIA to 6 hours after i.p. injection in males (G) and females (I). P value as indicated; unpaired t test; n = 6 male and 6 female mice per experimental group. Values are expressed as mean ± SEM. See Supplemental Table 3 for full statistical analysis.
Figure 12
Figure 12. C2230 does not affect sensitivity to mechanical, cold, or nociceptive heat stimulation, nor motor function.
(A) Left: Schematic representation and timeline of the experimental approach used to assess mechanical threshold and aversion time in naive mice following C2230 administration. Right: Schematic representation and timeline of the experimental approach used to evaluate thermal stimulation responses and motor function in naive mice 2 hours after C2230 administration. (B and F) Time course of von Frey mechanical thresholds after i.p. administration of vehicle or C2230 in naive male and female mice. (C and G) Time course of aversion time responses to an acetone drop following i.p. administration of vehicle or C2230 in naive male and female mice. P values as indicated; 2-way ANOVA followed by Bonferroni’s multiple comparison test; n = 8 mice per group. (D and H) Bar graphs showing withdrawal latency to a 52°C nociceptive stimulus in male and female naive mice 2 hours after C2230 injection. (E and I) Bar graphs representing latency to fall in the rotarod test for male and female naive mice 2 hours after C2230 injection. P values as indicated, Mann Whitney test; n = 8 mice per group. Values are expressed as mean ± SEM. See Supplemental Table 3 for full statistical analysis.
Figure 13
Figure 13. Locations of alanine-scanning mutation sites on CaV 2.2.
(A) Surface representation of the human CaV2.2 α subunit (PDB: 7VFV(40)) with bound PD173212 in stick representation. View facing the open D-III/D-IV fenestration. (B) Ribbon representation through the D-III/D-IV fenestration with the alanine mutation sites on the D-III S5, S6 and D-IV S6 helices shown as spheres. The mutations affecting inhibition by C2230 are shown as sticks and labeled according to their rat CaV2.2 sequence, with the corresponding human numbering in parentheses. Residues important for PD173212 binding (40) also shown as sticks and their labels are underlined. (C) Close up views showing all amino acids with their rat sequence numbers. (DF) Bar graphs of percent inhibition by 20 μM C2230 for alanine scan of D-III S5 (D), D-IV S6 (E), and D-III S6 (F) helices. Data in red bars indicate mutations affecting inhibition by C2230 versus WT while gray bars denote mutations that were not different from WT. Mutations of L1288A, A1294G, S1390A, F1404A, and F1683A significantly reduced inhibition C2230 when compared with the WT. Channels were clamped at –80 mV and currents were elicited by depolarization to + 10 mV. P values are as indicated, Kruskal-Wallis test followed by Dunn’s post hoc test; n = 4–12 cells from 2–3 independent experiments. (G) The fold change in IC50 values for C2230 inhibiting the specified mutants is presented relative to its inhibition of the WT CaV 2.2 channel, assessed at holding potentials of –80 mV and –50 mV. Note the IC50s of C2230 on these mutants at –80 mV holding potential were calculated using the Hill equation (IC50 = [C2230] × Ires/(1 – Ires)), where Ires for each mutant equals to ‘1 – inhibition ratio’ as determined in DF. The IC50s of C2230 on these mutants at –50 mV holding, however, were experimentally determined (n = 5–6). See Supplemental Table 3 for full statistical analysis.

Comment in

  • The N-type calcium channel rises from the ashes

References

    1. Deng Y, et al. Clinical practice guidelines for the management of neuropathic pain: a systematic review. BMC Anesthesiol. 2016;16:12. doi: 10.1186/s12871-015-0150-5. - DOI - PMC - PubMed
    1. Hoppanova L, Lacinova L. Voltage-dependent CaV3.2 and CaV2.2 channels in nociceptive pathways. Pflugers Arch. 2022;474(4):421–434. doi: 10.1007/s00424-022-02666-y. - DOI - PubMed
    1. Heinke B, et al. Pre- and postsynaptic contributions of voltage-dependent Ca2+ channels to nociceptive transmission in rat spinal lamina I neurons. Eur J Neurosci. 2004;19(1):103–111. doi: 10.1046/j.1460-9568.2003.03083.x. - DOI - PubMed
    1. Winquist RJ, et al. Use-dependent blockade of Cav2.2 voltage-gated calcium channels for neuropathic pain. Biochem Pharmacol. 2005;70(4):489–499. doi: 10.1016/j.bcp.2005.04.035. - DOI - PubMed
    1. Kim C, et al. Altered nociceptive response in mice deficient in the alpha(1B) subunit of the voltage-dependent calcium channel. Mol Cell Neurosci. 2001;18(2):235–245. doi: 10.1006/mcne.2001.1013. - DOI - PubMed

LinkOut - more resources