. 2024 Dec 10;10(2):e169836.
doi: 10.1172/jci.insight.169836.

Treg cells promote decidual vascular remodeling and modulate uterine NK cells in pregnant mice

Affiliations

Treg cells promote decidual vascular remodeling and modulate uterine NK cells in pregnant mice

Shanna L Hosking et al. JCI Insight. .

Abstract

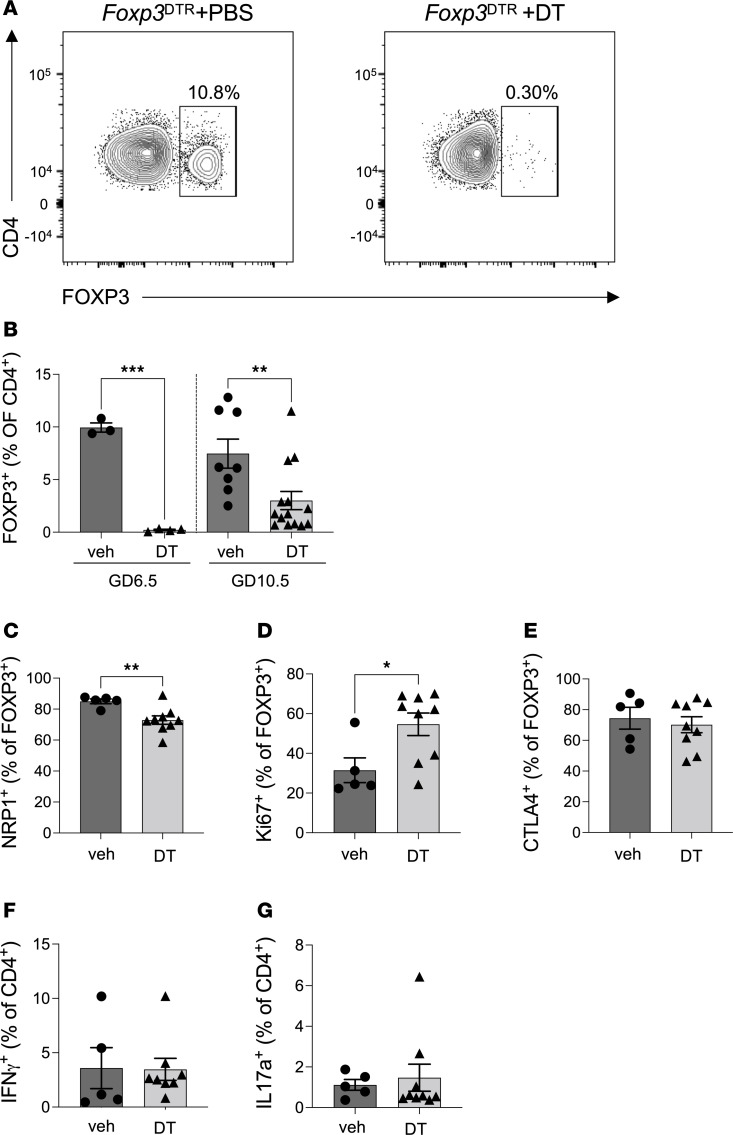
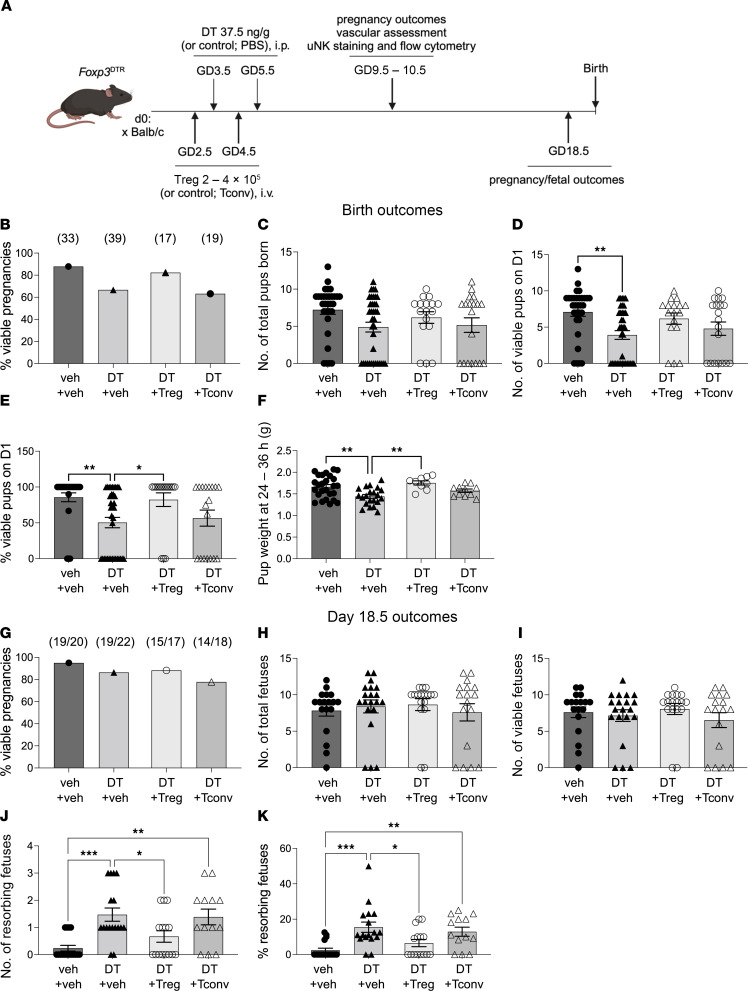
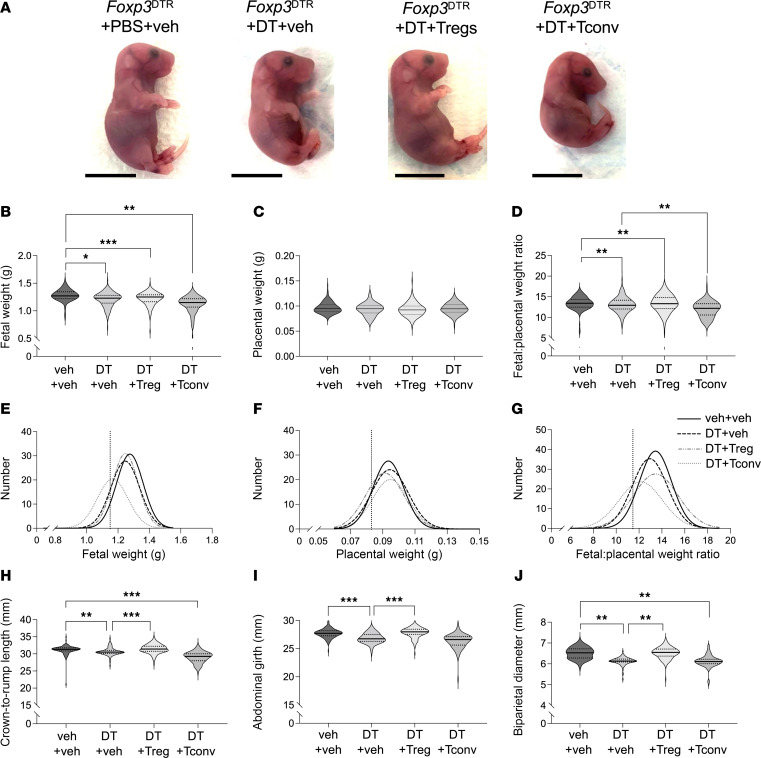
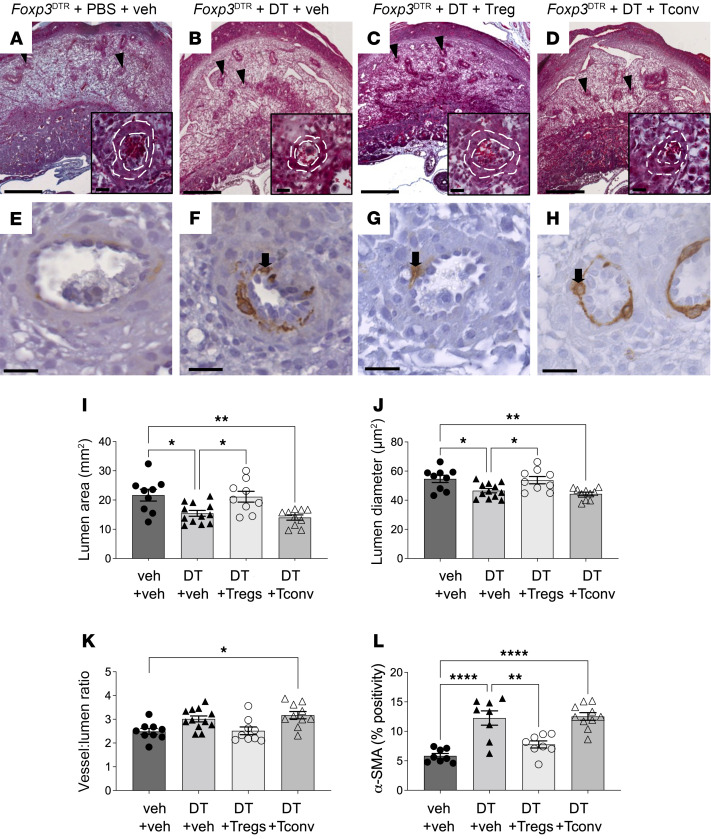
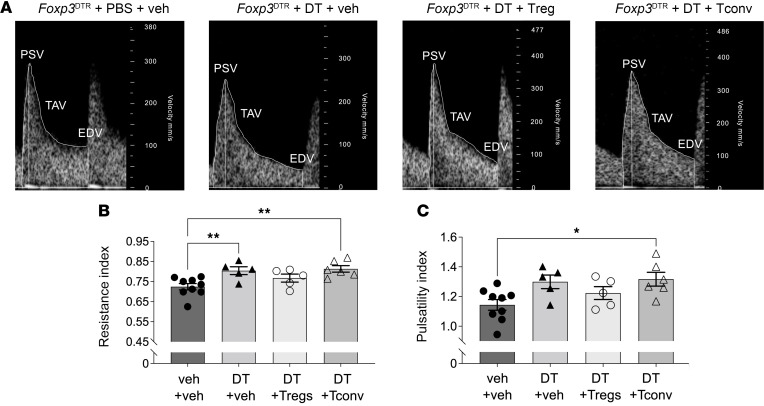
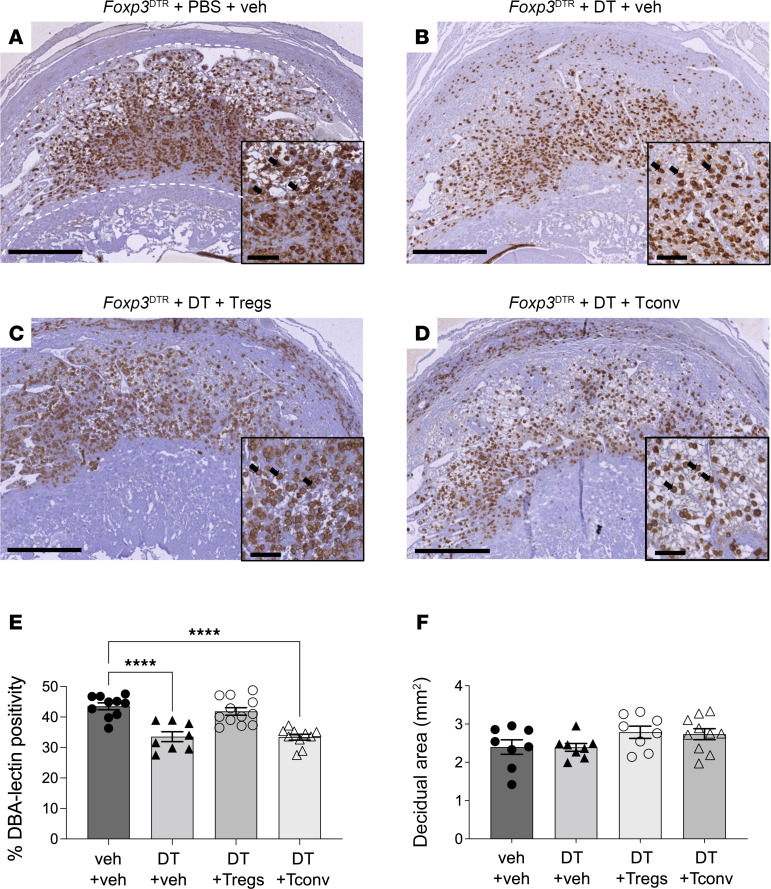
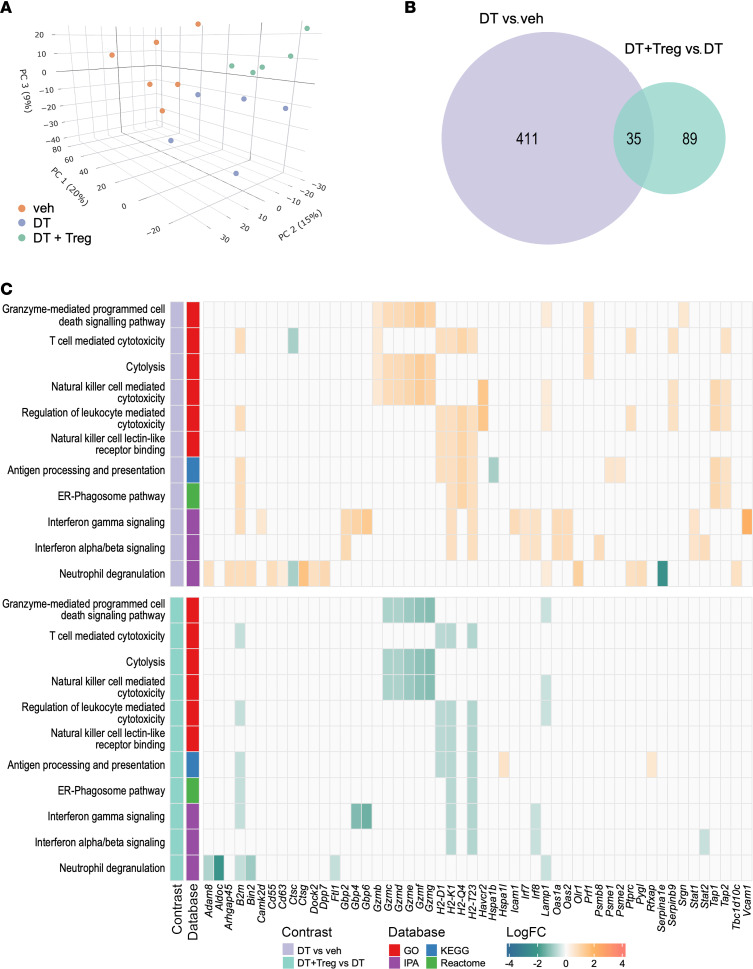
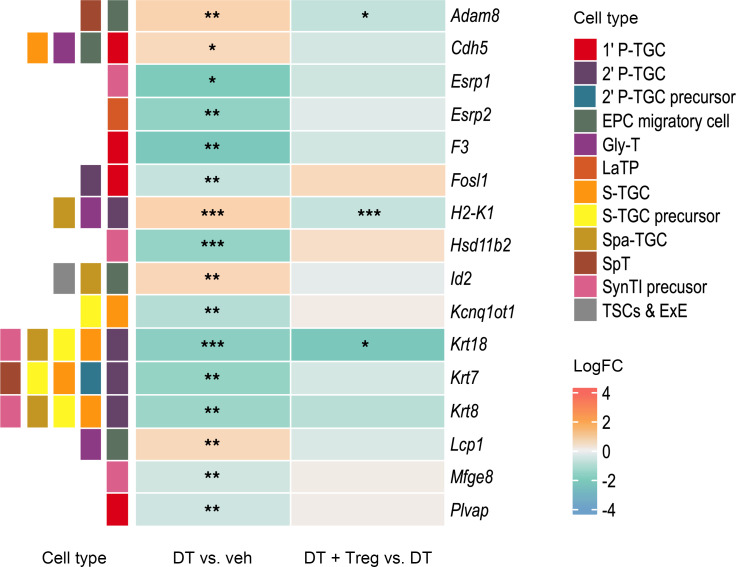
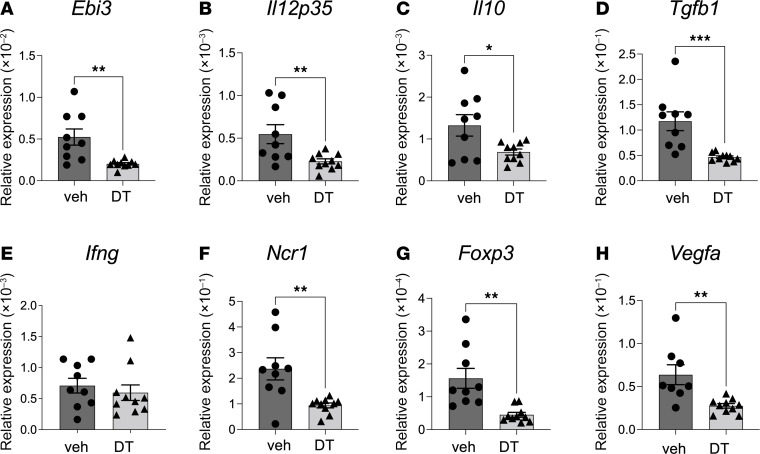
Regulatory T (Treg) cells are essential for maternal immune tolerance of the fetus and placenta. In preeclampsia, aberrant Treg cell tolerance is implicated, but how Treg cells affect the uterine vascular dysfunction thought to precede placental impairment and maternal vasculopathy is unclear. We used Foxp3-diphtheria toxin receptor mice to test the hypothesis that Treg cells are essential regulators of decidual spiral artery adaptation to pregnancy. Transient Treg cell depletion during early placental morphogenesis caused impaired remodeling of decidual spiral arteries, altered uterine artery function, and fewer Dolichos biflorus agglutinin+ uterine natural killer (uNK) cells, resulting in late-gestation fetal loss and fetal growth restriction. Replacing the Treg cells by transfer from wild-type donors mitigated the impact on uNK cells, vascular remodeling, and fetal loss. RNA sequencing of decidua revealed genes associated with NK cell function and placental extravillous trophoblasts were dysregulated after Treg cell depletion and normalized by Treg cell replacement. These data implicate Treg cells as essential upstream drivers of uterine vascular adaptation to pregnancy, through a mechanism likely involving phenotypic regulation of uNK cells and trophoblast invasion. The findings provide insight into mechanisms linking impaired adaptive immune tolerance and altered spiral artery remodeling, 2 hallmark features of preeclampsia.

Keywords: Immunology; NK cells; Obstetrics/gynecology; Reproductive biology; T cells.


Figures

Figure 1
Figure 1. Effect of DT administration to Foxp3DTR mice in the peri-implantation period on uDLN Treg cell proportion and phenotype in midgestation.
Foxp3DTR mice were administered PBS (veh) or DT i.p. on GD3.5 and GD5.5. uDLNs were recovered on GD6.5 or GD10.5, and the proportion and phenotype of CD4+FOXP3+ Treg cells were evaluated using flow cytometry. (A) Representative contour plots show the proportion of CD4+FOXP3+ Treg cells in the uDLNs on GD6.5 from vehicle-treated (left) and DT-treated (right) Foxp3DTR mice. (B) The proportions of CD4+FOXP3+ Treg cells in uDLNs at GD6.5 and GD10.5. Detailed analysis of Treg cells at GD10.5 shows the proportion of Treg cells expressing NRP1 indicating thymic origin (C), proliferation marker Ki67 (D), and marker of suppressive competence CTLA4 (E). The proportion of IFN-γ+CD4+FOXP3 (Th1 cells; F) and IL-17a+CD4+FOXP3 (Th17 cells; G) were measured. N = 3–14 mice per group. Data are mean ± SEM. Data points are values from individual dams. Analysis was by 2-tailed t test or Mann-Whitney U test depending on normality of data distribution for data in CG. Data in B were analyzed using a 1-way ANOVA comparing samples within the same gestational day. *P < 0.05; **P < 0.01; ***P < 0.001.
Figure 2
Figure 2. Treg cell depletion in the peri-implantation period results in reduced litter size at birth and increased fetal loss in late gestation and is mitigated by Treg cell transfer.
Foxp3DTR mice were administered PBS (veh) or DT i.p. on GD3.5 and GD5.5, and then pregnancy outcomes were assessed either at birth (BF) or on GD18.5 (GJ). Some mice also received WT Treg cells or Tconv cells on GD2.5 and GD4.5. (A) Schematic diagram showing the treatment and analysis protocol (created with BioRender.com). (B) Proportion of mated mice that delivered at least 1 viable pup at birth. (C) Total number of pups at birth per dam. (D) Number of viable pups within 24 hours of birth per dam. (E) Proportion of viable pups within 24 hours of birth per dam. (F) Pup weight at 24–36 hours after birth. (G) The proportion of dams carrying a viable pregnancy at GD18.5 (defined as at least 1 viable implantation site). (H) Number of total fetuses per dam at GD18.5. (I) Number of viable fetuses per dam at GD18.5. (J) Number and (K) proportion of resorbing fetuses per dam at GD18.5. Numbers of mice (B) and dams (G) in each group are shown in parentheses. Data are mean ± SEM. Data points are values from individual dams. Analysis was by χ2 test (B and G) or 1-way ANOVA with 2-tailed post hoc t test (CF and HK). *P < 0.05; **P < 0.01; ***P < 0.001.
Figure 3
Figure 3. Treg cell depletion in the peri-implantation period causes fetal growth restriction that is mitigated by Treg cell transfer.
Foxp3DTR mice were administered PBS (veh) or DT i.p. on GD3.5 and GD5.5, and then fetal and placental development were assessed on GD18.5. Some mice also received WT Treg cells or Tconv cells on GD2.5 and GD4.5. (A) Representative images of fetuses, (B) fetal weight, (C) placental weight, and (D) fetal/placental weight ratio. The distribution of (E) fetal weights, (F) placental weights, and (G) fetal/placental weight ratio. (H) Fetal crown-to-rump length, (I) abdominal girth, and (J) biparietal diameter. Vertical dashed line represents the 10th centile of the curve (1.15, 0.08, and 11.45 g in EG, respectively). N = 2–11 fetuses from 14–19 dams per group. Fetal and placental data are shown as violin plots with median and quartile values marked. Analysis was by mixed-model ANOVA with mother as subject and litter size as covariate. *P < 0.05; **P < 0.01; ***P < 0.001. Scale bar = 1 cm.
Figure 4
Figure 4. Treg cell depletion impairs spiral artery remodeling in midgestation.
Pregnant Foxp3DTR mice were administered PBS (veh) or DT i.p. on GD3.5 and GD5.5, and then tissues were collected on GD10.5. Some mice also received WT Treg cells or Tconv cells on GD2.5 and GD4.5, and then tissues were collected on GD10.5. Representative images of midsagittal sections of uterus stained with Masson’s trichrome (AD) or to detect α-SMA (EH). Black arrowheads indicate spiral arteries, black arrows indicate α-SMA+ cells. Parameters including (I) average lumen area of spiral arteries, (J) lumen diameter, (K) vessel/lumen area ratio, and (L) proportion of decidual cells positive for α-SMA are shown. N = 2 implantation sites per dam from 8–12 dams per group. Data are mean ± SEM. Data points are average values for individual dams. Analysis was by 1-way ANOVA with 2-tailed post hoc t test. *P < 0.05; **P < 0.01; ****P < 0.0001. Scale bars, AD = 1 mm; insets = 50 μm; EH = 50 μm.
Figure 5
Figure 5. Uterine artery resistance in midgestation is increased by Treg cell depletion and mitigated by Treg cell replacement.
Pregnant Foxp3DTR mice were administered PBS (veh) or DT i.p. on GD3.5 and GD5.5, and then tissues were collected on GD10.5. Some mice also received WT Treg cells or Tconv cells on GD2.5 and GD4.5. Measurements were taken on GD9.5. (A) Representative waveforms of uterine arteries. (B) Resistance index and (C) pulsatility index were calculated. N = 5–8 dams per group. Data are mean ± SEM. Data points are average values for individual dams. Analysis was by 1-way ANOVA with 2-tailed post hoc t test. EDV, end-diastolic velocity; PSV, peak systolic velocity; TAV, time-averaged velocity. *P < 0.05; **P < 0.01.
Figure 6
Figure 6. Treg cell depletion causes a reduction in DBA+ uNK cells in midgestation that is mitigated by Treg cell transfer.
Pregnant Foxp3DTR mice were administered PBS (veh) or DT i.p. on GD3.5 and GD5.5, and then tissues were collected on GD10.5. Some mice also received WT Treg cells or Tconv cells on GD2.5 and GD4.5. Tissues were collected on GD10.5. (AD) Decidual tissue sections were labeled with biotinylated DBA-lectin to detect the DBA+ subset of uNK cells that predominates in pregnancy (brown stain, arrows). (E) The percentage positivity for DBA+ uNK cells was quantified. (F) The decidual region of each section (marked, dotted line in A) was identified and measured. N = 2 implantation sites per dam, 8–12 dams per group. Data are mean ± SEM. Data points are average values for individual dams. Analysis was by 1-way ANOVA with 2-tailed post hoc t test. ****P < 0.0001. Scale bars: 500 μm; insets = 100 μm.
Figure 7
Figure 7. Treg cell depletion causes a perturbation in decidual transcription profile in midgestation that is mitigated by Treg cell transfer.
Pregnant Foxp3DTR mice were administered PBS (veh; n = 6) or DT (n = 5) i.p. on GD3.5 and GD5.5, and decidual tissue was collected on GD10.5. Some mice (n = 5) also received WT Treg cells on GD2.5 and GD4.5. (A) PCA of filtered genes, illustrating gene expression patterns in individual samples. (B) The number of DEGs (FDR < 0.1) that overlap between DT-treated mice compared with PBS vehicle control– (purple) and DT+Treg–treated mice compared with DT-treated mice (green). (C) Functional heatmap of DEGs (FDR < 0.1) and their relationship to enriched terms/pathways identified using Gene Ontology (GO, FDR < 0.05), Kyoto Encyclopedia of Genes and Genomes (KEGG, FDR < 0.2), Reactome (FDR < 0.1), and Ingenuity Pathway Analysis (IPA, P < 0.05) databases.
Figure 8
Figure 8. Treg cell depletion causes a perturbation in decidual trophoblast genes in midgestation that is mitigated by Treg cell transfer.
Pregnant Foxp3DTR mice were administered PBS (veh; n = 6) or DT (n = 5) i.p. on GD3.5 and GD5.5, and decidual tissue was collected on GD10.5. Some mice (n = 5) also received WT Treg cells on GD2.5 and GD4.5. Functional heatmap of DEGs (FDR < 0.1) identified as indicative of altered extravillous trophoblasts on the basis of both (a) reported expression in specific mouse trophoblast cell types (color coded, LHS) (extracted from published single-cell RNA-sequencing data) (66) and (b) expression in mouse placenta but not mouse uterus, according to Mouse Genomics Informatics database (see Methods for details). Cell labels indicate the FDR-adjusted P value (FDR) of DEGs present in the RNA-sequencing dataset. *FDR < 0.1; **FDR < 0.05; ***FDR < 0.01. 1’ P-TGC, primary parietal trophoblast giant cell; 2’ P-TGC, secondary parietal trophoblast giant cells; EPC, ectoplacental cone; Gly-T, glycogen trophoblast cells; LaTP, labyrinthine trophoblast; S-TGC, sinusoid trophoblast giant cell; Spa-TGC, spiral artery-associated trophoblast giant cell; SpT, spongiotrophoblast cell; SynT1, multinucleated syncytiotrophoblast cells; TSC, trophoblast stem cell; ExE, extraembryonic ectoderm.
Figure 9
Figure 9. Peri-implantation Treg cell depletion elicits reduction of antiinflammatory decidual gene transcripts.
Pregnant Foxp3DTR mice were given PBS (veh) or DT on GD3.5 and GD5.5, and then tissues were collected on GD10.5. (A) Ebi3, (B) Il12p35 genes encoding IL-35, (C) Il10, (D) Tgfb1, (E) Ifng, (F) Ncr1 encoding NKp46, (G) Foxp3 encoding FOXP3 transcription factor necessary for Treg cell development, and (H) Vegfa were quantified by qPCR. N = 9–10 dams per group. Data are presented as mean ± SEM. Each data point represents the average of 2 decidua per dam. Analysis was by unpaired 2-tailed t test. *P < 0.05; **P < 0.01; ***P < 0.001.
Figure 10
Figure 10. Schematic illustration of current working hypothesis on mechanisms of Treg cell–mediated regulation of decidual spiral artery remodeling.
Treg cells modulate the decidual microenvironment to facilitate decidual spiral artery remodeling in early pregnancy in mice. When Treg cells are deficient, spiral artery remodeling is impaired. In turn this causes fetal growth restriction and late-gestation fetal loss that is exacerbated by increased resistance to blood flow in the uterine arteries. Treg cell support of spiral artery remodeling is likely to be mediated through Treg cell effects in a decidual network involving uNK cells and trophoblasts. Our data show reduced numbers of DBA+ uNK cells, and attenuation of genes associated with uNK cell function and extravillous trophoblast invasion. Since uNK cells are known to be essential for spiral artery remodeling through IFN-γ and VEGF production, and Treg cells produce cytokines TGF-β, IL-10, and IL-35 known to regulate uNK cell function, a direct effect of Treg cells on uNK cells is implicated. Altered extravillous trophoblast invasion and/or survival in the decidua may also be involved, since extravillous trophoblasts interact with uNK cells and contribute to spiral artery remodeling. See text for details. Created with BioRender.com.

Similar articles

Cited by

References

    1. Vignali DAA, et al. How regulatory T cells work. Nat Rev Immunol. 2008;8(7):523–532. doi: 10.1038/nri2343. - DOI - PMC - PubMed
    1. Robertson SA, et al. Regulatory T cells in embryo implantation and the immune response to pregnancy. J Clin Invest. 2018;128(10):4224–4235. doi: 10.1172/JCI122182. - DOI - PMC - PubMed
    1. Erlebacher A. Mechanisms of T cell tolerance towards the allogeneic fetus. Nat Rev Immunol. 2013;13(1):23–33. doi: 10.1038/nri3361. - DOI - PubMed
    1. Aluvihare VR, et al. Regulatory T cells mediate maternal tolerance to the fetus. Nat Immunol. 2004;5(3):266–271. doi: 10.1038/ni1037. - DOI - PubMed
    1. Shima T, et al. Regulatory T cells are necessary for implantation and maintenance of early pregnancy but not late pregnancy in allogeneic mice. J Reprod Immunol. 2010;85(2):121–129. doi: 10.1016/j.jri.2010.02.006. - DOI - PubMed

LinkOut - more resources