. 2024 Dec 24;43(12):115046.
doi: 10.1016/j.celrep.2024.115046. Epub 2024 Dec 9.

Spinal microcircuits go through multiphasic homeostatic compensations in a mouse model of motoneuron degeneration

Affiliations

Spinal microcircuits go through multiphasic homeostatic compensations in a mouse model of motoneuron degeneration

Filipe Nascimento et al. Cell Rep. .

Abstract

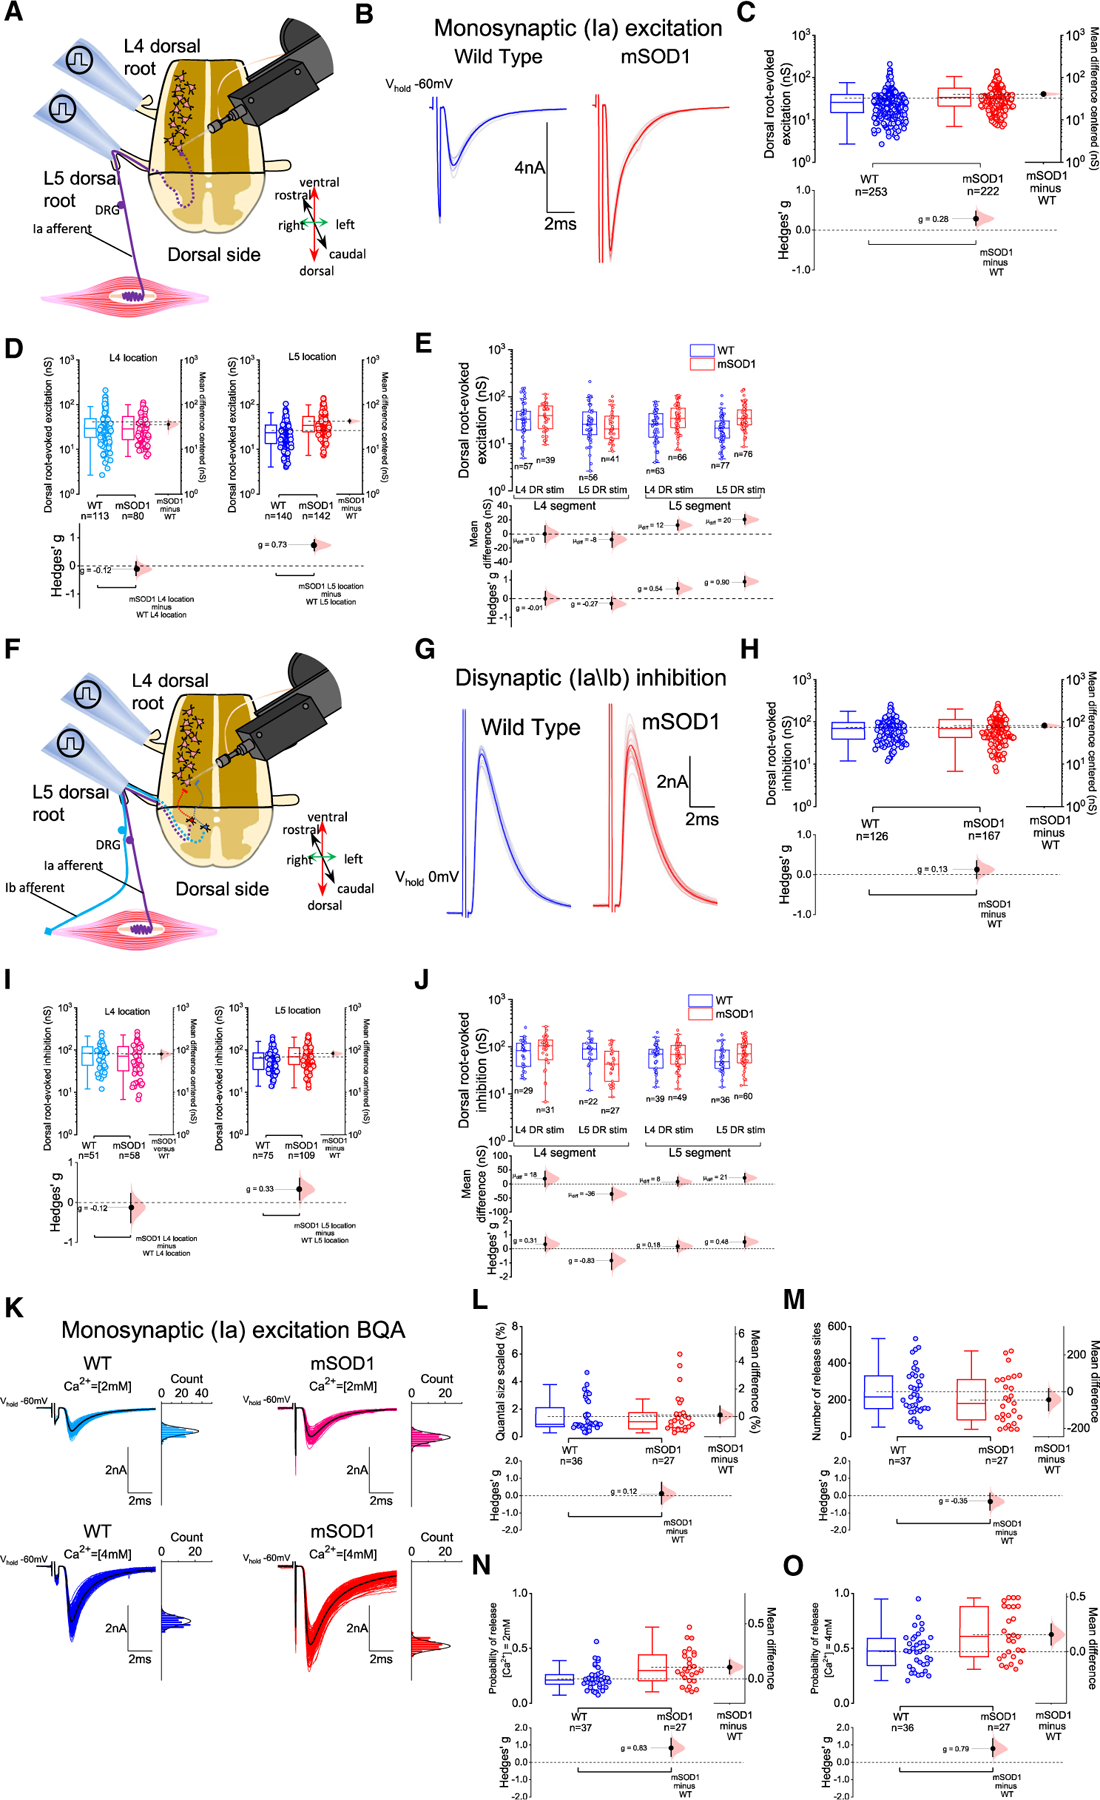
In many neurological conditions, early-stage neural circuit adaptation preserves relatively normal behavior. In some diseases, spinal motoneurons progressively degenerate yet movement remains initially preserved. This study investigates whether these neurons and associated microcircuits adapt in a mouse model of progressive motoneuron degeneration. Using a combination of in vitro and in vivo electrophysiology and super-resolution microscopy, we find that, early in the disease, neurotransmission in a key pre-motor circuit, the recurrent inhibition mediated by Renshaw cells, is reduced by half due to impaired quantal size associated with decreased glycine receptor density. This impairment is specific and not a widespread feature of spinal inhibitory circuits. Furthermore, it recovers at later stages of disease. Additionally, an increased probability of release from proprioceptive afferents leads to increased monosynaptic excitation of motoneurons. We reveal that, in this motoneuron degenerative condition, spinal microcircuits undergo specific multiphasic homeostatic compensations that may contribute to preservation of force output.

Keywords: ALS; CP: Cell biology; CP: Neuroscience; Renshaw cells; electrophysiology; glycine receptors; motoneurons; motor control; quantal analysis; sensory afferents; spinal cord.


Conflict of interest statement

Declaration of interests R.M.B. is a co-founder, is on the board of Sania Therapeutics Inc., and consults for Sania Rx Ltd.

Figures

Figure 1.
Figure 1.. Motoneuron active and passive properties are not substantially altered in early-juvenile mSOD1 mice
(A) Differential contrast imaging (DIC) of early-juvenile motoneurons (P21) from oblique slices. (B) Early- and delayed-firing profiles used to distinguish between “slow” and “fast” motoneurons. (C) Motoneuron response to increasing steps of injected current used to study repetitive firing properties (for simplicity, the scales of the y axis of the last two instantaneous firing plots do not include the value of first to second spike interval). (D–F) Examples of (D) an individual action potential with respective voltage derivative (dV/dt) against voltage plot; (E) amplitude, rise, and decay time parameters; and (F) mAHP analyses used to extract information on action potential properties. (G and H) Heatmaps illustrating absolute mean value of bootstrapped Hedges’ g effect-size comparisons between early- and delayed-firing motoneurons from WT and mSOD1 mice for (G) subthreshold and repetitive firing and (H) spike properties. Yellow boxes highlight comparisons for which bootstrapped 95% confidence interval did not include 0. See also Figures S1 and S2 and Tables S1 and S2.
Figure 2.
Figure 2.. Recurrent inhibition is halved in delayed-firing motoneurons of early-juvenile mSOD1 animals
(A) Schematic of the oblique spinal cord slice preparation used to obtain whole-cell patch-clamp recordings from motoneurons. (B) Examples of ventral-root-evoked recurrent excitatory EPSCs recorded from motoneurons (at 3–5× the threshold required for an initial synaptic response). (C) Estimation plots for absolute recurrent excitation. (D) Examples of current-voltage responses obtained before and during high-frequency ventral-root stimulation (200 Hz) used to measure recurrent inhibition. Zoomed-in box (WT early trace) illustrates example IPSPs evoked during the train. (E) Plots for absolute synaptic conductances for recurrent inhibition. Estimation plots with all individual values and respective boxplots shown along with respective bootstrapped mean difference and bootstrapped Hedges’ g. See also Table S3.
Figure 3.
Figure 3.. Motoneuron input to Renshaw cells is preserved in early-juvenile mSOD1 mice
(A–C) (A) Schematic of the oblique spinal cord slice preparation now used to target Renshaw cells, identified as (B) GlyT2 EGFP+ cells located in the most ventral area of lamina VIII that (C) receive ventral-root-evoked excitation. (D) Group data obtained for absolute synaptic conductances for both WT and mSOD1 mice. (E) Representative traces showing EPSPs recorded from Renshaw cells in the presence of 2 mM (top) and 1 mM (bottom) Ca2+, next to respective histogram count, that were used to perform BQA (sweeps were baselined for representation purposes and black IPSP represents averaged trace). (F–I) Group plots showing data obtained from BQA on parameters such as (F) quantal size, (G) number of release sites, and probabilities of release with (H) 2 mM and (I) 1 mM extracellular Ca2+. Estimation plots with all individual values and respective boxplots shown along with respective bootstrapped mean difference and bootstrapped Hedges’ g. See also Table S4.
Figure 4.
Figure 4.. Impairment in recurrent inhibition in early-juvenile mSOD1 mice is due to a reduction in quantal size at Renshaw cell to motoneuron contacts, which is associated with decreased number of postsynaptic GlyRs per bouton
(A) Examples of IPSPs (baseline adjusted for representation) to ventral-root-stimulation obtained from motoneurons in the presence of 4 and 2 mM extracellular Ca2+, next to respective histogram counts. (B–E) BQA parameters for quantal size, number of release sites, and probability of release for (D) 2 mM and (E) 4 mM extracellular Ca2+. (F) Examples of voltage-clamp motoneuron responses to 200-Hz ventral-root stimulation without (left) and with 4 mM Sr2+ (right), a large ion that extends synaptic release, thus allowing detection of asynchronous IPSCs (aIPSCs) following extracellular stimulation (see zoomed-in window). (G) Estimation plots for of aIPSC amplitude conductance. (H) Examples of P21 mice identified Renshaw cell boutons (GlyT2+ and Calbindin+) juxtaposed to motoneurons (vAChT), with labeled clusters of GlyRs (GlycineR) for both control (left) and mSOD1 (right) mice. Top row shows motoneuron somata. The boxes in the top row indicate the position of the two boutons highlighted in the bottom row (represented rotated). (I–K) Group data for (I) GlyR area, (J) perimeter, and (K) number per bouton. Estimation plots with all individual values and respective boxplots shown with respective bootstrapped mean difference and bootstrapped Hedges’ g for (B–E) plots and Kernel smooth distribution with respective linear mixed-model (LMM) estimates shown for plots (I–K). Hierarchical bootstrap used for (G) with mean amplitude per motoneuron used in boxplots. See also Tables S5 and S6 and Figure S7.
Figure 5.
Figure 5.. Monosynaptic Ia excitation received by motoneurons is increased in early-juvenile mSOD1 mice due to higher probability of release from Ia afferents, but disynaptic Ia/Ib inhibition remains unchanged
(A) Schematic of the partially ablated ventral horn in vitro longitudinal spinal cord preparation with L4 and L5 segments and roots intact, used to perform motoneuron recordings to study monosynaptic Ia excitation. (B) Example of monosynaptic EPSCs obtained following dorsal-root stimulation (at 1.5–3× the threshold required to evoke an initial synaptic response). (C–E) Group data for absolute dorsal-root-evoked excitation for (C) all responses obtained and responses split by (D) location and (E) according to stimulated root and location. (F and G) (F) Representation of group I afferent inhibitory pathways (Ia/Ib) studied in vitro, with (G) examples of disynaptic IPSCs obtained from motoneurons following dorsal-root stimulation. (H–J) Data obtained on absolute synaptic conductance for (H) all responses and responses (I) grouped by location and (J) organized by stimulated root and segment. (K) Examples of EPSCs recorded from motoneurons, obtained in the presence of 2 mM (top) and 4 mM (bottom) extracellular Ca2+, with respective histogram counts next to traces (black sweep represents averaged trace). (L–O) BQA estimates for (L) quantal size scaled, (M) number of release sites and probabilities of release (N and O)). Estimation plots with all individual values and respective boxplots shown along with respective bootstrapped mean difference and bootstrapped Hedges’ g. See also Table S11–S18. DRG, dorsal-root ganglion.
Figure 6.
Figure 6.. The initial reduction in recurrent inhibition in early-juvenile mSOD1 mice is compensated at later adult stages
(A) Summary of the recording setup used to perform in vivo sharp-electrode recordings from motoneurons from P48–56 mice, with cells identified through antidromic stimulation of the L4 or L5 ventral roots and recurrent inhibition estimated by stimulating the adjacent root. (B and C) Estimation plots for (B) absolute conductances for recurrent inhibition from in vivo motoneuron recordings. Schematic and example traces illustrating the EMG recordings used to obtain motor and H-reflex responses from quadriceps and TA muscles and the conditioning protocols used to estimate (C) recurrent inhibition. (D–F) Data obtained for the different age-ranges tested for recurrent inhibition. Estimation plots with boxplots with individual values shown for in vivo sharp-electrode recurrent inhibition, and boxplots shown as median (dot) and interquartile range (shaded area) for EMG-estimated recurrent inhibition, along with respective bootstrapped mean difference and bootstrapped Hedges’ g. See also Tables S19 and S20.
Figure 7.
Figure 7.. Homeostatic responses in spinal microcircuits are multiphasic throughout the course of disease progression in mSOD1 mice
Summary of identified synaptic alterations in (A) recurrent inhibition and (B) Ia monosynaptic excitation in mSOD1 mice obtained from this work and previous studies.,,

Update of

Similar articles

Cited by

References

    1. Brownstone RM, and Lancelin C (2018). Escape from homeostasis: Spinal microcircuits and progression of amyotrophic lateral sclerosis. J. Neurophysiol 119, 1782–1794. 10.1152/jn.00331.2017. - DOI - PMC - PubMed
    1. Styr B, and Slutsky I (2018). Imbalance between firing homeostasis and synaptic plasticity drives early-phase Alzheimer’s disease. Nat. Neurosci 21, 463–473. 10.1038/s41593-018-0080-x. - DOI - PMC - PubMed
    1. Bezard E, Gross CE, and Brotchie JM (2003). Presymptomatic compensation in Parkinson’s disease is not dopamine-mediated. Trends Neurosci 26, 215–221. 10.1016/S0166-2236(03)00038-9. - DOI - PubMed
    1. Lees AJ (1991). Ageing and Parkinson’s Disease: Substantia Nigra Regional Selectivity. Brain, A J. Neurol 114, 2283–2301. - PubMed
    1. Huh S, Heckman CJ, Manuel M, and Manuel M (2020). Time course of alterations in adult spinal motoneuron properties in the SOD1 ( G93A ) mouse model of ALS. Preprint at: bioRxiv 1. 10.1101/2020.05.19.105007 - DOI - PMC - PubMed

Publication types

Substances

LinkOut - more resources