

Assessment of salivary microRNA by RT-qPCR: Facing challenges in data interpretation for clinical diagnosis
- PMID: 39656703
- PMCID: PMC11630609
- DOI: 10.1371/journal.pone.0314733
Assessment of salivary microRNA by RT-qPCR: Facing challenges in data interpretation for clinical diagnosis
Abstract
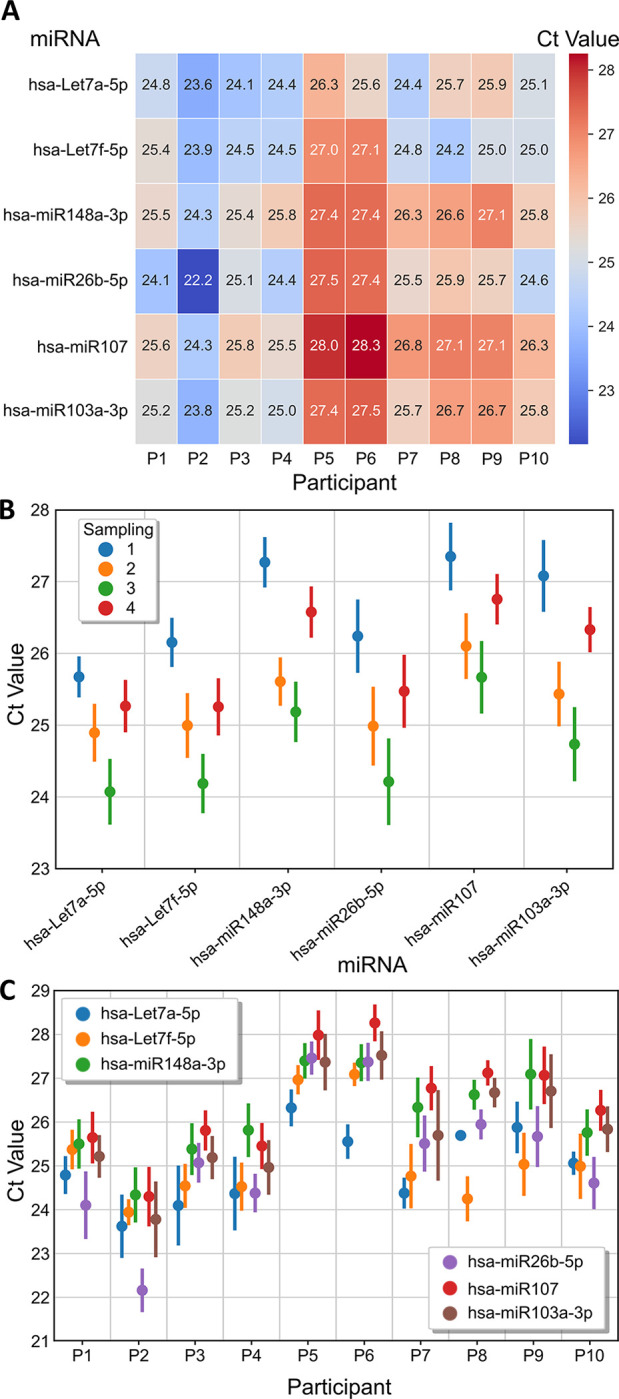
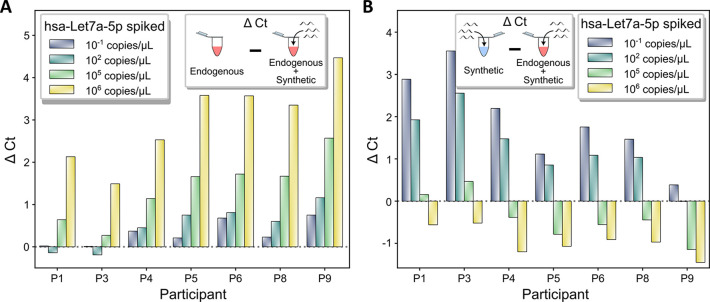
Salivary microRNAs (miRNAs) have been recently revealed as the next generation of non-invasive biomarkers for the diagnostics of diverse diseases. However, their short and highly homologous sequences make their quantification by RT-qPCR technique highly heterogeneous and study dependent, thus limiting their implementation for clinical applications. In this study, we evaluated the use of a widely used commercial RT-qPCR kit for quantification of salivary miRNAs for clinical diagnostics. Saliva from ten healthy volunteers were sampled four times within a three month time course and submitted for small RNA extraction followed by RT-qPCR analysed. Six miRNAs with different sequence homologies were analysed. Sensitivity and specificity of the tested miRNA assays were corroborated using synthetic miRNAs to evaluate the reliability of all tested assays. Significant variabilities in expression profiles of six miRNAs from ten healthy participants were revealed, yet the poor specificity of the assays offered insufficient performance to associate these differences to biological context. Indeed, as the limit of quantification (LOQ) concentrations are from 2-4 logs higher than that of the limit of detection (LOD) ones, the majority of the analysis for salivary miRNAs felt outside the quantification region. Most importantly, a remarkable number of crosstalk reactions exhibiting considerable OFF target signal intensities was detected, indicating their poor specificity and limited reliability. However, the spike-in of synthetic target miRNA increased the capacity to discriminate endogenous salivary miRNA at the LOQ concentrations from those that were significantly lower. Our results demonstrate that comparative analyses for salivary miRNA expression profiles by this commercial RT-qPCR kit are most likely associated to technical limitations rather than to biological differences. While further technological breakthroughs are still required to overcome discrepancies, standardization of rigorous sample handling and experimental design according to technical parameters of each assay plays a crucial role in reducing data inconsistencies across studies.
Copyright: © 2024 Hofstadt et al. This is an open access article distributed under the terms of the Creative Commons Attribution License, which permits unrestricted use, distribution, and reproduction in any medium, provided the original author and source are credited.
Conflict of interest statement
The authors declare that there are no conflicts of interest.
Figures


Similar articles
-
Salivary microRNA miR-let-7a-5p and miR-3928 could be used as potential diagnostic bio-markers for head and neck squamous cell carcinoma.PLoS One. 2020 Mar 24;15(3):e0221779. doi: 10.1371/journal.pone.0221779. eCollection 2020. PLoS One. 2020. PMID: 32208417 Free PMC article.
-
MicroRNA detection in prostate tumors by quantitative real-time PCR (qPCR).J Vis Exp. 2012 May 16;(63):e3874. doi: 10.3791/3874. J Vis Exp. 2012. PMID: 22643910 Free PMC article.
-
Evaluation of extraction kits and RT-qPCR systems adapted to high-throughput platform for circulating miRNAs.Sci Rep. 2015 Mar 24;5:9430. doi: 10.1038/srep09430. Sci Rep. 2015. PMID: 25800946 Free PMC article.
-
Salivary microRNAs and oral cancer detection.Methods Mol Biol. 2013;936:313-24. doi: 10.1007/978-1-62703-083-0_24. Methods Mol Biol. 2013. PMID: 23007518 Free PMC article. Review.
-
Free Circulating miRNAs Measurement in Clinical Settings: The Still Unsolved Issue of the Normalization.Adv Clin Chem. 2018;87:113-139. doi: 10.1016/bs.acc.2018.07.003. Epub 2018 Aug 23. Adv Clin Chem. 2018. PMID: 30342709 Free PMC article. Review.
Cited by
-
Diagnostic and Therapeutic Potential of Selected microRNAs in Colorectal Cancer: A Literature Review.Cancers (Basel). 2025 Jun 25;17(13):2135. doi: 10.3390/cancers17132135. Cancers (Basel). 2025. PMID: 40647434 Free PMC article. Review.
-
Emerging salivary biomarkers for early detection of oral squamous cell carcinoma.World J Clin Oncol. 2025 Apr 24;16(4):103803. doi: 10.5306/wjco.v16.i4.103803. World J Clin Oncol. 2025. PMID: 40290680 Free PMC article. Review.
References
-
- Hindson J Salivary miRNA signature for ESCC. Nat Rev Gastroenterol Hepatol [Internet]. 2023. Aug 8 [cited 2023 Aug 16]; Available from: https://www.nature.com/articles/s41575-023-00837-5 doi: 10.1038/s41575-023-00837-5 - DOI - PubMed
Publication types
MeSH terms
Substances
LinkOut - more resources
Full Text Sources
