. 2025 Feb;12(5):e2413103.
doi: 10.1002/advs.202413103. Epub 2024 Dec 10.

Dual Inhibition of CDK4/6 and CDK7 Suppresses Triple-Negative Breast Cancer Progression via Epigenetic Modulation of SREBP1-Regulated Cholesterol Metabolism

Affiliations

Dual Inhibition of CDK4/6 and CDK7 Suppresses Triple-Negative Breast Cancer Progression via Epigenetic Modulation of SREBP1-Regulated Cholesterol Metabolism

Yilan Yang et al. Adv Sci (Weinh). 2025 Feb.

Abstract

Inhibitors targeting cyclin-dependent kinases 4 and 6 (CDK4/6) to block cell cycle progression have been effective in treating hormone receptor-positive breast cancer, but triple-negative breast cancer (TNBC) remains largely resistant, limiting their clinical applicability. The study reveals that transcription regulator cyclin-dependent kinase7 (CDK7) is a promising target to circumvent TNBC's inherent resistance to CDK4/6 inhibitors. Combining CDK4/6 and CDK7 inhibitors significantly enhances therapeutic effectiveness, leading to a marked decrease in cholesterol biosynthesis within cells. This effect is achieved through reduced activity of the transcription factor forkhead box M1 (FOXM1), which normally increases cholesterol production by inducing SREBF1 expression. Furthermore, this dual inhibition strategy attenuates the recruitment of sterol regulatory element binding transcription factor 1 (SREBP1) and p300 to genes essential for cholesterol synthesis, thus hindering tumor growth. This research is corroborated by an in-house cohort showing lower survival rates in TNBC patients with higher cholesterol production gene activity. This suggests a new treatment approach for TNBC by simultaneously targeting CDK4/6 and CDK7, warranting additional clinical trials.

Keywords: CDK4/6; CDK7; breast cancer; cholesterol metabolism.


Conflict of interest statement

The authors declare no conflict of interest.

Figures

Figure 1
Figure 1
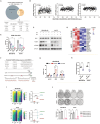
CDK7 inhibition elevates luminal‐related transcriptional activities and renders TNBC more sensitive to abemaciclib. A) The box plots depicting the dependency score of CDK7 and several other CDKs in TNBC cells (n = 25) using CRISPR screening datasets from the Broad Institute DepMap portal. p values were calculated using one‐way ANOVA, ****p < 0.0001. B) Violin plots of CDK7 dependency scores in TNBC and non‐TNBC breast cancer cells (n = 24 for TNBC, n = 17 for non‐TNBC) using CRISPR and RNAi screening datasets from the Broad Institute DepMap portal. p values were calculated using unpaired t‐test, *p < 0.05,**p < 0.01. C) Violin plots of CDK7 mRNA expression levels in the TCGA‐TNBC dataset (n = 140) and normal breast tissues from the GTEx dataset (n = 459). P values were calculated using an unpaired t‐test, ****p < 0.0001. D) Kaplan–Meier plots of CDK7 expression in TNBC patients using the TCGA cohort and KMplot cohort. Data were analyzed using the log‐rank test. E,F) Gene set enrichment analysis (GSEA) of RNA‐Seq data for CDK7‐high and CDK7‐low patients in the TCGA‐TNBC (E) and FUSCC‐TNBC (F) cohorts. NES, normalized enrichment score, NOM, nominal, FDR, false discovery rate. G) Heatmap summarizing the RNA‐Seq data of selected luminal/epithelial marker genes and basal/invasive marker genes in normal control (NC) and CDK7‐knockdown (ShCDK7) Hs578T cells (n = 3). H) Immunoblot validation of CDK7 knockdown in MDA‐MB‐468 and Hs578T cells. I) Differences in drug sensitivities between MDA‐MB‐468‐NC and MDA‐MB‐468‐ShCDK7 cells, as well as between Hs578T‐NC and Hs578T‐ShCDK7 cells. Data are mean ± SD of 5 replicates. J,K) Dose‐response curves of tamoxifen (J) and abemaciclib (K) between NC and ShCDK7 MDA‐MB‐468 and Hs578T cells. Data are mean ± SD of 3–5 experimental replicates. p values were analyzed using a two‐way ANOVA test with Bonferroni correction.
Figure 2
Figure 2
The synergistic lethality of co‐inhibiting CDK4/6 and CDK7 in TNBC. A) Colony formation images of TNBC cells following a 48 h exposure to the combination of abemaciclib with YKL‐5‐124. Representative images from 3 biological replicates are provided. B) Colony formation images of TNBC cells following a 48 h exposure to the combination of palbociclib with YKL‐5‐124. Representative images from 3 biological replicates are provided. C) Heatmap of survival fractions in TNBC cells after 48 h exposure to gradient concentrations of abemaciclib, YKL‐5‐124, and the combined treatment (abemaciclib at gradient concentrations with YKL‐5‐124 at fixed concentrations). Data are shown as mean (n = 3 biological replicates). D) Combination index values for TNBC cells treated with abemaciclib plus YKL‐5‐124, calculated by CompuSyn software. Data are represented as mean ± SD. E) Tumor weights of MDA‐MB‐468 and patient‐derived xenografts (PDX) after 21 days of treatment with control, abemaciclib (50 mg kg−1), YKL‐5‐124 (2 mg kg−1), or the combination (n = 5). Tumor weights of MDA‐MB‐231 xenografts after 14 days of treatment with control, abemaciclib (50 mg kg−1), YKL‐5‐124 (5 mg kg−1), or the combination (n = 6). Data are shown as mean ± SD. p values were calculated using one‐way ANOVA, *p < 0.05, **p < 0.01, ***p < 0.001, ****p < 0.0001. F) Immunohistochemistry (IHC) staining of ki‐67 in tumor sections of MDA‐MB‐468, MDA‐MB‐231, and patient‐derived xenografts. Scale bar, 100 µm. G) Quantifications of ki‐67 staining in tumor sections of MDA‐MB‐468 (n = 10), MDA‐MB‐231 (n = 12), and patient‐derived xenografts (n = 10). Two representative images per tumor were used to quantify the ki‐67 positivity. Data are represented as mean ± SD. p values were calculated using one‐way ANOVA, *p < 0.05, ****p < 0.0001. H) Percentage of total apoptotic cells after 96 h of treatment with abemaciclib, YKL‐5‐124, and the combination (n = 3). Data are presented as mean ± SD. p values were calculated using one‐way ANOVA, ****p < 0.0001. I) IHC staining of cleaved caspase‐3 in tumor sections of MDA‐MB‐468, MDA‐MB‐231, and patient‐derived xenografts. Scale bar, 100 µm. J) H‐scores of cleaved caspase‐3 staining in tumor sections of MDA‐MB‐468 (n = 10), MDA‐MB‐231 (n = 12), and patient‐derived xenografts (n = 10). Two representative images per tumor were used to quantify cleaved caspase‐3 staining. Data are represented as mean ± SD. p values were calculated using one‐way ANOVA, ****p < 0.0001.
Figure 3
Figure 3
Concurrent inhibition of CDK4/6 and CDK7 suppresses SREBF1‐regulated cholesterol synthesis. A) Venn diagram illustrating the overlapping GSEA hallmark pathways that are enriched in the DMSO groups of MDA‐MB‐468 and Hs578T cells compared to the drug combination (Combo) groups. GSEA was performed using the RNA‐Seq data after 48 h of treatment with DMSO, abemaciclib, YKL‐5‐124, or the combination (n = 2 biological replicates). B) The overlapping hallmark pathways ranked by mean NES of MDA‐MB‐468 and Hs578T cells. C) GSEA enrichment plots of cholesterol‐related pathways in the DMSO groups of MDA‐MB‐468 cells. D) Schematic diagram of the cholesterol biosynthesis pathway, including intermediate metabolites (black) and key enzymes (blue). E) Heatmap summarizing the RT‐qPCR results of cholesterol synthesis‐related genes following single‐agent or combined treatment across two TNBC cell lines (n = 3). F) Immunoblot analysis of cholesterol synthesis‐related proteins following single‐agent or combined treatment across two TNBC cell lines. G) IHC staining of SREBP1 in tumor sections of MDA‐MB‐468 and patient‐derived xenografts. Scale bar, 100 µm. H) H‐scores of SREBP1 staining in tumor sections of MDA‐MB‐468 (n = 10) and patient‐derived xenografts (n = 10). Two representative images per tumor were used to quantify SREBP1 staining. Data are represented as mean ± SD. p values were calculated using one‐way ANOVA, ****p < 0.0001. I) Quantification of cholesterol‐related metabolites in MDA‐MB‐468 xenografts (n = 5) and Hs578T cells (n = 5). Data are presented as mean ± SD. p values were calculated using one‐way ANOVA, *p < 0.05, **p<0.01, ****p < 0.0001. J) Cholesterol rescued colony formation of combination groups in MDA‐MB‐468 and Hs578T cells. Rescue groups were additionally supplemented with 0.2 µg mL−1 cholesterol for 14 days. Representative images from 3 biological replicates are provided. p values were calculated using one‐way ANOVA, *p < 0.05, ****p < 0.0001. K) Schematic illustration of the in vivo cholesterol rescue experiment. Mice bearing MDA‐MB‐468 xenograft tumors were randomized to receive a control or a 1.25% cholesterol‐enriched diet, with or without the combination therapy (50 mg kg−1 abemaciclib plus 2 mg kg−1 YKL‐5‐124). Tumor weights at the study endpoint for the four treatment arms were collected: control with a chow diet, control with a 1.25% cholesterol diet, combined treatments with a chow diet, and combined treatments with a 1.25% cholesterol diet (n = 5). Data are shown as mean ± SD. p values for tumor weights were determined using a two‐tailed Student's t‐test, ***p < 0.001. L) Effects of SREBF1 overexpression (OE) upon drug synergy. Left, heatmaps of viability in SREBF1‐NC and SREBF1‐OE cells after a 48 h exposure to the indicated concentrations of abemaciclib, YKL‐5‐124, and the combined treatment (gradient concentrations of abemaciclib in combination with 1 µM YKL‐5‐124). Data are presented as the mean values from three biological replicates. Right, combination index values for SREBF1‐NC and SREBF1‐OE cells after the combined treatments. Data are shown as mean ± SD. p values were determined using an unpaired t‐test, ****p < 0.0001.
Figure 4
Figure 4
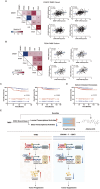
FOXM1 modulates cholesterol homeostasis via directly binding to SREBF1. A) Venn diagram displaying the overlap transcription factors that are predicted from the MDA‐MB‐468 and Hs578T RNA‐Seq data using the ChEA3 database (https://maayanlab.cloud/chea3/). B) Correlation analyses of FOXM1, E2F6, and CEBPB expression with cholesterol synthesis signature scores in the FUSCC‐TNBC cohort (n = 360). p values were obtained using the Pearson correlation test. C) Immunoblot analysis of E2F6, FOXM1, and p‐FOXM1 (Thr600) in MDA‐MB‐468 and Hs578T cells treated with abemaciclib, YKL‐5‐124, and their combination for 48 h. D) Heatmap showing the RT‐qPCR results of cholesterol synthesis‐related genes after FOXM1 knockdown (n = 3). E) FOXM1 ChIP‐qPCR at the promoter regions of SREBF1 following the indicated treatments in MDA‐MB‐468 and Hs578T cells (n = 3). Data are presented as mean ± SD. P values were calculated using one‐way ANOVA, ****p < 0.0001. F) Predicted FOXM1 binding sites in the SREBF1 promoter region identified using the hTFtarget database. Mutant SREBF1 promoter sequences are displayed below. G) Analysis of luciferase activity in MDA‐MB‐468 cells (n = 4). Data are shown as mean ± SD. P values were calculated using two‐way ANOVA, **p < 0.01, ***p < 0.001. H) Total cholesterol levels in MDA‐MB‐468 and Hs578T cells after FOXM1 knockdown (n = 5). The cholesterol concentration was normalized to cell number. Data are shown as mean ± SD. P values were determined using an unpaired t‐test, **p < 0.01, ****p < 0.0001. I) Effects of FOXM1 overexpression (OE) upon drug synergy. Left, heatmaps of viability in FOXM1‐NC and FOXM1‐OE cells after a 48 h exposure to the indicated concentrations of abemaciclib, YKL‐5‐124, and the combined treatment (gradient concentrations of abemaciclib in combination with 0.5 µM YKL‐5‐124). Data are presented as the mean values from three biological replicates. Right, combination index values for FOXM1‐NC and FOXM1‐OE cells after the combined treatments. Data are shown as mean ± SD. p values were determined using an unpaired t‐test, **p < 0.01, ****p < 0.0001. J) FOXM1‐OE‐rescued colony formation of MDA‐MB‐468 and Hs578T cells. Representative images from 3 biological replicates are provided. p values were calculated using one‐way ANOVA, *p < 0.05, **p < 0.01.
Figure 5
Figure 5
SREBP1 interacts with p300 to collaboratively regulate de novo cholesterol biosynthesis. A) Protein‐protein interaction network centered on SREBF1 as depicted in the STRING database. B) Venn diagram showing the overlapping SREBF1‐interacting proteins identified in the STRING and BioGRID databases. C) Immunoprecipitation followed by immunoblot analysis of SREBP1 and p300/CBP in MDA‐MB‐468 and Hs578T cells. D) Heatmaps visualizing the occupancy of SREBP1 after 72 h of DMSO and combination treatments. Peaks are centered on the transcription start site (TSS) of SREBP1‐bound genes. Data are representative results of two independent experiments. E) Heatmaps visualizing the p300 and H3K27ac signals on SREBP1‐target genes. Data are representative results of two independent experiments. F) P300 and H3K27ac signal intensity at TSS of cholesterol homeostasis genes. Data are representative results of two independent experiments. G) CUT&Tag tracks showing the SREBP1, p300, and H3K27ac signals at the genomic loci of PMVK, SQLE, and LSS. Data are representative results of two independent experiments. H) Heatmap summarizing the RT‐qPCR results of cholesterol synthesis‐related genes after the administration of p300 inhibitors (n = 3).
Figure 6
Figure 6
Clinical relevance of the SREBP1‐p300‐cholesterol synthesis pathway in TNBC. A,B) Correlation analysis between the mRNA expression levels of SREBF1, EP300, and cholesterol biosynthesis genes (PMVK, SQLE, and LSS) in the FUSCC‐TNBC (n = 360) (A) and TCGA‐TNBC (n = 140) (B) cohorts. Correlation coefficients were calculated using the Spearman test. p values were obtained using spearman correlation test. C) Kaplan–Meier plots of FOXM1, SREBF1, and EP300 expression in the FUSCC‐TNBC cohort. Data were analyzed using the log‐rank test. D) Kaplan–Meier plots of cholesterol homeostasis gene set variation analysis (GSVA) scores in the FUSCC‐TNBC cohort. Data were analyzed using the log‐rank test. E) Schematic diagram illustrating the proposed mechanism of co‐inhibiting CDK4/6 and CDK7 suppresses SREBP1‐regulated cholesterol biosynthesis. Reduced CDK7 expression disrupts luminal and basal transcriptional activities within TNBC, enabling tumors to overcome intrinsic resistance to CDK4/6 inhibitors. The synergistic intervention initially diminishes the activation of FOXM1, which directly binds with the promoter of SREBF1, exerting regulatory control over SREBF1 transcriptional activity. Consequently, SREBF1 mRNA and protein levels are decreased, attenuating SREBP1/p300 co‐recruitment to cholesterol synthesis gene promoters. This cascade transcriptionally represses rate‐limiting cholesterogenic enzymes, lowers cholesterol synthesis, and maintains antitumor effects.

References

    1. DeSantis C. E., Ma J., Gaudet M. M., Newman L. A., Miller K. D., Sauer A. G., Jemal A., Siegel R. L., CA Cancer J. Clin. 2019, 69, 438. - PubMed
    1. Garrido‐Castro A. C., Lin N. U., Polyak K., Cancer Discov 2019, 9, 176. - PMC - PubMed
    1. Li Z. M., Liu G., Gao Y., Zhao M. G., Pharmacol. Ther. 2022, 240, 108229. - PubMed
    1. Sava G. P., Fan H., Coombes R. C., Buluwela L., Ali S., Cancer Metastasis Rev. 2020, 39, 805. - PMC - PubMed
    1. Wang Y., Zhang T., Kwiatkowski N., Abraham B. J., Lee T. I., Xie S., Yuzugullu H., Von T., Li H., Lin Z., Stover D. G., Lim E., Wang Z. C., Iglehart J. D., Young R. A., Gray N. S., Zhao J. J., Cell 2015, 163, 174. - PMC - PubMed

MeSH terms

LinkOut - more resources