. 2024 Dec 6;41(12):msae246.
doi: 10.1093/molbev/msae246.

The Sensory Shark: High-quality Morphological, Genomic and Transcriptomic Data for the Small-spotted Catshark Scyliorhinus Canicula Reveal the Molecular Bases of Sensory Organ Evolution in Jawed Vertebrates

Affiliations

The Sensory Shark: High-quality Morphological, Genomic and Transcriptomic Data for the Small-spotted Catshark Scyliorhinus Canicula Reveal the Molecular Bases of Sensory Organ Evolution in Jawed Vertebrates

Hélène Mayeur et al. Mol Biol Evol. .

Abstract

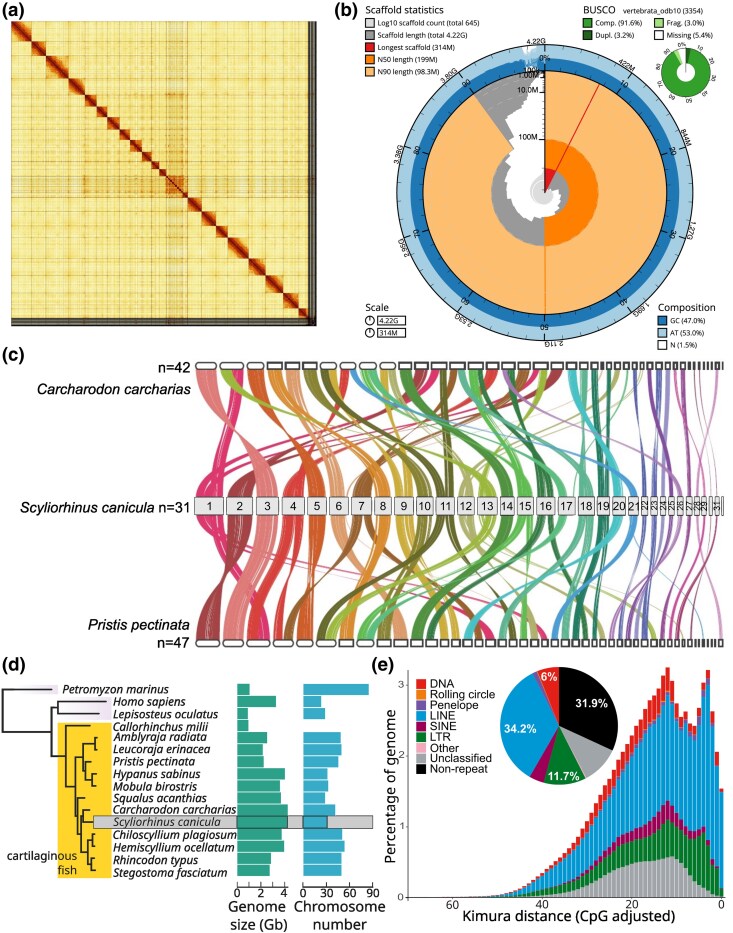
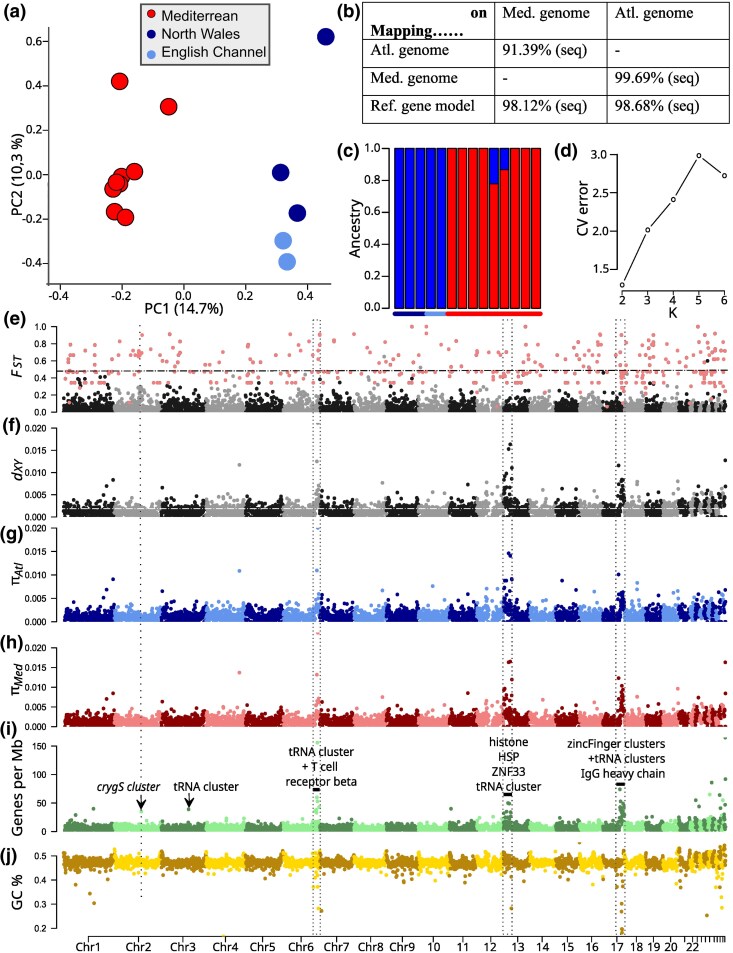
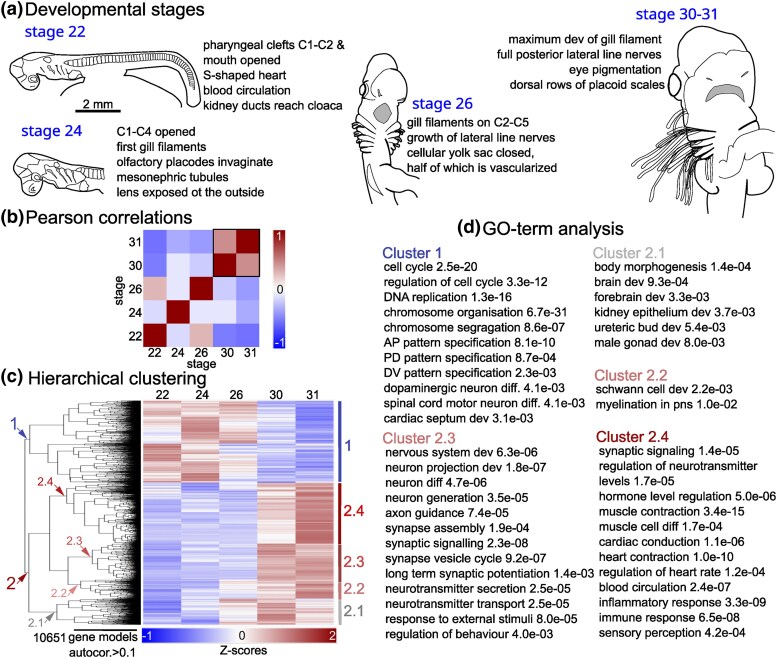
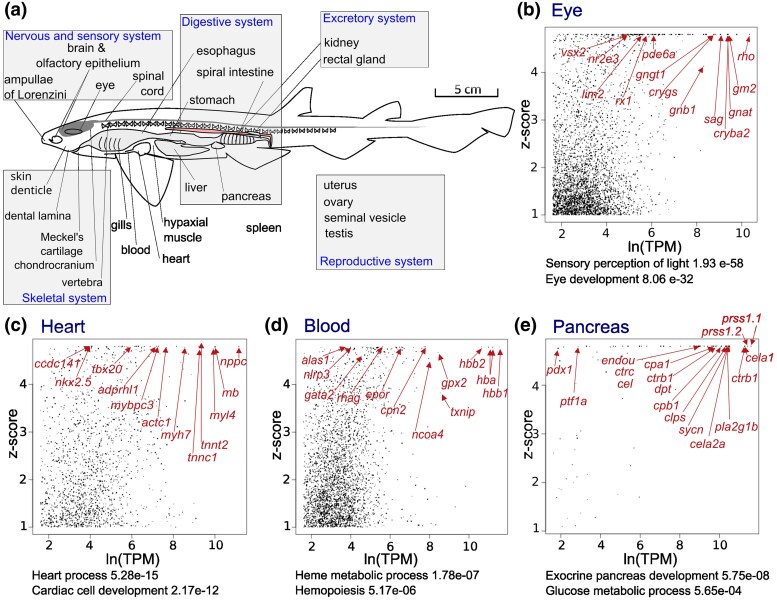
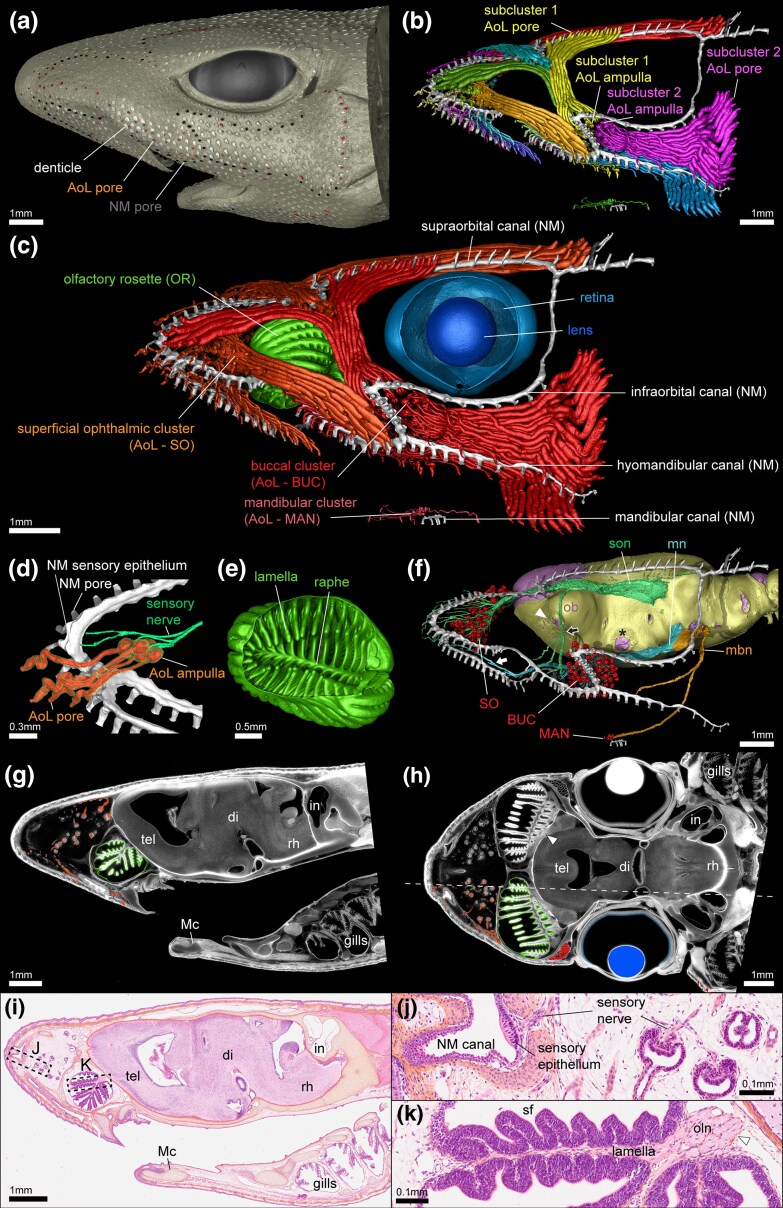
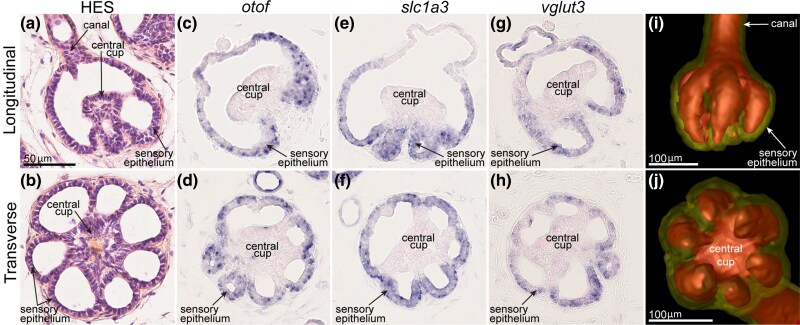
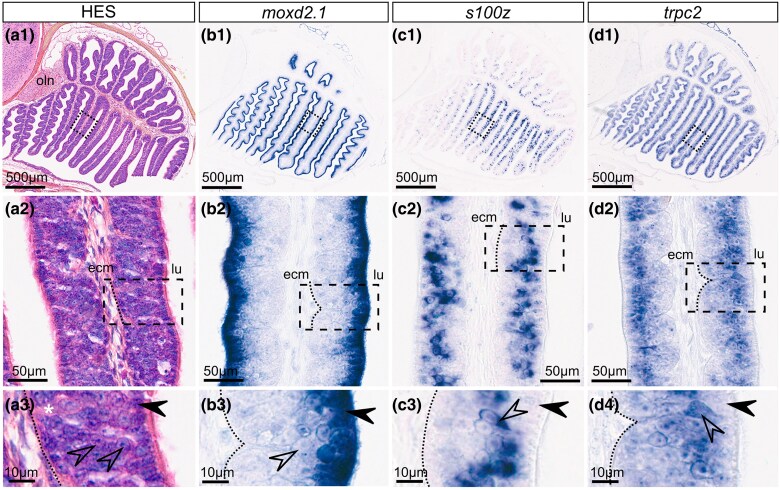
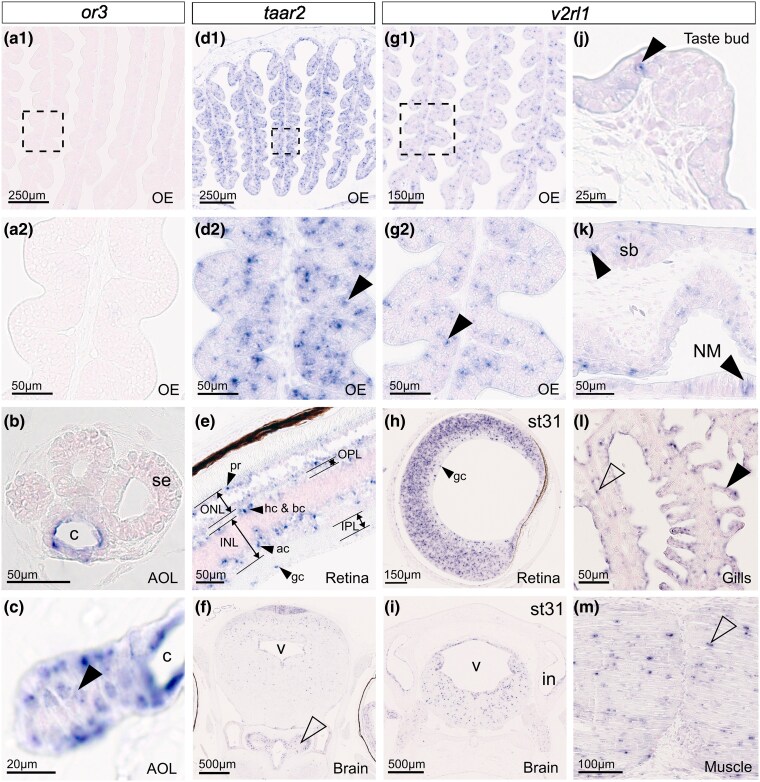
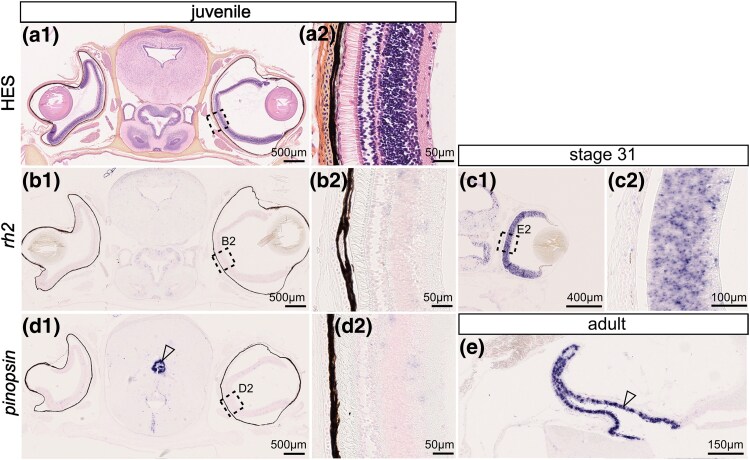
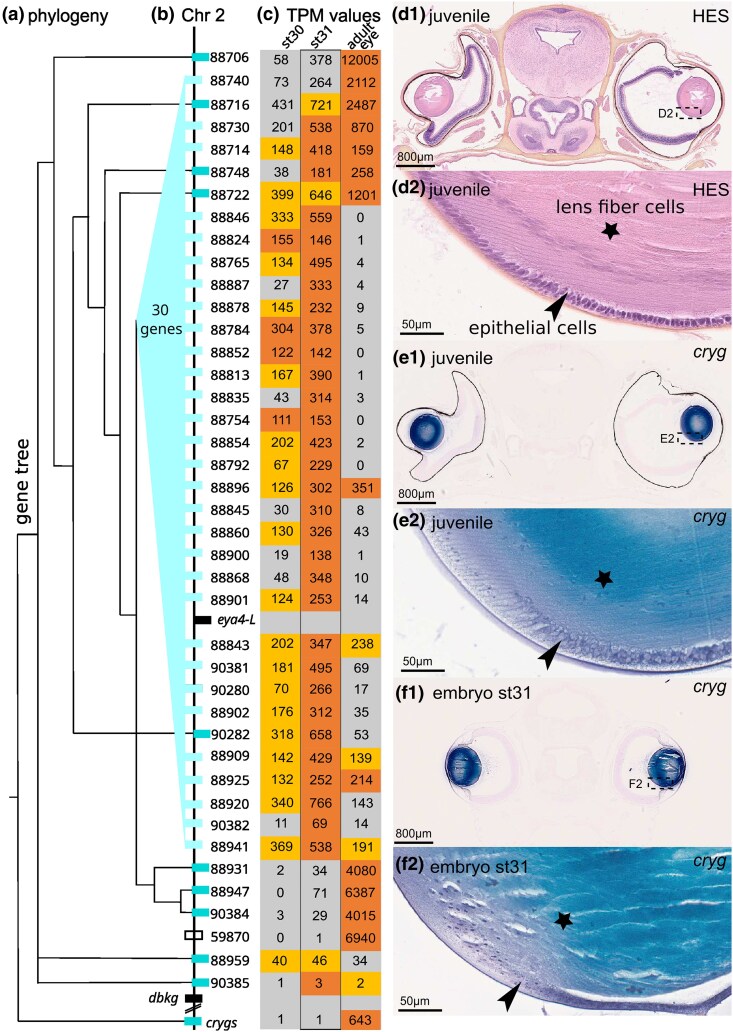
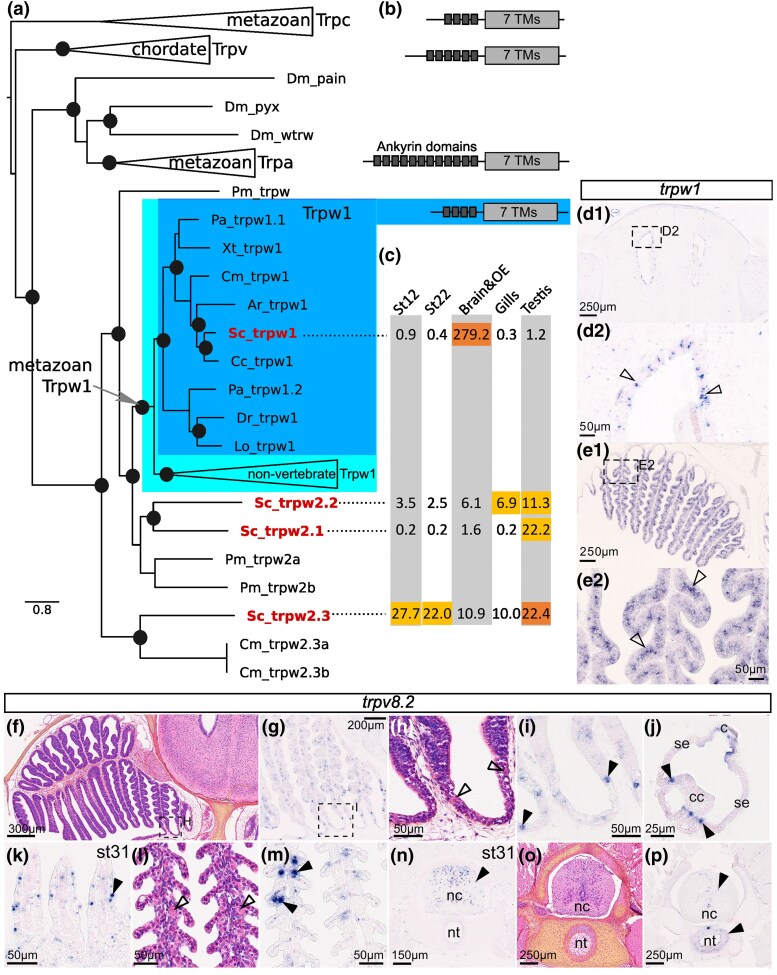
Cartilaginous fishes (chondrichthyans: chimeras and elasmobranchs -sharks, skates, and rays) hold a key phylogenetic position to explore the origin and diversifications of jawed vertebrates. Here, we report and integrate reference genomic, transcriptomic, and morphological data in the small-spotted catshark Scyliorhinus canicula to shed light on the evolution of sensory organs. We first characterize general aspects of the catshark genome, confirming the high conservation of genome organization across cartilaginous fishes, and investigate population genomic signatures. Taking advantage of a dense sampling of transcriptomic data, we also identify gene signatures for all major organs, including chondrichthyan specializations, and evaluate expression diversifications between paralogs within major gene families involved in sensory functions. Finally, we combine these data with 3D synchrotron imaging and in situ gene expression analyses to explore chondrichthyan-specific traits and more general evolutionary trends of sensory systems. This approach brings to light, among others, novel markers of the ampullae of Lorenzini electrosensory cells, a duplication hotspot for crystallin genes conserved in jawed vertebrates, and a new metazoan clade of the transient-receptor potential (TRP) family. These resources and results, obtained in an experimentally tractable chondrichthyan model, open new avenues to integrate multiomics analyses for the study of elasmobranchs and jawed vertebrates.

Keywords: TRP ion channels; cartilagious fish genome; electroreceptors; olfactory receptors; transcriptomics; vertebrate evolution.


Figures

Fig. 1.
Fig. 1.
Genome assembly of Scyliorhinus canicula. a) Hi-C contact map of the assembly, visualized using HiGlass. The absence of off-diagonal signals illustrates the correct assignment of sequence to chromosome-level scaffolds. The remaining unassigned contigs are shown as bars at the bottom and right of the map. b) The BlobToolKit Snailplot shows N50 metrics and BUSCO gene completeness. The main plot is divided into 1,000 size-ordered bins around the circumference with each bin representing 0.1% of the 4.2 Gb assembly. The distribution of scaffold lengths is shown in dark gray with the plot radius scaled to the longest scaffold present in the assembly (314 Mb). Orange and pale-orange arcs show the N50 and N90 scaffold lengths (199 Mb and 98 Mb), respectively. The pale gray spiral shows the cumulative scaffold count on a log scale with white scale lines showing successive orders of magnitude. The blue and pale-blue area around the outside of the plot shows the distribution of GC, AT and N percentages in the same bins as the inner plot. A summary of complete, fragmented, duplicated, and missing BUSCO genes in the vertebrata_odb10 set is shown in the top right. c) Macrosynteny shared between three elasmobranch species. Synteny blocks based on alignment using all coding genes in three species, with 15,540 placed in shared synteny blocks between Scyliorhinus canicula and another shark, the great white shark Carcharodon carcharias, and 14,832 between Scyliorhinus canicula and a batoid, the small-tooth sawfish Pristis pectinata. Colors represent conserved synteny blocks and are ordered based on the focal species Scyliorhinus canicula. d) Genome evolution across chondrichthyans: species phylogeny (left) consisting of 16 species including 3 outgroup species (see Material and methods). Bar plots show genome size distribution per species, and chromosome count per species (both estimated from genomes assemblies). e) Pie-chart: proportion of the main TE classes in the assembled genome; graph: repeat landscape plot showing the proportion of repeats at different genetic distances (%) to their respective RepeatModeler consensus sequence, genetic distance is calculated under a Kimura 2 parameter model with correction for CpG site hypermutability: lower genetic distances suggest shorter time of divergence.
Fig. 2.
Fig. 2.
Atlantic and Mediterranean populations of the small-spotted catshark. a) Principal Component Analysis based on 12,005 SNPs separating Atlantic and Mediterranean samples. b) Proportion of reciprocal coverage between the Atlantic and the Mediterranean small-spotted catshark genomes, and between genomes and the reference gene model used in this study (percentage of the sequences from the source (first column) that can be mapped on the target (first line). c) ADMIXTURE analysis at K = 2. Bars show estimated ancestry proportion of each individual, and colored lines at the top and bottom of the plot indicate the source population (same legend as in A). d) Cross-validation error (CV error; K = 2 to 6; b) indicates that K = 2 was the best fit to the data. e–j) Genome-wide patterns of differentiation (e: Weir and Cockerhams FST, based on 172,078 SNPs, dotted line indicates the mean value for all SNPs in the genome), absolute divergence (f: dXY, dotted line indicates the absolute value for the whole genome), nucleotide diversity in Atlantic (g: πAtl.) and Mediterranean (h: πMed.) populations, gene density (i: annotated loci per Mb) and GC content (j). Mean values for non-overlapping 1 Mb windows are shown as points in alternating colors for each chromosome. Red points in the FST plot show site-level FST values for variants which were significant outliers in the PCAdapt analysis.
Fig. 3.
Fig. 3.
Transcriptomic comparison between stage 22, 24, 26, 30 and 31 embryos. a) Broad morphological characteristics of the stages analyzed (after Ballard et al. 1993). Lateral (stages 22 and 24) or ventral views (stages 26, 30 to 31) of a catshark embryo (stage 22) or its embryonic cephalic region (stages 24 to 31) are schematized for each stage. b) Pairwise Pearson correlations between stages across all genes with sum of TPM > 50. A black box shows the correlation observed between stages 30 and 31. c) Gene groupings obtained by hierarchical clustering of Z-score transformed expression of the 10,651 genes with regionalized expression (autocorrelation > 0.1). The two major clusters are respectively numbered 1 and 2, the latter is further subdivided into four groups, referred to as 2.1, 2.2, 2.3, and 2.4. The corresponding nodes are shown by arrowheads in the dendrogram on the left, and the clusters are delineated by vertical bars on the right. d) Selection of enriched GO-terms in clusters 1, 2.1, 2.2, 2.3, and 2.4, with P-values indicated. Detailed results for the GO-term analysis are shown in supplementary dataset S3, Supplementary Material online. C1 to C6 refer to pharyngeal clefts, from anterior to posterior. AP: anterior-posterior; dev: development; diff: differentiation; DV: dorsal–ventral; PD: proximal–distal; pns: peripheral nervous system.
Fig. 4.
Fig. 4.
Transcriptomic analysis of small-spotted catshark adult tissues. a) Scheme showing the adult tissues included in the transcriptomic analysis. (b), (c), (d), and e) graphs showing Z-score and TPM values for each gene in the eye (b), heart (c), blood (d), and pancreas (e). Each dot represents one gene and the graph is restricted to genes with a Z-score > 1 and TPM > 5 in the tissue considered. GO-terms relevant to known functions of these tissues are indicated below the graphs. Arrows point to a selection of genes which exhibit high Z-scores in the catshark, consistent with selective expressions either in the eye (b), heart (c), blood (d), or pancreas e) as documented in bony fishes.
Fig. 5.
Fig. 5.
3D organization of head sensory organs in a pre-hatchling Scyliorhinus canicula. a) Lateral view of whole-head surface rendering, with dermal denticles in white and the neuromast canal (NM) pores in black. Surface pores for the ampullae of Lorenzini (AoL) canals are displayed in shades of red. b) Rendering of subclusters of AoL as determined by canal orientations, shown in a range of different colors (neuromast canals in white). c) Lateral 3D rendering of sensory organs. Shades of red = AoL with canals colored for three clusters as defined by the location of the ampullae: orange = superficial ophthalmic (SO); red = buccal (BUC); old rose = mandibular (MAN); white = neuromast canals (NM); green = olfactory rosette (OR); blue = retina; dark blue = lens. d) Medial rendering of the anterior snout (anterior to the left), isolating a single neural projection of the superficial ophthalmic nerve (light green) to both the neuromast canals (white) and several AoL with canals and sensory ampullae (orange = internal cast, and its superficial transparent yellow lining = epithelium). e) Anteroventral rending of the isolated left OR. f) Lateral rendering displaying the interaction between sensory organs and the nervous system. Lilac = brain, yellow = internal fibrous surface of chondrocranium, light green = superficial ophthalmic nerve (son), light blue = maxillary nerve (mn), orange = mandibular nerve (mbn), white = neuromast canals, red = ampullae of the AoL system. White arrowhead indicates olfactory nerve foramen leading to the olfactory bulb (ob), black asterisk indicates optic nerve foramen, white arrow indicates anterior projection of the maxillary nerve, black arrow indicates ventral projection of the superficial ophthalmic nerve. g, h) Virtual parasagittal and horizontal histological sections with left sensory organs colored as in (c), white arrowhead locates axon projections of the olfactory neurons emerging from the sensory epithelium (compare to the K panel). The dotted line in h) indicates the position of the sagittal section displayed in (g). i) Parasagittal histological section in plane corresponding to (g). tel = telencephalon, di = diencephalon, rh = rhombencephalon, in = inner ear, Mc = Meckel's cartilage. j) Histological detail in the neuromast canals and AoL. k) Histological detail in the olfactory epithelium showing secondary folding (sf) of the sensory epithelium on each lamella and axon projections of the olfactory neurons (oln, white arrowhead) emerging from the sensory epithelium.
Fig. 6.
Fig. 6.
Histological (HES) staining of the sensory ampullae of Lorenzini in a juvenile catshark in their longitudinal (a) and transverse b) sections. Gene expression patterns for otof (c, d), slc1a3 (e, f) and vglut3 (g, h) in similar orientations. (i, j) 3D renderings of a sensory ampulla (red = hydrogel-filled cavity, transparent yellow = epithelium) in similar orientations.
Fig. 7.
Fig. 7.
Histological (HES) staining of the olfactory epithelium in a juvenile catshark. a) with higher magnification (a2, a3) in transverse section. Gene expression patterns for moxd2.1 (b), s100z c) and trpc2 d) in parallel sections. ecm: extracellular matrix of the basal conjunctive tissue; lu: lumen of the olfactory rosette; oln: olfactory nerve; dotted line: basal lamina between the sensory epithelium and the underlying conjunctive tissue; asterisk in panel a3: putative ionocyte (large clear cell); open arrowhead: putative sensory cell bodies; black arrowhead: putative supporting cells.
Fig. 8.
Fig. 8.
Gene expression patterns for or3 (a–c), taar2 (d–f) and v2rl1 (g–m) in transverse sections of a juvenile catshark (except in h, i: stage 31 embryo) in the olfactory epithelium (OE; a, d, g) or non-olfactory sites: ampullae of lorenzini (AoL; b, c), c: canal of an AoL, se: sensory epithelium of an AoL; differentiated e) and undifferentiated retina (h), ac: amacrine cells; gc: ganglion cells, hc & bc: horizontal and bipolar cells; INL: inner nuclear layer, IPL: inner plexiform layer, ONL: outer nuclear layer, OPL: outer plexiform layer, pr: photoreceptor cell layer; posterior brain (f, i), arrowhead: posterior hypothalamus, in: inner ear, v: ventricle of the mesencephalon; taste bud (j); epiderm and neuromast (NM; k), sb: scale bud; gills l) and muscle tissue (m). Black arrowheads point to scattered epithelial cells positive for gene expression; open arrowheads point to endothelial l) or muscle m) cells.
Fig. 9.
Fig. 9.
a) Histological (HES) staining of a transverse section in the head of a juvenile catshark: general view (a1) with inset (a2) on the retina histology. Gene expression patterns for rh2 (b, c) and pinopsin (d, e; arrowhead points to expression in the pineal stalk): in a juvenile (b, d); in the developing retina of a stage 31 embryo (c); in an adult catshark (e). Scales in microns.
Fig. 10.
Fig. 10.
Simplified representation of the phylogenetic relationships between the small-spotted catshark gamma-crystallins, with the single gamma-S crystallin gene (crygs) as the outgroup (a) mapped on the gene organization along chromosome 2 (b); gene names appear as the last 5 digits of their genomic ID XM_0387xxxxx. TPM values in three selected samples (embryo stage 30, embryo stage 31, and adult eye) for each gene copy c) with color code indicated the associated Z-score (vermillon: Z-score > 4; orange: 4 > Z-score > 1). Histological staining of a transverse section through the eye of a juvenile catshark (d1 general view, d2 close-up on lens cells) and in situ hybridization with a gamma-crystallin (cryg1) RNA probe in the corresponding sample e) and in a stage 31 embryo (f). The lens epithelial cells are labeled with an arrowhead, and the elongated lens fiber cells are marked with a star: both cell types are positive for cryg RNA in situ hybridization.
Fig. 11.
Fig. 11.
a) Phylogenetic relationships between the Trpc, Trpv, and Trpa groups and the identification of a new metazoan Trpw clade: Trpc is taken as an outgroup and robust sister-relationship is recovered between the metazoan clades of Trpa and Trpw, excluding the chordate Trpv clade. Branch support is indicated by a black dot if the posterior probability value is >0.88. Species names: Ar: Amblyraja radiata; Cc: Carcharodon carcharias; Cm: Callorhinchus milii; Dm: Drosophila melanogaster; Dr: Danio rerio; Lo: Lepisosteus oculatus; Pa: Protopterus annectens; Pm: Petromyzon marinus; Sc: Scyliorhinus canicula; Xt: Xenopus tropicalis. b) scheme of the ankyrin and trans-membrane (TM) protein domains. c) TPM values for a selection of tissues (red underline for Z-score > 4, light orange for 4 > Z-score > 1). d) expression of trpw1 in the telencephalon of a juvenile (arrowheads point to individual cells). e) expression of trpw1 in the sensory layer (open arrowheads) of the olfactory epithelium of a juvenile. (f, h, l, o) Histological (HES) staining of transverse sections of a juvenile catshark through: the olfactory epithelium (f: general view with h as a close-up on the non-sensory epithelium), the gills l), and anterior vertebra (o); putative ionocytes in the olfactory epithelium and gill epithelium are indicated with open arrowhead. Gene expression patterns for trpv8.2 in the olfactory epithelium (G and close up in (i), in an ampulla of Lorenzini (j), in the gills k), and the vertebra n) of a stage 31 embryo, and in the developing gills m) and vertebra p) of a juvenile catshark. Isolated cells with gene expression are indicated with a black arrowhead; c: ampulla canal (see Fig. 4); cc: central cup (see Fig. 4); nc: notochord, nt: neural tube; se: ampulla sensory epithelium (see Fig. 4).

Update of

Similar articles

Cited by

References

    1. Alexander DH, Novembre J, Lange K. Fast model-based estimation of ancestry in unrelated individuals. Genome Res. 2009:19(9):1655–1664. 10.1101/gr.094052.109. - DOI - PMC - PubMed
    1. Ballard WW, Mellinger J, Lechenault H. A series of stages for development of Scyliorhinus canicula the lesser spotted dogfish (Chondrichthyes: Scyliorhinidae). J Exp Zool. 1993:267(3):318–336. 10.1002/jez.1402670309. - DOI
    1. Baril T, Hayward A. Migrators within migrators: exploring transposable element dynamics in the monarch butterfly, danaus plexippus. Mob DNA. 2022:13(1):5. 10.1186/s13100-022-00263-5. - DOI - PMC - PubMed
    1. Bear DM, Lassance J-M, Hoekstra HE, Datta SR. The evolving neural and genetic architecture of vertebrate olfaction. Curr Biol. 2016:26(20):R1039–R1049. 10.1016/j.cub.2016.09.011. - DOI - PMC - PubMed
    1. Bellono NW, Leitch DB, Julius D. Molecular basis of ancestral vertebrate electroreception. Nature. 2017:543(7645):391–396. 10.1038/nature21401. - DOI - PMC - PubMed

LinkOut - more resources