. 2025 Jan;104(1):104599.
doi: 10.1016/j.psj.2024.104599. Epub 2024 Nov 30.

Effects of maternal Escherichia coli lipopolysaccharide exposure on offspring: insights from lncRNA analysis in laying hens

Affiliations

Effects of maternal Escherichia coli lipopolysaccharide exposure on offspring: insights from lncRNA analysis in laying hens

Lei Liu et al. Poult Sci. 2025 Jan.

Abstract

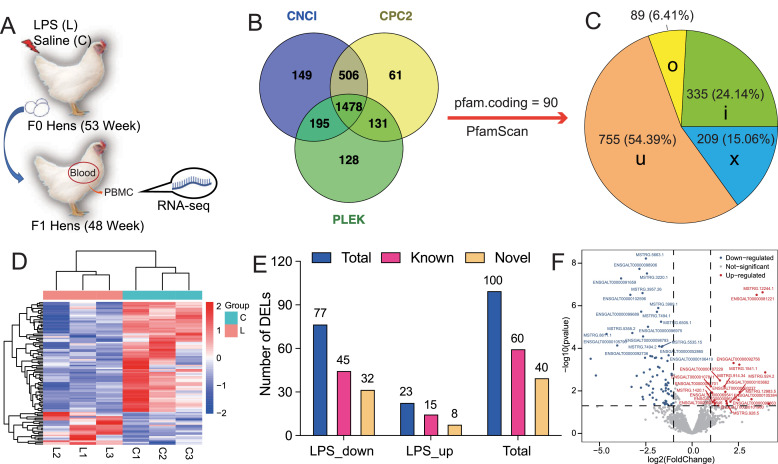
Parental living environment significantly impacts on offspring, yet related studies are lacking in livestock and poultry production. The present study found that lipopolysaccharide (LPS, Escherichia coli, 0.2 mg/kg) stimulation in F0 hens led to growth retardation and a decrease in egg-laying rate in the unchallenged F1 hens. Using strand-specific transcriptomic data of peripheral blood mononuclear cells (PBMCs) in F1 hens, we identified 100 differentially expressed lncRNAs (DELs) and 452 differentially expressed genes (DEGs). LPS primarily affected the metabolic pathways of the offspring, possibly reducing the egg-laying rate of the F1 hens by inhibiting the ferroptosis signaling pathway and the expression of DEGs involved, such as NCOA4, SLC40A1, STEAP3, and TFRC. Using Pearson correlation analysis, we constructed a lncRNA-mRNA-egg-laying rate regulation network and found that the newly identified lncRNA MSTRG.6500.1 and its positively regulated target genes (ENSGALT00000051184, ENSGALT00000053276, NPPA, OSBP2, and TRARG1) were significantly downregulated in the F1 LPS group, which might be the main reason for the decrease in egg-laying rate of the LPS group. These results provide important references for the study of growth and reproductive performance in laying hens, revealing the impact of parental living environment on animal health and production performance, and providing a theoretical basis for future related research and breeding practices.

Keywords: Chicken; Egg-laying rate; LPS maternal stimulation; Offspring; lncRNA.


Conflict of interest statement

Declaration of competing interest The authors declare that they have no known competing financial interests or personal relationships that could have appeared to influence the work reported in this paper.

Figures

Fig 1
Fig. 1
Determination of traits in F1 hens following maternal exposure to LPS. (A) Experimental treatment and traits determination scheme in this study. Body weights of F1 hens were measured at 1 day, 21 days, 142 days, and 259 days of age. Egg weight and egg-laying rate of hens were also measured at 48 weeks of age. (B) Comparison of average egg number between group L and group C during 180 days from 21 to 48 weeks of age (except 267-281 days of age). (C) Comparison of average egg-laying rate between group L and group C during 180 days from 21 to 48 weeks of age (267-281 days of age). (D-G) Body weights of F1 hens at 1 day, 21 days, 142 days, and 259 days of age. (H-I) Comparisons of egg weight (H) and egg-laying rate (I) at 48 weeks of age in sequencing samples of F1 hens.
Fig 2
Fig. 2
Identification of lncRNAs in F1 hens following maternal LPS stimulation. (A) Experimental design of RNA-seq in this study. (B) Venn diagram showing the prediction of lncRNA transcripts coding potential using CNCI, CPC2, and PLEK softwares. Transcripts were further filtered using PfamScan, with ultimately retaining 1,388 novel lncRNA transcripts. (C) Classification of the 1,388 novel lncRNA transcripts, with only the u, i, x, and o types of lncRNAs being counted. u: Unknown, intergenic transcript. i: A transcript falling entirely within a reference intron. x: Exonic overlap with reference on the opposite strand. o: Generic exonic overlap with a reference transcript. (D) Heatmap based on differentially expressed lncRNAs (DELs), showing the differences in lncRNA expression between the two groups of F1 hens. C: control group, L: LPS group. (E) Statistics on the number of DELs, with counts of upregulated, downregulated, and total DELs, further categorized into known and newly identified lncRNAs. (F) Volcano plot of lncRNAs. Red and green dots represent upregulated and downregulated DELs, respectively, while gray dots represent non-significant lncRNAs. The names of the top 20 upregulated and downregulated DELs are displayed.
Fig 3
Fig. 3
Analysis of differentially expressed genes and prediction of lncRNA target genes. (A) Heatmap based on differentially expressed genes (DEGs), showing the differences in gene expression between the two groups of F1 chickens. (B) Statistics of the number of DEGs. Blue, pink, and yellow represent the total number of DEGs, protein-coding DEGs (PCGs), and non-protein-coding DEGs, respectively. (C) Volcano plot of DEGs. Red and green dots represent upregulated and downregulated DEGs, while gray dots represent genes with no significant difference. Names of the top 20 upregulated and downregulated DEGs are shown in the figure. (D) Venn diagram of the target genes number of differentially expressed lncRNAs (DELs). "Cis" and "trans" separately represent the number of target genes regulated in cis- and trans-actions.
Fig 4
Fig. 4
GO enrichment analysis of lncRNA target DEGs. (A) Word cloud annotation of Biological Process (BP) GO terms. (B) Taxonomic summary of the top 30 BP terms. (C) Barplot of the top 20 BP terms sorted by P value. (D) The top 10 BP GO terms and their enriched gene interactions.
Fig 5
Fig. 5
KEGG functional enrichment analysis of lncRNA target DEGs. (A) Word cloud annotation of KEGG pathways. The larger the word, the higher the frequency of the entry. (B) Barplot of the top 20 KEGG pathways sorted by P value. Significantly enriched pathways (P < 0.05) are marked in red. (C) Significantly enriched pathways and their involved genes. The color of the square indicates the expression of the gene, and red and blue indicate that the gene is up-regulated and down-regulated in the LPS group, respectively. (D) KEGG pathway of ferroptosis rendered by pathview. Genes with green background indicate downregulation in the LPS group.
Fig 6
Fig. 6
Correlation analysis between lncRNA target genes and traits. The lncRNA target genes in the figure are all differentially expressed genes (DEGs). Traits include body weight, egg weight, and egg-laying rate, with body weight measured at 1 day, 21 days, 142 days, and 259 days of age, and egg weight and egg-laying rate measured at 48 weeks of age in F1 chickens. No target DEGs significantly correlated with egg weight, so they are not displayed in the figure. All target genes significantly highly correlated with traits (|r| > 0.81, P < 0.05) are shown in the figure. The yellow region in the figure represents body weight, highlighted in red, with higher proportions for body weight at 1 day and 21 days old. The blue region represents egg-laying rate at 48 weeks of age. The red and green bars in the "r" column represent genes positively and negatively correlated with traits, respectively. The red and green bars in the "Log2FoldChange" column represent genes upregulated and downregulated in the LPS group, respectively.
Fig 7
Fig. 7
Diagram illustrating the regulatory pattern of lncRNA on the decrease in egg-laying rate in chickens. Pentagrams and triangles represent differentially expressed lncRNAs (DELs) and genes (DEGs), respectively. Among DELs, those starting with ENSGALT are known DELs, while those starting with MSTRG are novel DELs. The row above shows red and green font indicating upregulation and downregulation of DELs, respectively. The row below shows red and green font indicating upregulation and downregulation of DEGs, respectively. Red lines above indicate significant positive correlation between DELs and DEGs. Red and green lines below represent significant positive and negative correlation between DEGs and egg-laying rate, respectively. Plus and minus signs in the pentagrams represent positive and negative correlation between DELs and egg-laying rate, respectively.
Fig 8
Fig. 8
Regulatory effect of MSTRG.6500.1 on egg-laying rate of F1 hens. (A) Correlation analysis between MSTRG.6500.1 and the five target DEGs, including ENSGALT00000051184, ENSGALT00000053276, NPPA, OSBP2, and TRARG1. (B) Correlation analysis between MSTRG.6500.1 and its five target DEGs with the egg-laying rate of F1 chickens. (C) Expression level comparison of MSTRG.6500.1 and its five target DEGs between the two groups in F1 hens.
Fig 9
Fig. 9
qRT-PCR validation of MSTRG.6500.1 and its target genes. (A) qRT-PCR assay to verify the expression levels of pro-inflammatory cytokines (IL-6 and IL-1β). HD11 cells were treated with LPS for 12 h. (B) qRT-PCR assay to verify the expression changes of DELs and its target DEGs during the immune response of HD11 cells. The results are represented as the means ± SD. P-values were calculated using Student's t-test for qRT-PCR assay. (C-E) Correlation analysis between MSTRG.6500.1 and OSBP2, TRARG1, and NPPA.

Similar articles

References

    1. Andrews, S. 2010. FastQC: a quality control tool for high throughput sequence data. (online).
    1. Bao J., Zou Y., Liu Y., Yuan L., Garfield R.E., Liu H. Nicotine protects fetus against LPS-induced fetal growth restriction through ameliorating placental inflammation and vascular development in late pregnancy in rats. Biosci. Rep. 2019;39:1–9. - PMC - PubMed
    1. Ben Maamar M., Sadler-Riggleman I., Beck D., McBirney M., Nilsson E., Klukovich R., Xie Y., Tang C., Yan W., Skinner M.K. Alterations in sperm DNA methylation, non-coding RNA expression, and histone retention mediate vinclozolin-induced epigenetic transgenerational inheritance of disease. Environ. Epigenet. 2018;4:1–19. - PMC - PubMed
    1. Bidne K., Dickson M., Ross J., Baumgard L., Keating A. Disruption of female reproductive function by endotoxins. Reprod. 2018;155:R169–R181. - PubMed
    1. Bradford B., Yuan K., Farney J., Mamedova L., Carpenter A. Invited review: inflammation during the transition to lactation: new adventures with an old flame. J. Dairy Sci. 2015;98:6631–6650. - PubMed