. 2025 Feb 2;40(2):283-298.
doi: 10.1093/jbmr/zjae195.

Enhanced fatty acid oxidation in osteoprogenitor cells provides protection from high-fat diet induced bone dysfunction

Affiliations

Enhanced fatty acid oxidation in osteoprogenitor cells provides protection from high-fat diet induced bone dysfunction

Ananya Nandy et al. J Bone Miner Res. .

Abstract

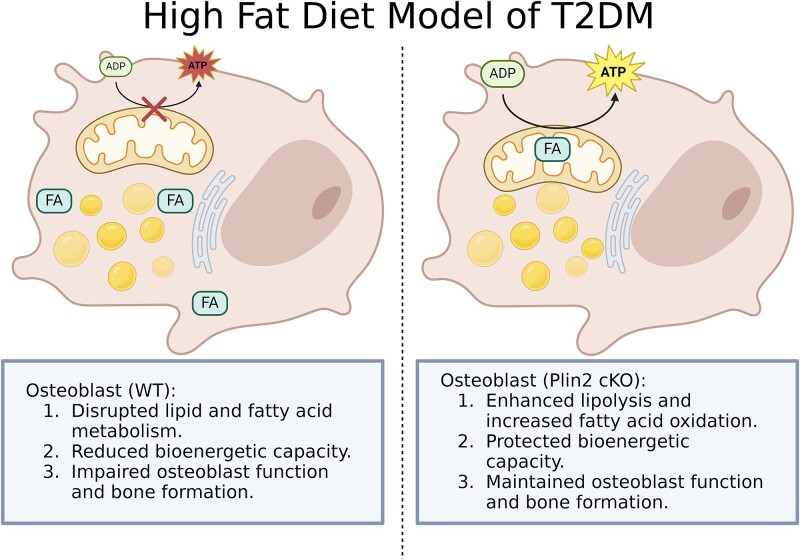
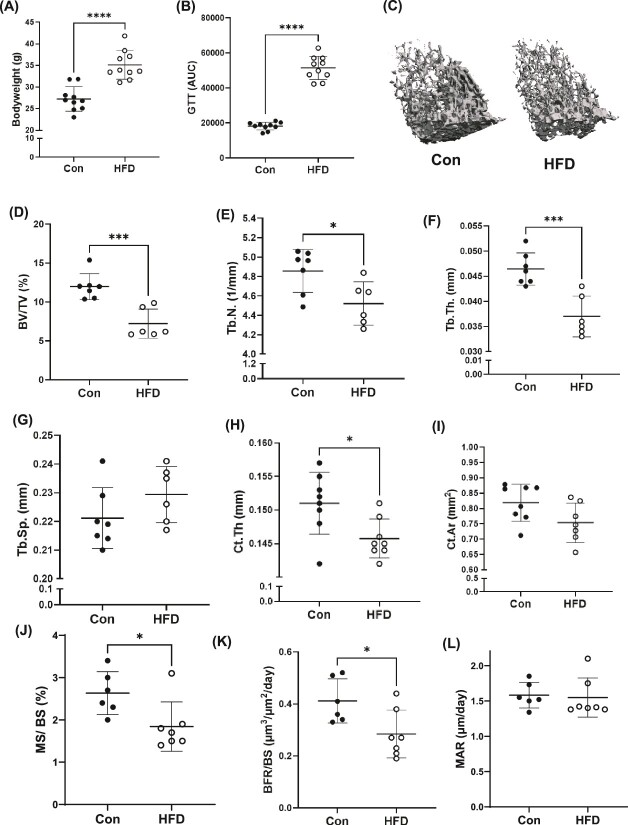
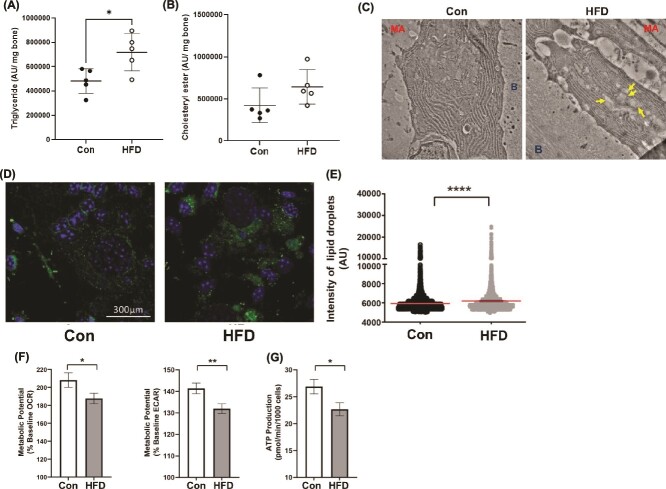
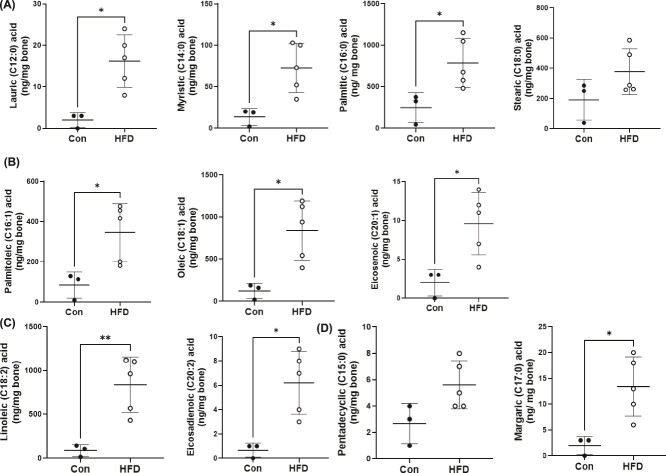
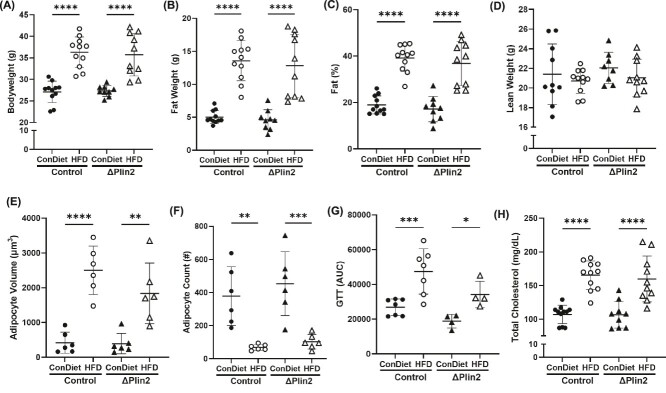
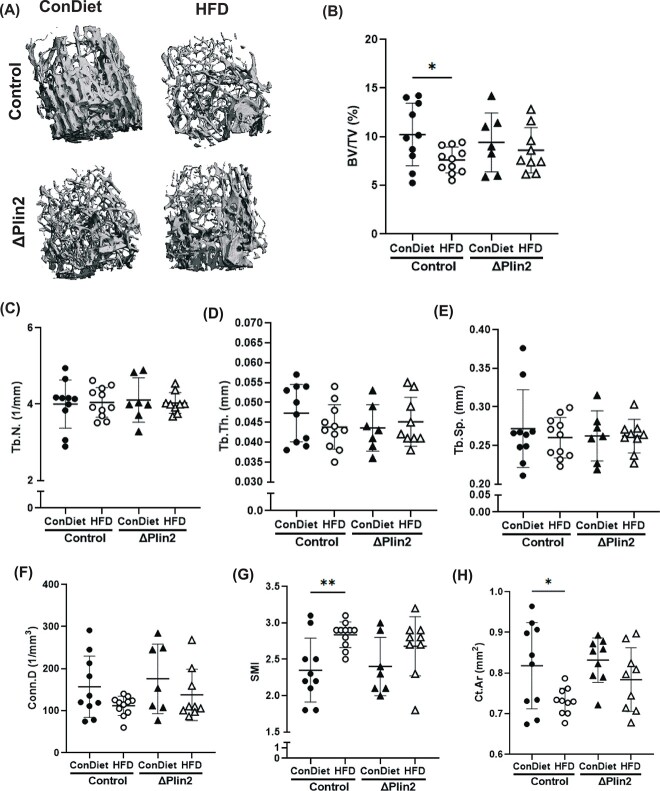
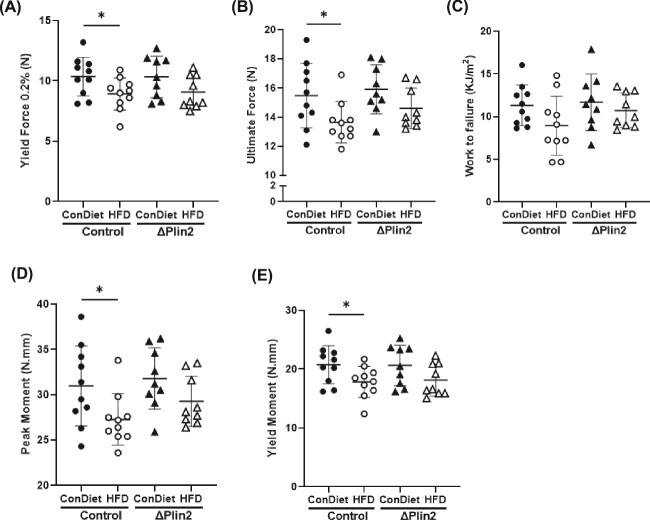
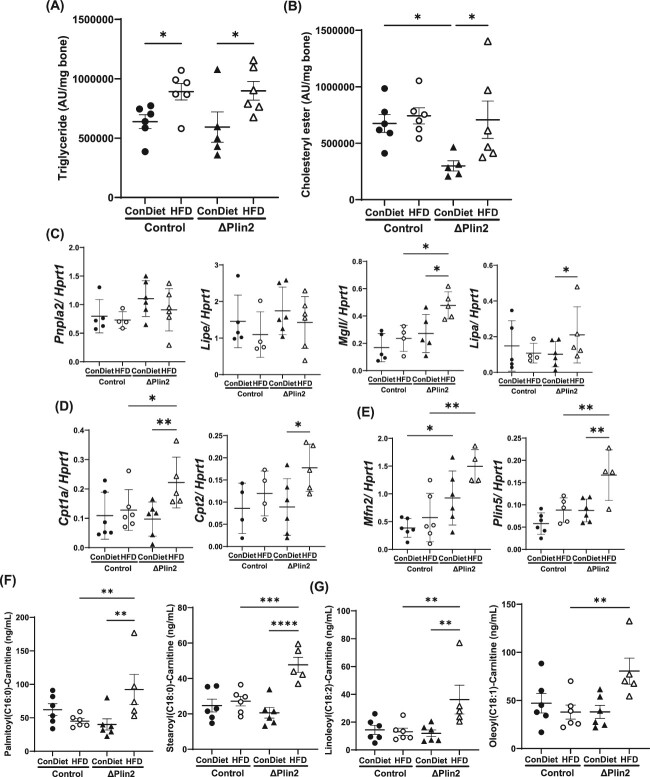
Bone homeostasis within the skeletal system is predominantly maintained by bone formation and resorption, where formation of new bone involves maturation of stromal cells to mineral and matrix secreting mature osteoblasts, which requires cellular energy or adenosine triphosphate. Alterations in systemic metabolism can influence osteoblast function. In line with this, type 2 diabetes mellitus (T2DM), a common metabolic disorder is also associated with reduced bone formation and increased risk of fracture. Impairment in lipid metabolism is one of the key features associated with T2DM-related pathologies in multiple tissues. Therefore, we tested the hypothesis that the reduced bone formation reported in obese murine models of impaired glucose tolerance is a function of disrupted lipid metabolism in osteoblasts. We first confirmed that mice fed a high-fat diet (HFD) have reduced bone microarchitecture along with lower bone formation rates. Interestingly, osteoblasts from obese mice harbor higher numbers of cytosolic lipid droplets along with decreased bioenergetic profiles compared to control cells. Further supporting this observation, bone cortex demonstrated higher total lipid content in HFD fed mice compared to control-fed mice. As a further proof of principle, we generated a novel murine model to conditionally delete Plin2 in osteoblast-progenitor cells using Prrx1-Cre, to enhance lipid droplet breakdown. Our data demonstrate that knocking down Plin2 in an osteoprogenitor specific manner protects from HFD induced osteoblast dysfunction. Furthermore, the mechanism of action involves enhanced osteoblast fatty acid oxidation. In conclusion, the current studies establish that HFD induced glucose intolerance leads to perturbations in osteoblast lipid metabolism, thus causing lower bone formation, which can be protected against by increasing fatty acid oxidation.

Keywords: diabetes; fracture; lipids; metabolism; perilipin 2.

Plain language summary

Obesity is a chronic condition that results from excess fat, which can result in diseases such as type 2 diabetes mellitus. A striking consequence of diabetes is weaker bones leading to the increased risk of fracture; however, factors contributing to this remain unknown. Due to the connection between altered fat metabolism during diabetes, along with weaker bones, we sought to investigate how bone cell fat metabolism was altered during diabetes. First, we demonstrate that high-fat diet mouse models of diabetes resulted in lower bone formation as a function of fat accumulation in the bone, with lower energy production. We next used a genetic mouse model to promote fat metabolism in bone cells responsible for bone formation. Interestingly, these mice were protected from diabetes-associated bone loss. We were able to demonstrate this protection was through changes in bone cell fat metabolism. Collectively, these data establish that bone cell fat metabolism is critical for bone formation and bone quality, and that conditions such as diabetes result in altered fat metabolism and contribute to bone fragility.


Conflict of interest statement

The authors have no conflict of interest to declare.

Figures

Graphical Abstract
Graphical Abstract
Figure 1
Figure 1
Effect of high fat diet (HFD) on systemic metabolism and skeletal parameters. (A) Body weight and (B) fasting glucose tolerance test of C57BL/6N mice fed a control diet (con) or HFD for 8 wk. (C) Representative 3-D micro-computed tomography images of trabecular bone at the distal femur metaphysis. Trabecular bone parameters include (D) bone volume over total volume (%); (E) trabecular number (Tb.N; mm−1); (F) trabecular thickness (Tb.Th; mm); and (G) trabecular separation (Tb.Sp; mm). Each dot represents data from individual animals, where (n = 6-7). Cortical bone parameters include (H) thickness (Ct.Th; mm) and (I) area (Ct.Ar; mm2). Bone histomorphometry analysis of the proximal tibia to include (J) mineralization surface over bone surface; (K) mineral apposition rate (μm·d−1); and (L) bone formation rate over bone surface (μm3·μm−2·d−1). Each dot represents data from individual animals (n = 6-10). Statistical comparisons are between the two groups using unpaired t-tests. All results are expressed as mean ± SD. *p < .05, **p < .01, ***p < .001, ****p < .0001.
Figure 2
Figure 2
Lipid metabolism in bone and osteoblasts. Thin-layer chromatogram of lipids harvested from flushed tibias following 8 wk on a control (Con) and high fat diet (HFD) of (A) triglyceride and (B) cholesteryl ester normalized to bone weight. Each dot represents data from individual animals (n = 5). All results are expressed as mean ± SD. (C) Transmission electron microscopy image of thinly sectioned tibia depicting lipid droplets (yellow arrow) in the cytosol of osteoblasts positioned in between the bone surface (B) and marrow area in control (Con) and HFD fed mice. The images were taken at 4000× magnification. (D) Representative confocal image of ex vivo bone marrow stromal cells following 8 days in osteogenic differentiation medium from control (Con) and high fat diet (HFD) fed mice in which cellular lipid droplets were stained with BODIPY 493/503 and DAPI. Quantification of (E) intensity of BODIPY 493/503-stained lipid droplets in differentiated osteoblasts from control or high fat diet fed mice, where each dot represents the intensity of one lipid droplet. (F) Seahorse cell energy phenotype assay for metabolic potential measured in terms of percentage baseline oxygen consumption rate and percentage extracellular acidification rate and (G) Adenosine triphosphate production rates. Seahorse data are from cells pooled from n = 10 animals from each group and seeded with technical replicates for the cell culture experiments. Statistical comparisons are between the two groups using unpaired t-tests. *p < .05, **p < .01, ***p < .001, ****p < .0001.
Figure 3
Figure 3
Quantification of long chain fatty acids in the tibia cortex following a control (con) or high fat diet. Mass spectrometric quantification of (A) saturated fatty acids lauric (C12:0), myristic (C14:0), palmitic (C16:0), and stearic acid (C18:0); (B) monounsaturated fatty acids palmitoleic (C16:1), oleic (C18:1), eicosenoic acid (C20:1); (C) Di-unsaturated fatty acids linoleic acid (C18:2) and eicosadienoic acid (C20:2); (D) odd chain numbered fatty acids pentadecylic acid (C15:0) and margaric acid (C17:0). Fatty acid quantity is normalized to bone tissue weight. Each dot represents data from individual animal (n = 3-5). All results are expressed as mean ± SD. Statistical comparisons are between the two groups using unpaired t-tests. *p < .05, **p < .01, ***p < .001, ****p < .0001.
Figure 4
Figure 4
Targeted knockdown of Perilipin2 in osteoprogenitor cells does not affect systemic metabolism. (A) Body weight of control mice or ΔPlin2 mice fed a control (ConDiet) or high fat diet for 12-wk (p-value: genotype = 0.0592; diet = <0.0001). (B) Fat mass (p-value: genotype ≤ 0.0423; diet ≤ 0.0001), (C) fat percentage (p-value: genotype = 0.0828; diet ≤ 0.0001), and (D) lean body mass (p-value: genotype = 0.9304; diet = 0.5699). Histological analysis of subcutaneous adipocyte (E) volume (p-value: Genotype = 0.6992; diet ≤ 0.0001) and (F) number (p-value: genotype = 0.4519; diet = 0.0002) following H&E-staining. (G) Area under the curve following a fasting, intraperitoneal glucose tolerance test (p-value: genotype = 0.2204; diet = 0.0010) and (H) serum total cholesterol (p-value: genotype = 0.0454; diet ≤ 0.0001). Each dot represents data from individual animal, (n = 6-11). All results are expressed as mean ± SD. Significant differences were established using 2-way analyses of variance (2-way ANOVA) with genotype and diet as independent variables, with post-hoc uncorrected Fisher’s LSD tests. Values of p < .05 were considered significant, with p-values depicted as *p < .05, **p < .01, ***p < .001, ****p < .0001.
Figure 5
Figure 5
High fat diet-induced compromise in bone microarchitecture is protected in ΔPlin2 mice. (A) Representative 3D micro-computed tomography images of trabecular bone from the distal femur metaphysis. Parameters include (B) bone volume over total volume (%) (p-value: genotype = 0.8557; diet = 0.0503); (C) trabecular (Tb.N; mm−1) (p-value: genotype = 0.0752; diet = 0.6424); (D) trabecular thickness (Tb.Th; mm) (p-value: genotype = 0.5286; diet = 0.5618); (E) trabecular separation (Tb.Sp; mm) (p-value: genotype = 0.1811; diet = 0.7020); (F) connectivity density (Conn.D; 1/mm3) (p-value: genotype = 0.4503; diet = 0.0996); (G) structural model index (p-value: genotype = 0.7465; diet = 0.0272). Cortical bone analysis of the femur mid-diaphysis includes (H) cortical bone area (Ct.Ar; mm2) (p-value: genotype = 0.3800; diet = 0.0240). Each dot represents data from individual animal (n = 7-10). All results are expressed as mean ± SD. Significant differences were established using 2-way analyses of variance (2-way ANOVA) with genotype and diet as independent variables, with post-hoc uncorrected Fisher’s LSD tests. Values of p < .05 were considered significant, with p-values depicted as *p < .05, **p < .01, ***p < .001, ****p < .0001.
Figure 6
Figure 6
ΔPlin2 mice display protection against high-fat diet (HFD)-induced bone fragility. Three-point bending analysis of the femur from control diet (ConDiet) or HFD fed control or ΔPlin2 mice. Parameters include (A) yield force (N) (p-value: genotype = 0.5299; diet = 0.0809); (B) ultimate force (N) (p-value: genotype = 0.5748; diet = 0.0409); (C) work to failure (KJ/m2) (p-value: genotype = 0.5157; diet = 0.2230); (D) peak moment (N.Mm) (p-value: genotype = 0.5807; diet = 0.0415); and (E) yield moment (N.Mm) (p-value: genotype = 0.521; diet = 0.0801). Each dot represents data from individual animal (n = 9-10). All results are expressed as mean ± SD. Significant differences were established using 2-way analyses of variance (2-way ANOVA) with genotype and diet as independent variables, with post-hoc uncorrected Fisher’s LSD tests. Values of p < .05 were considered significant, with p-values depicted as *p < .05, **p < .01, ***p < .001, ****p < .0001.
Figure 7
Figure 7
Targeted knockdown of Plin2 in osteoprogenitor cells alters lipid metabolism in bone. Densitometric quantification from thin layer chromatography (TLC) of the lipid species harvested from flushed tibias (A) triglyceride (p-value: genotype = 0.4646; diet = 0.0373); (B) cholesteryl ester (p-value: genotype = 0.3773; diet = 0.0433) normalized to bone weight. Quantitative real time PCR of target genes involved in (C) lipolysis [Pnpla2 (p-value: genotype = 0.3006; diet = 0.2900), Lipe (p-value: genotype = 0.0258; diet = 0.4887), Mgll (p-value: genotype = 0.8772; diet = 0.0139), Lipa (p-value: genotype = 0.0515; diet = 0.1669)]; (D) fatty acid oxidation [Cpt1a (p-value: genotype = 0.2261; diet = 0.0429), Cpt2 (p-value: genotype = 0.7165; diet = 0.0987)]; and (E) mitochondria-lipid droplet contact sites [Mfn2 (p-value: genotype = 0.6696; diet = 0.0071), Plin5 (p-value: genotype = 0.2280; diet = 0.0009)] normalized to Hprt1 from flushed femurs. Mass spectrometric quantification of carnitinylated long chain fatty acids within the tibia cortex to include (F) carnitinylated saturated fatty acids palmitoyl (C16:0)-carnitine (p-value: genotype = 0.1689; diet = 0.0165), stearoyl (C18:0)-carnitine (p-value: genotype = 0.3166; diet = 0.0002); (G) unsaturated fatty acids linoleoyl (C18:2)-carnitine (p-value: genotype = 0.4155; diet = 0.0139), and oleoyl (C18:1)-carnitine (p-value: genotype = 0.2562; diet = 0.0106). Each dot represents data from individual animal. All results are expressed as mean ± SD. Significant differences were established using 2-way analyses of variance (2-way ANOVA) with genotype and diet as independent variables, with post-hoc uncorrected Fisher’s LSD tests. Values of p < .05 were considered significant, with p-values depicted as *p < .05, **p < .01, ***p < .001, ****p < .0001.

Similar articles

References

    1. Zaidi M. Skeletal remodeling in health and disease. Nat Med. 2007;13(7):791–801. 10.1038/nm1593 - DOI - PubMed
    1. Iqbal J, Sun L, Zaidi M. Coupling bone degradation to formation. Nat Med. 2009;15(7):729–731. 10.1038/nm0709-729 - DOI - PubMed
    1. Teitelbaum SL, Ross FP. Genetic regulation of osteoclast development and function. Nat Rev Genet. 2003;4(8):638–649. 10.1038/nrg1122 - DOI - PubMed
    1. Ikeda K, Takeshita S. The role of osteoclast differentiation and function in skeletal homeostasis. J Biochem. 2016;159(1):1–8. 10.1093/jb/mvv112 - DOI - PMC - PubMed
    1. de Liefde II, van der Klift M, de Laet CEDH, van Daele PLA, Hofman A, HAP P. Bone mineral density and fracture risk in type-2 diabetes mellitus: the Rotterdam study. Osteoporos Int. 2005;16(12):1713–1720. 10.1007/s00198-005-1909-1 - DOI - PubMed