. 2024 Dec 17;5(12):101850.
doi: 10.1016/j.xcrm.2024.101850. Epub 2024 Dec 9.

Ongoing evolution of SARS-CoV-2 drives escape from mRNA vaccine-induced humoral immunity

Affiliations

Ongoing evolution of SARS-CoV-2 drives escape from mRNA vaccine-induced humoral immunity

Alex L Roederer et al. Cell Rep Med. .

Abstract

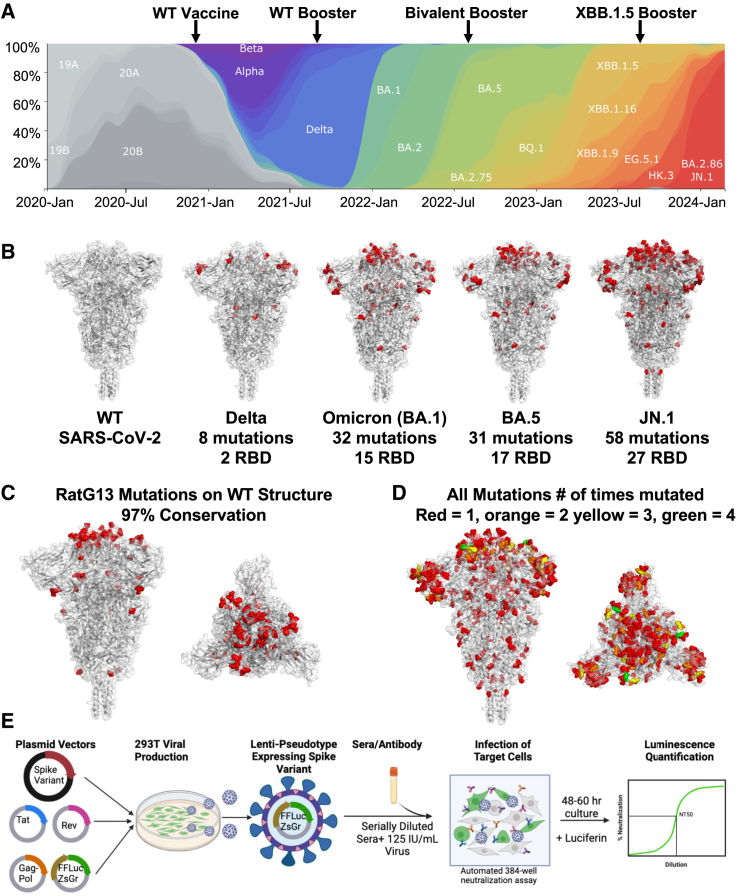
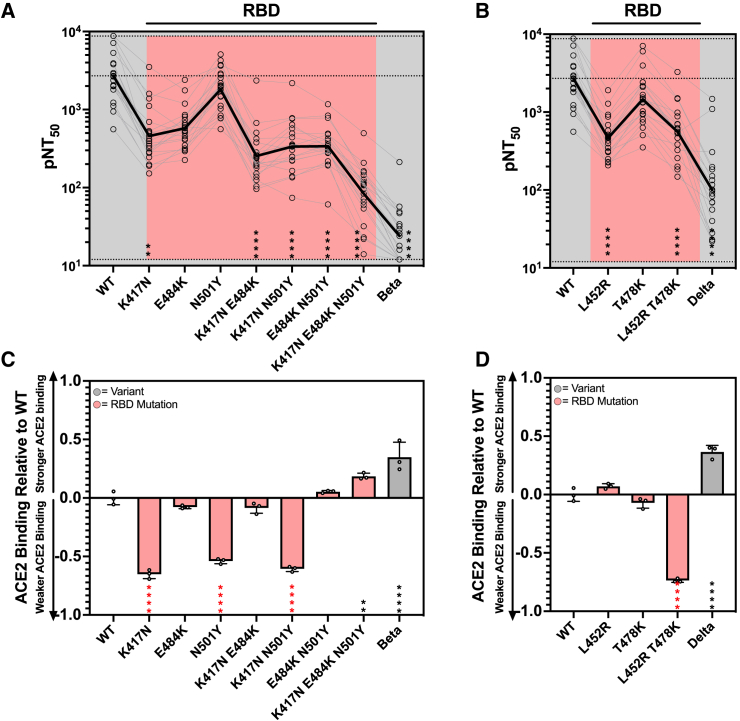
With the onset of the COVID-19 pandemic 4 years ago, viral sequencing continues to document numerous individual mutations in the viral spike protein across many variants. To determine the ability of vaccine-mediated humoral immunity to combat continued SARS-CoV-2 evolution, we construct a comprehensive panel of pseudoviruses harboring each individual mutation spanning 4 years of the pandemic to understand the fitness cost and resistance benefits of each. These efforts identify numerous mutations that escape from vaccine-induced humoral immunity. Across 50 variants and 131 mutants we construct, we observe progressive loss of neutralization across variants, irrespective of vaccine doses, as well as increasing infectivity and ACE2 binding. Importantly, the recent XBB.1.5 booster significantly increases titers against most variants but not JN.1, KP.2, or KP.3. These findings demonstrate that variants continue to evade updated mRNA vaccines, highlighting the need for different approaches to control SARS-CoV-2 transmission.

Keywords: COVID-19; SARS-CoV-2; breadth; infectivity; neutralizing antibodies; vaccination; variants.


Conflict of interest statement

Declaration of interests A.B.B. is a founder of Cure Systems LLC.

Figures

None
Graphical abstract
Figure 1
Figure 1
SARS-CoV-2 variants of concern harbor spike protein mutations that are enriched in the RBD (A) Scaled stacked area chart of variants emerging during the SARS-CoV-2 pandemic. Arrows denote when each vaccine was made available. Adapted from nextstrain.org. Data as of February 28, 2024. (B) Crystal structures of pre-fusion stabilized SARS-CoV-2 spike trimer (PDB ID 6XR8,https://doi.org/10.2210/pdb6XR8/pdb) highlighting mutations found in each strain mapped onto their locations on the wild-type spike trimer. From left to right WT, Delta (B.1.617.2), Omicron (BA.1), BA.5, and JN.1 strains. Mutations highlighted for each strain are from corresponding Table S1. (C) Crystal structure of pre-fusion stabilized SARS-CoV-2 spike trimer (PDB ID 6XR8,https://doi.org/10.2210/pdb6XR8/pdb) with differences with the closely related RaTG13 coronavirus highlighted in red (front and top view) on the WT spike trimer. (D) Crystal structure of pre-fusion stabilized SARS-CoV-2 spike trimer (PDB ID 6XR8,https://doi.org/10.2210/pdb6XR8/pdb) with all 164 mutations found in variants of concern and variants of interest up to and including JN.1, mapped onto the WT spike, and colored by the number of times they have been observed in a single variant of concern or variant of interest. Red = 1, orange = 2 yellow = 3, green = 4. (E) Schematic of high-throughput neutralization assay used in these studies.
Figure 2
Figure 2
Comprehensive neutralization assays with primary vaccine sera revealed regions of vulnerability within the natural mutation landscape (A) Schematic illustrating the time period from which variants were selected and the vaccinee sera to be tested below. (B) Titers (n = 2 per sample per pseudovirus) that achieve 50% of pseudovirus neutralization (pNT50) are plotted for mutants with significant escape primary vaccination regimen (2 doses of Pfizer) found in SARS-CoV-2 through Delta (1.617.2). The solid black line represents geometric mean pNT50 for reference. The following abbreviations are used: NTD, N-terminal domain; RBD, receptor binding domain; S1, S1 subunit; S2, S2 subunit. (C) Spike structure (PDB ID: 6XR8,https://doi.org/10.2210/pdb6XR8/pdb) with mutations critical for escape from primary vaccine sera mapped onto the spike. The geometric mean pNT50 value for mutations relative to WT was log transformed into a B factor on a scale of −0.9 to 0.9. (D) Individual pseudovirus mutants that escaped primary vaccinees were measured for ACE2 binding. These values were then normalized to WT binding and log transformed. Binding was done for each mutant in technical triplicates (n = 3). Data are represented as mean ± SD (∗p < 0.0332, ∗∗p < 0.0021, ∗∗∗p < 0.0002, ∗∗∗∗p < 0.0001). (E) Neutralization titer relative to WT (average of n = 2) for primary vaccinees was plotted against ACE2 binding relative to WT (average of n = 3). Both values are log transformed, and a correlation between them was detected with p = 0.0134. Numbers of mutations and percentages in each quadrant are listed, and mutations are colored according to their location on the spike. (F) Two-way hierarchical clustering of pNT50 values of sera obtained from vaccinated donors (rows) across each variant (columns) relative to individual donor WT titer. pNT50 values are plotted in a heatmap colored according to neutralizing activity relative to WT. Donors with WT neutralizing titers at the maximum of our assay were excluded. Mutations where a significant majority of donor titers reached the limit of detection were also excluded. Clustering was performed using pheatmap package v1.0.12 in RStudio.
Figure 3
Figure 3
Combinations of individual mutations yield neutralization resistance and variable ACE2 binding (A and B) Primary series vaccinee sera (average of n = 2) was tested via pseudovirus-based neutralization assays against combinations of RBD mutations found in the (A) Beta variant or (B) Delta strain. Each variant was compared to the wild type using a one-way ANOVA with Friedman’s test and Dunn’s multiple comparisons test. (∗ = p < 0.0332, ∗∗ = p < 0.0021, ∗∗∗ = p < 0.0002, ∗∗∗∗ = p < 0.0001). (C and D) Single, double, or triple RBD mutants for the Beta (C) and Delta (D) variants were measured for ACE2 binding. Mutants were co-transfected with a zsgreen plasmid to be expressed on the surface of cells, and ACE2 binding was measured using a fluorescently labeled recombinant ACE2 protein using median fluorescence intensity of ACE2 Alexa 647, spike-positive (green) cells. Experiments were performed in technical triplicates (n = 3). Data are represented as mean ± SD. These values were then normalized to WT binding and log transformed. ACE2 binding was compared to WT using a one-way ANOVA with Dunn’s multiple comparisons test. (∗p < 0.0332, ∗∗p < 0.0021, ∗∗∗p < 0.0002, ∗∗∗∗p < 0.0001). ∗, significantly worse ACE2 binding.
Figure 4
Figure 4
mRNA boosters significantly enhance neutralization of SARS-CoV-2 mutants (A) (Top) schematic illustrating the time period from which variants were selected and the vaccinee sera to be tested below. (B) (Bottom) primary or boosted pNT50 (n = 2) for donors across each variant was normalized to geometric mean titer across all donors for WT and log transformed. Length of each vertical line illustrates pNT50 change. (C) Titers (n = 2 per sample per pseudovirus) that achieve 50% of pseudovirus neutralization (pNT50) are plotted for mutants with significant escape boosted vaccination regimen found in SARS-CoV-2 through Delta (1.617.2). The solid black line represents geometric mean pNT50 for reference. The following abbreviations are used: NTD, N-terminal domain; RBD, receptor binding domain; S1, S1 subunit; S2, S2 subunit. (D) Log-transformed pNT50 geometric mean values (average of n = 2) for each variant relative to WT for primary series were plotted against matching boosted values. Linear regression (R2 = 0.5109; slope = −0.098; p < 0.001). Mutations that were escaped for primary vaccinees only or primary and boosted vaccinees are indicated. Labeled mutations are those that had the biggest change in pNT50 value relative to WT for boosted donors. Mutations that were escaped from primary series are highlighted in purple, and those that escape primary and boosted are pink. (E) Log-transformed pNT50 geometric mean values (average of n = 2) for each variant relative to WT colored according to their location in the spike protein comparing primary to boosted vaccinee sera. Statistics represent Wilcoxon two-tailed paired, nonparametric t test with ∗∗∗∗p < 0.0001. Selected RBD mutations from the delta and beta strains connected with lines showing their respective values for primary or boosted donor serum.
Figure 5
Figure 5
Individual Omicron variants reveal sites of resistance that are observed in more recent strains to significantly escape from boosted sera (A) Schematic illustrating the time period from which variants were selected and the vaccinee sera to be tested below. (B) pNT50 are plotted for all individual spike mutations occurring through XBB.1.16 variant with significant escape from 22 COVID naive boosted donors (n = 2 per sample per pseudovirus). The solid black line indicates the geometric mean of the titers against each pseudovirus. The following abbreviations are used: NTD, N-terminal domain; RBD, receptor binding domain; S1, S1 subunit; S2, S2 subunit. (C) Individual pseudovirus mutants that escaped boosted vaccinees were measured for ACE2 binding. These values were then normalized to WT binding and log transformed. All experiments were performed in technical triplicates (n = 3). ∗, significantly worse ACE2 binding. Data are represented as mean ± SD (∗p < 0.0332, ∗∗p < 0.0021, ∗∗∗p < 0.0002, ∗∗∗∗p < 0.0001). (D) Neutralization titer relative to WT (average of n = 2) for boosted vaccinees was plotted against ACE2 binding relative to WT (average of n = 3). Both values are log transformed, and a correlation between them was detected with p = 0.0002. Numbers of mutations and percentages in each quadrant are listed, and mutations are colored according to their location on the spike. (E) ACE binding relative to WT and infectivity relative to WT were plotted against each other. Each variant was tested in technical triplicates (average of n = 3). ACE2 binding and infectivity were assessed for correlation using a nonparametric two-tailed spearman correlation. p = 0.33.
Figure 6
Figure 6
Updated COVID boosters improve neutralization against dominant variants throughout the pandemic (A) Schematic illustrating the variants and vaccinee sera to be tested below. (B) Geometric mean pNT50 values of longitudinal serum samples (average of n = 2) over the course of CDC-recommended vaccination schedule against each variant. Strains are plotted in the order in time that they first appear in GISAID. (C) pNT50 of individual serum samples (average of n = 2) were normalized to geometric mean titer across all donors for WT and log transformed. Longitudinal samples from donors after WT, bivalent, or XBB.1.5 boosters are plotted. Length of each vertical line illustrates pNT50 change. (D) Log-transformed pNT50 geometric mean values (average of n = 2) relative to WT for donor sera against variants of concern through JN.1 plotted against the date of first submission to GISAID. Solid lines represent linear regressions for WT booster (R2 = 0.63, slope = −0.298, p = 0.002), bivalent booster (R2 = 0.57, slope = −0.24, p = 0.0018), and XBB.1.5 booster titers (R2 = 0.31, slope = −0.133, p = 0.0379). (E) One-way hierarchical clustering of pNT50 values of sera obtained from boosted donors (rows) across each variant of concern (columns) relative to individual donor WT titer. Heatmaps maintaining clustering order of rows across bivalent and XBB.1.5 boosters are plotted to the right. pNT50 values are plotted in heatmaps colored according to neutralizing activity relative to WT. Clustering was performed using pheatmap package v1.0.12 in RStudio.
Figure 7
Figure 7
SARS-CoV-2 variants of concern have accumulated spike mutations increasing their infectivity and ACE2 binding over time (A) Individual pseudovirus mutants were measured for ACE2 binding. All experiments were done in technical triplicates (n = 3). These values were then normalized to WT binding and compared to SARS-CoV-2 using a one-way ANOVA with Holm-Sidak correction for multiple comparisons. (∗ = p < 0.033, ∗∗ = p < 0.0021, ∗∗∗ = p < 0.0002, ∗∗∗∗ = p < 0.0001). Data are represented as mean ± SD. (B) ACE2 binding values (average of n = 3) plotted for each variant relative to the time it was first submitted to the GISAID database. A simple linear regression was performed with R2 = 0.53, p = 0.0047, slope = 0.707. (C) Pseudovirus infectivity (defined as infectious units per genome copy) was normalized to WT infectivity for each variant spike across technical triplicates (n = 3). Pseudovirus infectivity relative to WT was measured for major SARS-CoV-2 variants by calculating fold change in slope of linear regressions fit across known dilutions. Bars and error bars depict mean and standard error of the mean. Each pseudovirus was compared to SARS-CoV-2 wild type using a one-way ANOVA with Holm-Sidak correction for multiple comparisons. (∗ = p < 0.033, ∗∗ = p < 0.0021, ∗∗∗ = p < 0.0002, ∗∗∗∗ = p < 0.0001). Data are represented as mean ± SD. (D) Pseudovirus infectivity values (average of n = 3) plotted for each variant relative to the time it was first submitted to the GISAID database. A simple linear regression was performed with R2 = 0.42, p = 0.0179, and slope = 5.89.

Update of

References

    1. Cucinotta D., Vanelli M. WHO Declares COVID-19 a Pandemic. Acta Biomed. 2020;91:157–160. doi: 10.23750/abm.v91i1.9397. - DOI - PMC - PubMed
    1. WHO Coronavirus (COVID-19) Dashboard https://covid19.who.int.
    1. Worldometers info. 2023. Worldometer - FAQ.https://www.worldometers.info/faq/
    1. Korber B., Fischer W.M., Gnanakaran S., Yoon H., Theiler J., Abfalterer W., Hengartner N., Giorgi E.E., Bhattacharya T., Foley B., et al. Tracking Changes in SARS-CoV-2 Spike: Evidence that D614G Increases Infectivity of the COVID-19 Virus. Cell. 2020;182:812–827.e19. doi: 10.1016/j.cell.2020.06.043. - DOI - PMC - PubMed
    1. Plante J.A., Liu Y., Liu J., Xia H., Johnson B.A., Lokugamage K.G., Zhang X., Muruato A.E., Zou J., Fontes-Garfias C.R., et al. Spike mutation D614G alters SARS-CoV-2 fitness. Nature. 2021;592:116–121. doi: 10.1038/s41586-020-2895-3. - DOI - PMC - PubMed

MeSH terms

Supplementary concepts