. 2024 Dec 17;5(12):101868.
doi: 10.1016/j.xcrm.2024.101868. Epub 2024 Dec 9.

Castrate-resistant prostate cancer response to taxane is determined by an HNF1-dependent apoptosis resistance circuit

Affiliations

Castrate-resistant prostate cancer response to taxane is determined by an HNF1-dependent apoptosis resistance circuit

Ilya S Senatorov et al. Cell Rep Med. .

Abstract

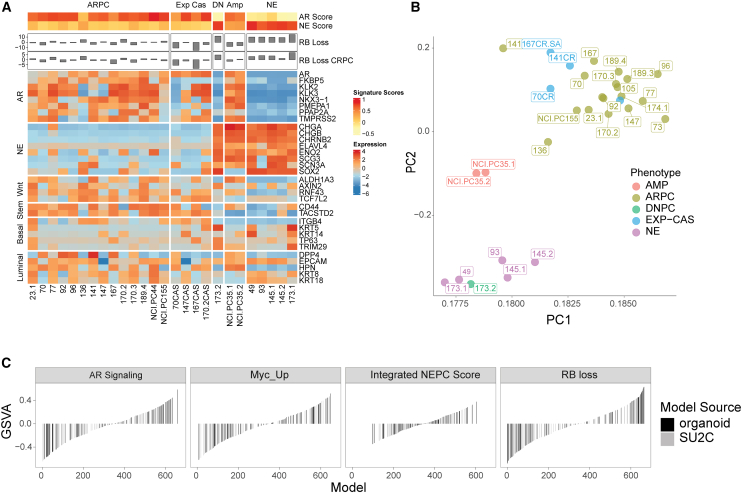
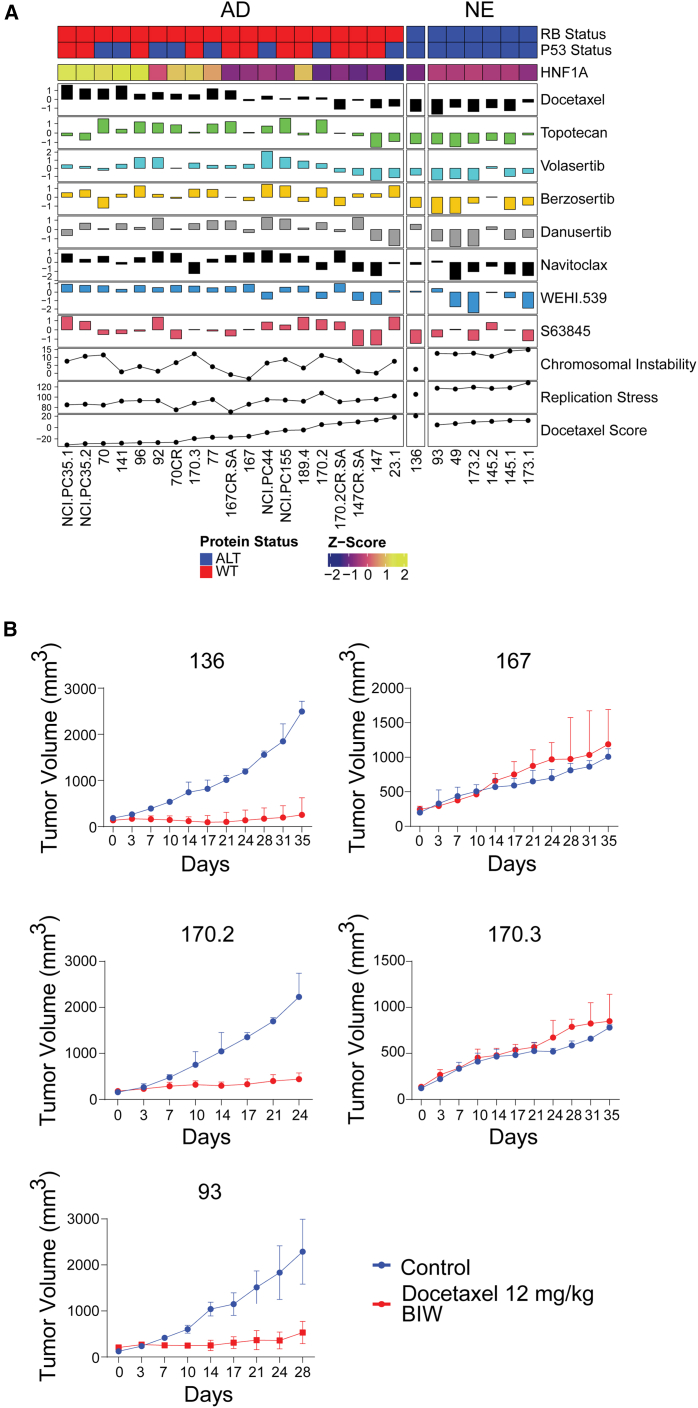
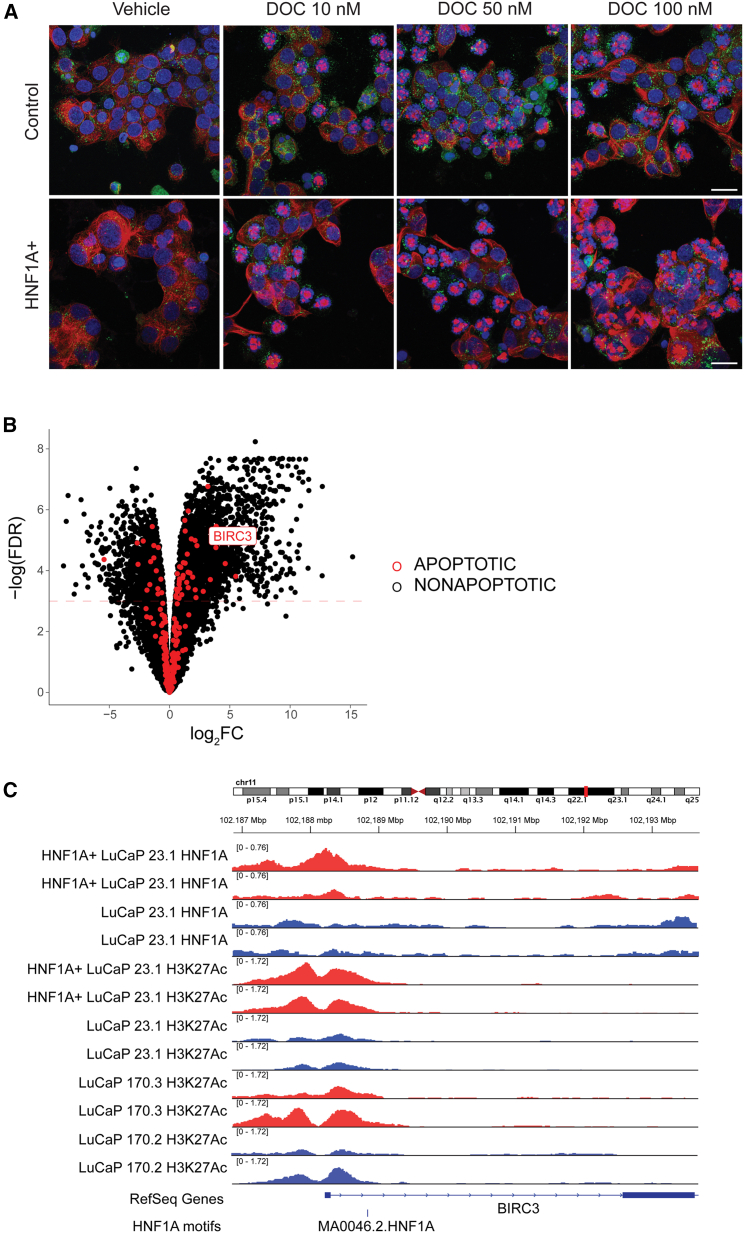
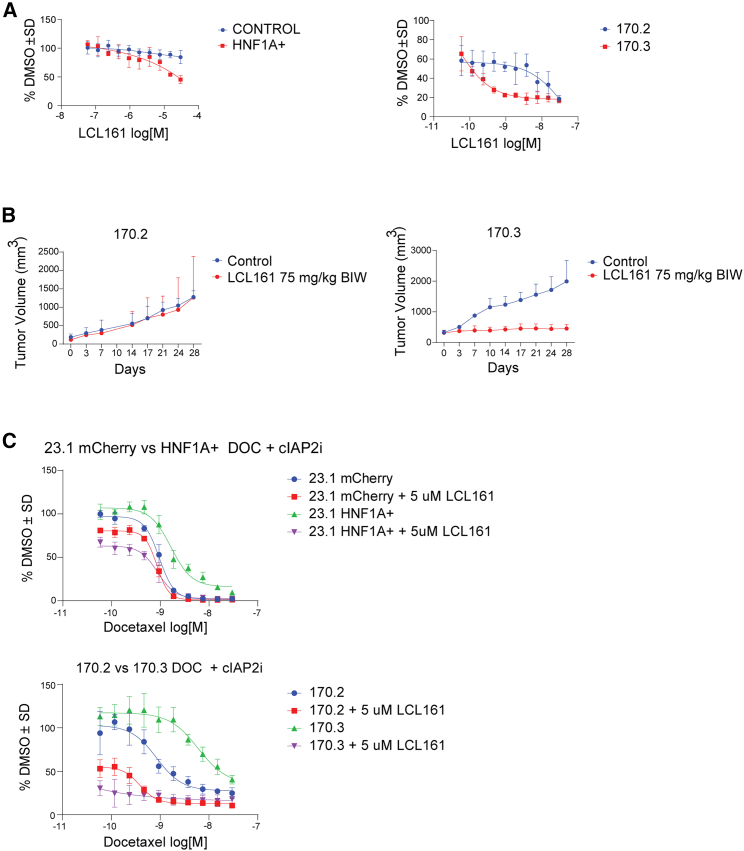
Metastatic castrate-resistant prostate cancer (mCRPC) is a genetically and phenotypically heterogeneous cancer where advancements are needed in biomarker discovery and targeted therapy. A critical and often effective component of treatment includes taxanes. We perform a high-throughput screen across a cohort of 30 diverse patient-derived castrate-resistant prostate cancer (CRPC) organoids to a library of 78 drugs. Combining quantitative response measures with transcriptomic analyses demonstrates that HNF1 homeobox A (HNF1A) drives a transcriptional program of taxane resistance, commonly dependent upon cellular inhibitor of apoptosis protein 2 (cIAP2). Monotherapy with cIAP2 inhibitor LCL161 is sufficient to treat HNF1A+ models of mCRPC previously resistant to docetaxel. These data may be useful in future clinical trial designs.

Keywords: BIRC3; HNF1A; apoptosis; docetaxel; drug resistance; organoid; pharmacology; prostate cancer; xenograft.


Conflict of interest statement

Declaration of interests E.C. received sponsored research funding from Sanofi, Gilead, AbbVie, Genentech, Janssen Research, AstraZeneca, GSK, Bayer Pharmaceuticals, Forma Pharmaceuticals, Foghorn, Kronos, and MarcoGenics.

Figures

None
Graphical abstract
Figure 1
Figure 1
The PDX-PDO biobank recapitulates heterogeneity found in human prostate cancer (A) Composite heatmap and barplots denoting transcriptomic signatures and genes modeling key signaling and lineage characterizations. Models are organized by lineage. ARPC, adenocarcinoma; Exp Cas, selected in vivo to be castrate resistant; DN: double negative; AMP, amphicrine; NE, neuroendocrine prostate cancer. RB loss and RB loss-CRPC signatures were scored as described in STAR Methods. (B) Principal component analysis plot for transcriptomic clustering of organoid models. Abbreviations are as in (A). (C) GSVA barplots showing the organoid cohort and SU2C patient transcriptomic signature distributions among the range of observed values. See also Table S1.
Figure 2
Figure 2
PDO drug screening identifies patterns of therapeutic compound sensitivity and resistance Normalized area under curve (nAUC) heatmap showing summarized dose-response curve values for screened compounds across the organoid cohort. See also Figure S1 and Tables S2 and S3.
Figure 3
Figure 3
Transcriptomic analysis reveals molecular commonalities associated with docetaxel-responsive vs. nonresponsive mCRPC models (A) Volcano plot showing differentially expressed genes between RB1/TP53 intact docetaxel responders and nonresponders. (B) Gene set enrichment analysis showing gene sets enriched in RB1/TP53 intact organoid docetaxel responders and nonresponders. (C) Linear regression plot of nAUC for docetaxel in the complete organoid models cohort vs. Docetaxel response scores. See also Figure S2.
Figure 4
Figure 4
Docetaxel response score outperforms histological phenotype, chromosomal instability, and replication stress in modeling docetaxel response in mCRPC (A) Composite summary for 26 organoid models summarizing relative quantification of HNF1 RNA, select transcriptomic signatures, and Z-scored nAUC responses to selected drugs organized relative to docetaxel response signature scores. (B) In vivo docetaxel tumor responses. Assays were terminated when tumors reached 2,000 mm3 or at 5 weeks, whichever came first. A minimum of 5 mice were used per group. Error bars ± SEM. p values were calculated using the Student’s t test, two-tailed, unpaired. Correlations reported as R-squared between docetaxel nAUC and the remaining compounds in the figure: 0.4631 (topotecan), 0.4461 (volasertib), 0.2034 (navitoclax), 0.07768 (S63845), 0.2444 (WEHI.539), 0.267 (berzosertib), and 0.3402 (danusertib). See also Table S4.
Figure 5
Figure 5
HNF1A confers functional docetaxel resistance without preventing drug-target interaction (A) Drug response curve showing docetaxel and berzosertib responses in 2 biological replicates with induced HNF1A expression. (B) Schematic showing confocal microscopy method for measuring mitotic arrest, defined as overlap of H3S10Phos stain in DAPI-positive regions in organoids treated with vehicle or docetaxel. Stains were DAPI (blue) and H3S10Phos (red). Scale bar, 50 μm. (C) Barplot summary showing percentage of cells across increasing time points and docetaxel doses (1) detected in mitotic arrest and (2) viably surviving. ∗∗∗∗ denotes p < 0.001. See also Figure S3.
Figure 6
Figure 6
HNF1A confers docetaxel resistance via apoptotic blunting (A) Confocal microscopy showing cleaved caspase-3 (green), DAPI (blue), and microtubules (red) in response to docetaxel treatment over 24 h. DAPI-stained nuclei were used for cell detection. Scale bar, 20 μm. (B) Volcano plot of genes differentially expressed between empty vector and HNF1A+ LuCaP 23.1 biological replicates. Apoptosis-associated genes are shown in red. (C) IGV screenshot of HNF1A and H3K27Ac ChIP-seq fragments relative to BIRC3 transcription start site and first exon. BigWig tracks were group autoscaled based on antibody, red tracks are from HNF1A high models, and blue tracks are from HNF1A low models. HNF1A motifs were derived using RGT HNT algorithm. See also Figure S4 and Table S5.
Figure 7
Figure 7
Targeting cIAP2 is efficacious in HNF1A+ BIRC3-expressing mCRPC (A) Drug response curves to LC161 (cIAP2 inhibitor) alone in LuCaP 23.1 with and without exogenous HNF1A expression (left) and in LuCaPs 170.2 and 170.3. (B) In vivo responses to LCL161 in LuCaPs 170.2 (HNF1A−) and 170.3 (HNF1A+). A minimum of 5 mice were used per group. Error bars ± SEM. p values were calculated using the Student’s t test, two-tailed, unpaired. (C) Drug responses showing combination of docetaxel and LCL161 (cIAP2 inhibitor) in LuCaP 23.1 with and without exogenous HNF1A expression (left) and in LuCaPs 170.2 and 170.3. See also Figure S4.

References

    1. Siegel R.L., Miller K.D., Wagle N.S., Jemal A. Cancer statistics, 2023. CA. Cancer J. Clin. 2023;73:17–48. doi: 10.3322/caac.21763. - DOI - PubMed
    1. Litwin M.S., Tan H.-J. The Diagnosis and Treatment of Prostate Cancer: A Review. JAMA. 2017;317:2532–2542. doi: 10.1001/jama.2017.7248. - DOI - PubMed
    1. Choi S., Lee A.K. Efficacy and safety of gonadotropin-releasing hormone agonists used in the treatment of prostate cancer. Drug Healthc. Patient Saf. 2011;3:107–119. doi: 10.2147/DHPS.S24106. - DOI - PMC - PubMed
    1. Watson P.A., Arora V.K., Sawyers C.L. Emerging mechanisms of resistance to androgen receptor inhibitors in prostate cancer. Nat. Rev. Cancer. 2015;15:701–711. doi: 10.1038/nrc4016. - DOI - PMC - PubMed
    1. Mohler J.L., Antonarakis E.S., Armstrong A.J., D'Amico A.V., Davis B.J., Dorff T., Eastham J.A., Enke C.A., Farrington T.A., Higano C.S., et al. Prostate Cancer, Version 2.2019, NCCN Clinical Practice Guidelines in Oncology. J. Natl. Compr. Canc. Netw. 2019;17:479–505. doi: 10.6004/jnccn.2019.0023. - DOI - PubMed

MeSH terms