. 2024 Dec 17;5(12):101852.
doi: 10.1016/j.xcrm.2024.101852. Epub 2024 Dec 9.

Lurbinectedin sensitizes PD-L1 blockade therapy by activating STING-IFN signaling in small-cell lung cancer

Affiliations

Lurbinectedin sensitizes PD-L1 blockade therapy by activating STING-IFN signaling in small-cell lung cancer

Subhamoy Chakraborty et al. Cell Rep Med. .

Erratum in

Abstract

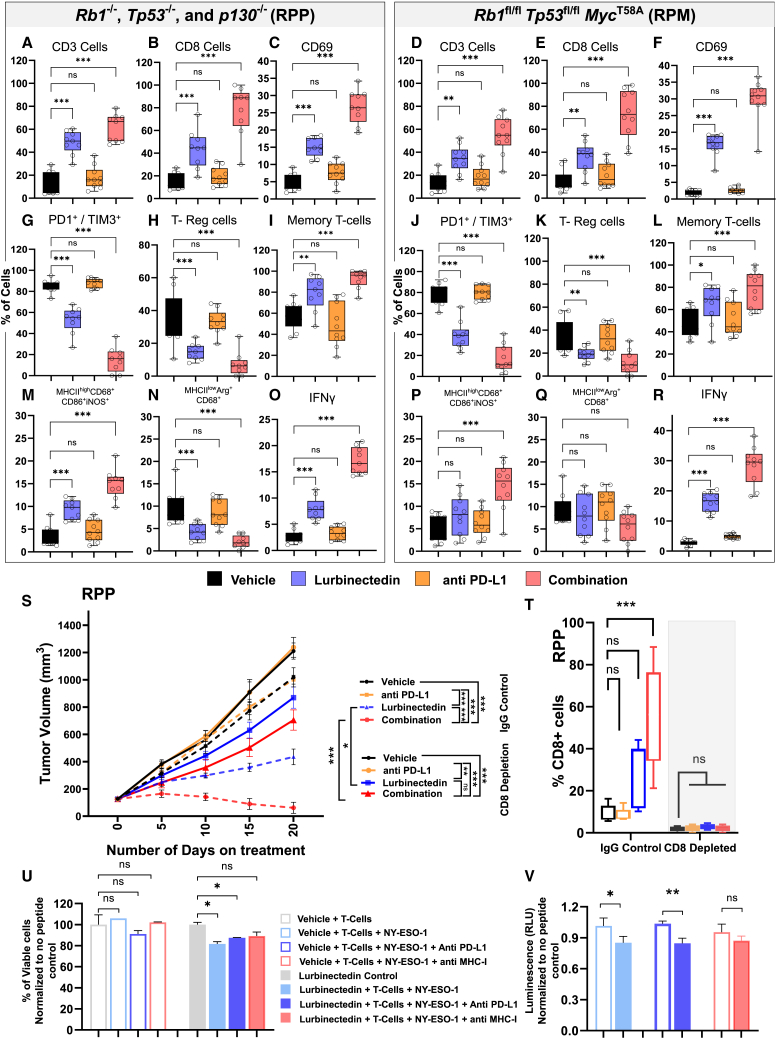
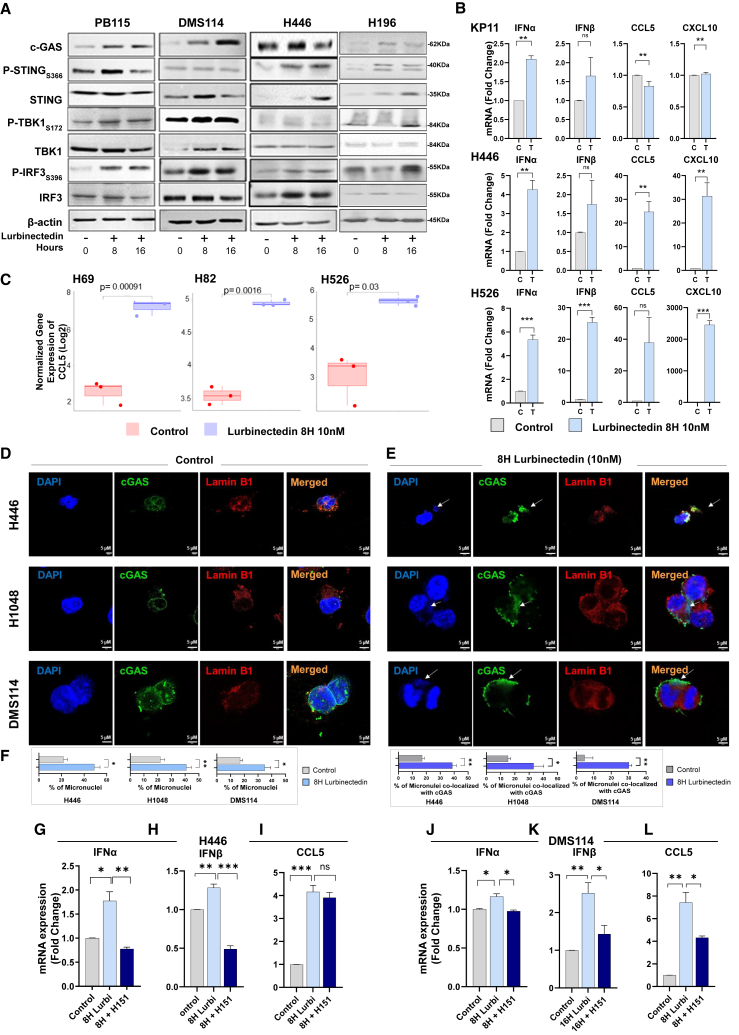
Lurbinectedin is an approved second-line treatment for small-cell lung cancer (SCLC). SCLC clinical trials combining lurbinectedin with PD-L1 blockade are currently ongoing. However, the immunomodulatory effects of lurbinectedin remain largely unknown. In this study, we demonstrate that lurbinectedin treatment activates the STING pathway, which increases interferon (IFN) signaling, pro-inflammatory chemokines, and major histocompatibility complex class I (MHC-I) in SCLC models. Lurbinectedin treatment augments the anti-tumor immune response of PD-L1 blockade with significant tumor regression in first-line and maintenance settings in SCLC mouse models. In vivo, lurbinectedin treatment increases CD8+ T cells and M1 macrophages and decreases immunosuppressive M2 macrophages. STING and CD8 depletion reverses the anti-tumor response. Interestingly, our study shows that lurbinectedin treatment upregulates MHC-I/II genes and CD8 in SCLC clinical samples. We provide mechanistic insights into the effect of lurbinectedin on STING-mediated multimodal immune activation and demonstrate that lurbinectedin treatment represents a promising therapeutic strategy to potentiate the efficacy of immunotherapy in SCLC.

Keywords: MHC-I; PD-L1 blockade; cGAS-STING; immune activation; small-cell lung cancer.


Conflict of interest statement

Declaration of interests T.S. has received research grants from Jazz Pharmaceuticals and Debiopharm. T.A.B. received a grant and honorarium from Bristol Meyers Squibb.

Figures

None
Graphical abstract
Figure 1
Figure 1
Lurbinectedin augments the anti-tumor immune response of PD-L1 blockade in immunocompetent SCLC models (A) Schematic diagram showing the tumor development and treatment regimes in GEMMs. RPP and RPM tumor-bearing mice were randomized into 4 groups: (1) vehicle, (2) anti-PD-L1 (300 μg/animal, i.p., once a week), (3) lurbinectedin (0.2 mg/kg, i.v., once/week), and (4) combination of anti-PD-L1 antibody and lurbinectedin. (B and C) Tumor growth curve data of RPP (B) and RPM (C). The data represent the means ± SD (n ≥ 9); p values were calculated using linear mixed-effects regression models. (D and E) Bodyweight data of RPP (D) and RPM (E) GEMMs. The data represent the means ± SD (vehicle, anti-PD-L1 and lurbinectedin [n = 9], and combination [n = 10]). (F and G) Histograms showing enzyme activity of liver function enzyme ALT (unit/L) (F) and SCL (micromole/L) (G) in treatment groups at day 1, 10, or 20 post treatment in RPP GEMM. The data represent the means ± SD (n ≥ 3); p values were calculated by non-parametric ANOVA (ns > 0.05, ∗p < 0.05, ∗∗p < 0.01, ∗∗∗p < 0.001). n = number of animals. p values = statistical significance.
Figure 2
Figure 2
Lurbinectedin with or without PD-L1 blockade activates the immune subsets in SCLC (A–R) Boxplots showing percentage population of CD3+CD45+ total T cells (A and D), CD3+CD45+CD8+ cytotoxic T cells (B and E), CD69+ cells (C and F), PD1+TIM3+ CD44high/CD62Low exhausted T cells (G and J), CD25+ve/FOXP3+ve regulatory T cells (H and K), effector memory CD8 T cells: CD45+CD3+CD8+CD44highCD62Llow (I and L), M1 macrophages (M and P), M2 macrophage population (N and Q), and IFN-gamma+ cells (O and R) in RPP and RPM GEMMs of SCLC. (S) Tumor growth curves ± SD from vehicle, anti-PD-L1, lurbinectedin, and lurbinectedin + anti-PD-L1 treatment groups in RPP GEMM mice in IgG control and CD8-depleted (anti-CD8, 200 μg, 2/7 days) groups. (T) Percentage of CD8+ T cells in CD8-depleted groups 20 days post treatment as compared to IgG control groups (n = 6). p values were calculated using linear mixed-effects regression models. (U) Bar graphs showing the percentage of cell viability of H69 cells from the T cell co-culture experiment. H69 cells were pre-treated with either vehicle (DMSO) or with 10 nM lurbinectedin for 24 h followed by before short-term exposure to NY-ESO1 peptides (5 μg/mL). NY-ESO1-reactive CD8+ T cells alone or in combination with either PD-L1 inhibitor atezolizumab or anti-MHC-I antibody were introduced at 1:1 ratio and co-incubated for 18–20 h and cell viability was assessed by CellTiter-Glo. (V) Bar graphs showing normalize values of luminescence from the T cell co-culture experiment comparing values between control and lurbinectedin in H69 cells + T cell + NY-ESO-1, H69 cells + T cell + NY-ESO-1 + anti-PD-L1, and H69 cells + T cell+ NY-ESO-1 + anti-MHC-I antibody-treated groups. The data represent the means ± SD (n ≥ 3); the statistical summary is shown by Student’s t test. ns, no significance; ∗, p < 0.05; ∗∗, p < 0.001; ∗∗∗, p < 0.0001. See also Figure S1. n = number of animals. p values = statistical significance.
Figure 3
Figure 3
Lurbinectedin treatment activates the cGAS-STING pathway and interferon chemokine signaling (A) Western blot analysis showing protein expression levels of cGAS, pSTING_S366, total STING, pTBK1_S172, total TBK1, pIRF3_S396, and total IRF3 upon 8 and 16 h 10 nM lurbinectedin treatment in PB115, DMS114, H446, and H196 cell lines of SCLC. (B) Real-time PCR data showing fold change in mRNA expressions of type I (IFNα, IFNβ), CCL5, and CXCL10 upon 8 h of 10 nM lurbinectedin compared to control in KP11, H446, and H526 cells. The data represent the means ± SEM of at least 3 biological replicates. (C) Boxplots showing normalized gene expression of crucial chemokine gene CCL5 of H69, H82, and H526 cells, pre-and post-lurbinectedin treatment of 10 nM for 24 h. (D and E) Confocal microscopy of control and 8 h 10 nM lurbinectedin-treated H446, H1048, and DMS114 cells. DAPI (blue) stained nuclei, cGAS (green), and LaminB1 (red). The stained cells were imaged with Leica STED 3X at 63X lens zoomed at 1X or 0.75X. The images include a scale bar of 5 μm. (F) Bar graphs showing mean ± SEM of percentage increase of micronuclei (left) and mean ± SEM of percentage increase of micronuclei co-localized with cGAS (right) outside the nucleus (quantification was made from at least 5 different fields). One-way ANOVA followed by Student’s t test was used to compare between two groups. (G–L) mRNA expressions of type I interferons and CCL5 upon either 8 or 16 h of 10 nM lurbinectedin in the presence or absence of STING inhibitor H151 compared to control in H446 (G–I) and DMS114 (J–L) cells. The data represent the means ± SEM of at least 3 biological replicates (n ≥ 3). One-way ANOVA or the Dunnett’s test was used for multiple group comparisons followed by Student’s t test to compare between two groups. ns, no significance; ∗, p < 0.05; ∗∗, p < 0.001; ∗∗∗, p < 0.0001. See also Figures S2–S7. n = number of biological replicates. p values = statistical significance.
Figure 4
Figure 4
Lurbinectedin induces the expression of MHC-I and DAMPs in SCLC (A) Boxplots showing the percentage population of MHC-I-positive cells in tumors resected from RPP and RPM models from the vehicle, lurbinectedin, anti-PD-L1, and combination treatment groups. (B–D) Real-time PCR data showing mRNA expressions of MHC-I genes HLA-A, HLA-B, and B2M upon either 8 h of 10 nM lurbinectedin in the presence or absence of STING inhibitor H151 compared to control in DMS114, H446, and H196 cells. (E and F) Flow cytometry analysis of DMS114, H446, H196, and H1048 cells showing an increase in the (E) percentage of MHC-I-positive cells in response to 10 nM lurbinectedin treatment for 24 h, and (F) percentage of MHC-I-positive cells in response to 10 nM lurbinectedin treatment for 24 h in the presence or absence of STING inhibitor H151. (G) Western blot analysis showing protein expression levels of ICD-related DAMPs HMGB1, calreticulin, and β-actin in PB115, H69, H211, and H196 cell lines of SCLC in response to 10 nM lurbinectedin treatment for 0, 8, and 16 h. (H) Bar graphs representing the secreted concentration (pg/mL) of HMGB1 in response to 10 nM lurbinectedin treatment for 0 and 8 h. (I and J) Real-time PCR data showing fold changes of mRNA expressions in ICD genes: HMGB1, ANXA1, and calreticulin upon 8 h of 10 nM lurbinectedin compared to control in H446 and H196 SCLC cells in the presence or absence of STING inhibitor H151. The data represent the means ± SEM of at least 3 biological replicates. One-way ANOVA or the Dunnett’s test was used for multiple group comparisons followed by Student’s t test to compare between two groups. ns, no significance; ∗, p < 0.05; ∗∗, p < 0.001; ∗∗∗, p < 0.0001. See also Figure S5. n = number of biological replicates. p values = statistical significance.
Figure 5
Figure 5
STING inhibition overcomes anti-tumor immune response of lurbinectedin (A–D, H–K) Tumor growth curve of immunocompetent RPP (A–D) and RPM (H–K) models treated with vehicle, anti-PD-L1 antibody, lurbinectedin, or combination treatment in the presence of scrambled shRNA (SCR) or STING-shRNA. The data represent the means ± SD (n ≥ 5). (E and L) Bar graph of mRNA expression of STING (TMEM173) in resected RPP (E) or RPM (L) tumors from above treatment groups at the endpoint of the experiment (day 20). (F–I and M–P) The percentage of MHC-I-positive cells in the RPP (F–I) or RPM (M–F) resected tumors from the vehicle, anti-PD-L1, lurbinectedin, or combination treatment with or without STING depletion. The data represent the means ± SD (n ≥ 5). Mouse numbers: vehicle (n = 5 for control, n = 6 for SCR shRNA, and n = 6 for STING KD), PD-L1 (n = 5 for control, n = 6 for SCR shRNA, and n = 6 for STING KD), only lurbinectedin (n = 6 for control, n = 6 for SCR shRNA, and n = 6 for STING KD), and combination of lurbinectedin and PD-L1 (n = 6 for control, n = 6 for SCR shRNA, and n = 6 for STING KD). One-way ANOVA or the Dunnett’s test was used for multiple group comparisons followed by Student’s t test to compare between endpoints values of two groups. ns, no significance; ∗, p < 0.05; ∗∗, p < 0.001; ∗∗∗, p < 0.0001. See also Figure S6. n = number of animals. p values = statistical significance.
Figure 6
Figure 6
Lurbinectedin alone or in combination with anti-PD-L1 antibody shows anti-tumor efficacy in the maintenance setting of SCLC (A) Schematic diagram of showing the tumor development and treatment strategy in RPP GEMM of SCLC. Tumor cells were injected into the flanks in immune-competent RPP mouse models of SCLC. Following 100–150 mm3 of tumor development, mice were treated with 3 cycles of chemo-immunotherapy of anti-PD-L1 antibody (300 μg/animal, once a week), cisplatin, and etoposide (3 mg/kg, three times a week), and at day 21, we randomized the mice to start our maintenance treatment in three groups: anti-PD-L1 (n = 9) (300 μg/animal, i.p., once a week), lurbinectedin (n = 8) (0.2 mg/kg, i.v., once/week), and anti-PD-L1 antibody and lurbinectedin (n = 9). (B) Tumor regression curve showing the efficacy of aforementioned treatment groups in SCLC as maintenance therapy. The data represent the means ± SD (n ≥ 9); p values were calculated using linear mixed-effects regression models. (C) Kaplan-Meier curve for the treatment groups mentioned earlier. Statistical significance is calculated as a p value using a log rank test. (D) Waterfall plot showing percentage change in tumor volume for each mouse from baseline (day 20) every 5 days during the aforementioned treatments. “∗” denotes mice that reached maximum tumor volume and were taken out of the study. (E–G) Histograms showing the percentage population of M1 macrophages (E), M2 macrophages (F), and CD8+ T cells (G) upon anti-PD-L1, lurbinectedin, and combination therapy. The data represent the means ± SE (n ≥ 4). One-way ANOVA or the Dunnett’s test was used for multiple group comparisons followed by Student’s t test to compare between two groups. ns, no significance; ∗, p < 0.05; ∗∗, p < 0.001; ∗∗∗, p < 0.0001. n = number of animals. p values = statistical significance.
Figure 7
Figure 7
Lurbinectedin induces immunogenicity in SCLC patient samples (A–C) Plots showing increased expression of (A) MHC-I/II genes, (B) PD-L1 (CD274) and other immune-related genes, and (C) DNA damage response genes in matched pre- vs. post lurbinectedin-treated clinical patient samples from matched samples collected from one patient. (D–I) Boxplots with individual data points from multiplex immune-fluorescence experiments showing log2 value of (D) CD3+, CD8+, and CD19+/CD138+-positive cells in primary lung tumor, (E) CD3+ and CD3+/CD8+-positive cells in SCLC liver metastasis, (F) CD3+, CD3+/CD8+, and CD3+/4-1BB+-positive cells in metastatic lymph node tumor, (G) CD3+, CD3+/CD4+, CD4+, CD19+, CD138+, and MHC-I-positive cells in primary lung stroma, (H) CD3+/CD4+, CD4+, CD3+/CD8+, and CD8+-positive cells in metastatic stroma site liver SCLC, and (I) CD3+, CD3+/CD4+, CD4+, CD8+, CD3+/CD8+, CD3+/4-1BB+, 4-1BB+, and MHC-I and MHC-II-positive cells in metastatic lymph node SCLC from pre- vs. post lurbinectedin-treated clinical patient and autopsy samples. n = number of patient samples. p values = statistical significance.

References

    1. Sen T., Takahashi N., Chakraborty S., Takebe N., Nassar A.H., Karim N.A., Puri S., Naqash A.R. Emerging advances in defining the molecular and therapeutic landscape of small-cell lung cancer. Nat. Rev. Clin. Oncol. 2024;21:610–627. doi: 10.1038/s41571-024-00914-x. - DOI - PMC - PubMed
    1. Rudin C.M., Brambilla E., Faivre-Finn C., Sage J. Small-cell lung cancer. Nat. Rev. Dis. Prim. 2021;7:3. doi: 10.1038/s41572-020-00235-0. - DOI - PMC - PubMed
    1. Horn L., Mansfield A.S., Szczęsna A., Havel L., Krzakowski M., Hochmair M.J., Huemer F., Losonczy G., Johnson M.L., Nishio M., et al. First-Line Atezolizumab plus Chemotherapy in Extensive-Stage Small-Cell Lung Cancer. N. Engl. J. Med. 2018;379:2220–2229. doi: 10.1056/NEJMoa1809064. - DOI - PubMed
    1. Paz-Ares L., Dvorkin M., Chen Y., Reinmuth N., Hotta K., Trukhin D., Statsenko G., Hochmair M.J., Özgüroğlu M., Ji J.H., et al. Durvalumab plus platinum-etoposide versus platinum-etoposide in first-line treatment of extensive-stage small-cell lung cancer (CASPIAN): a randomised, controlled, open-label, phase 3 trial. Lancet. 2019;394:1929–1939. doi: 10.1016/S0140-6736(19)32222-6. - DOI - PubMed
    1. Mahadevan N.R., Knelson E.H., Wolff J.O., Vajdi A., Saigí M., Campisi M., Hong D., Thai T.C., Piel B., Han S., et al. Intrinsic Immunogenicity of Small Cell Lung Carcinoma Revealed by Its Cellular Plasticity. Cancer Discov. 2021;11:1952–1969. doi: 10.1158/2159-8290.CD-20-0913. - DOI - PMC - PubMed

MeSH terms