. 2024 Dec 17;5(12):101869.
doi: 10.1016/j.xcrm.2024.101869. Epub 2024 Dec 9.

Miltefosine reinvigorates exhausted T cells by targeting their bioenergetic state

Affiliations

Miltefosine reinvigorates exhausted T cells by targeting their bioenergetic state

Xingying Zhang et al. Cell Rep Med. .

Abstract

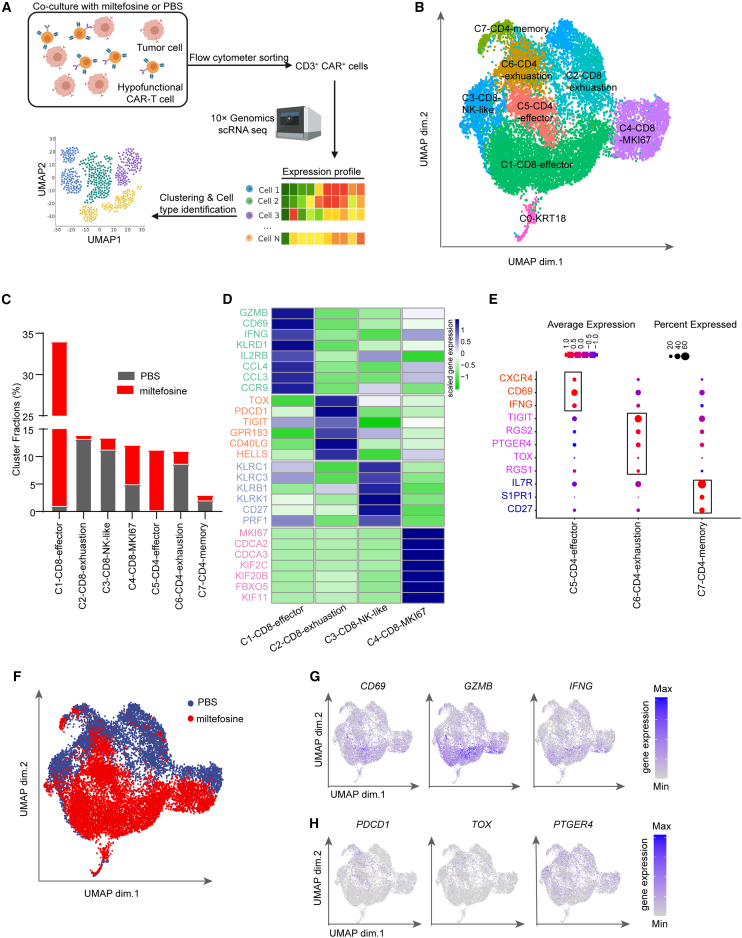
T cell exhaustion presents a major challenge for the efficacy of both immune checkpoint inhibitors (ICBs) and chimeric antigen receptor T (CAR-T) cell immunotherapies. To address this issue, we generate hypofunctional CAR-T cells that imitate the exhaustion state. By screening a Food and Drug Administration (FDA)-approved small molecule library using this model, we identify miltefosine as a potent molecule that restores the impaired function of CAR-T cells in a PD-1/PD-L1-independent manner. Impressively, in the terminally exhausted state where PD-1 antibody treatment is ineffective, miltefosine still enhances CAR-T cell activity. Single-cell sequencing analysis reveals that miltefosine treatment significantly increases the population of effector cells. Mechanistically, miltefosine improves impaired glycolysis and oxidative phosphorylation in hypofunctional CAR-T cells. In both allogeneic and syngeneic tumor models, miltefosine effectively enhances the solid tumor clearance ability of CAR-T cells and T cells, demonstrating its potential as an effective immunotherapeutic drug.

Keywords: T cell exhaustion; glycolytic metabolism; high-throughput drug screening; immunotherapy for solid tumors; miltefosine.


Conflict of interest statement

Declaration of interests The authors declare no competing interests.

Figures

None
Graphical abstract
Figure 1
Figure 1
Generating hypofunction CAR-T cells by multiple rounds of tumor challenge and reinvigorating them with anti-PD-1/PD-L1 blockade (A) The specific lysis of NCI-H226-luciferase after coculture with M28Z generated from 4 donors upon multiple rounds of tumor challenge (n = 4). (B) The PCA of round 0, activated, round 1, round 2, and round 3 M28Z CAR-T cells. (C) Log10 FPKM of activation- and proliferation-related genes in different samples. FPKM, fragments per kilobase of exon model per million mapped fragments. (D) GSEA analysis was performed on genes upregulated in CD8+ T cell exhaustion-specific genes in humans (including liver cancer, colorectal cancer, and non-small-cell lung cancer and genes upregulated in T cell exhaustion-specific genes in chronic LCMV infection in mice., The normalized enrichment score (NES) was used. The genes, rank-ordered from left to right, were enriched in the M28Z (round 2) and M28Z (activated) groups, respectively. (E) The expression of early exhausted makers and late exhausted makers in different groups. The dashed line represents expression of round 0 CAR-T cells. (F) GSEA of genes upregulated in progenitor and terminally exhaustion-related genes. Genes from the left to right of the rank order were enriched in the M28Z (round 2) and M28Z (round 3) groups. (G) The specific lysis of NCI-H226-luciferase cells after coculture with round 1, round 2, and round 3 M28Z CAR-T cells (donor 1) with anti-PD-1 or anti-PD-L1 antibody treatment for 4 days at a 1:1 E:T ratio (n = 4). (H) The specific lysis of NCI-H226-luciferase after coculture with hypofunctional M28Z (donors 2–5) for 4 days at 1:1 E:T ratio with anti-PD-1 or anti-PD-L1 antibody treatment (n = 4, results of other E:T ratios shown in Figure S1H). Unpaired t test was used in statistical analysis. NS, not significant, ∗p < 0.05, ∗∗∗p < 0.001, ∗∗∗∗p < 0.0001. All error bars denote SEM. See also Figure S1.
Figure 2
Figure 2
FDA-approved compound library screening identified miltefosine as a potent enhancer of hypofunctional CAR-T cell function (A) Workflow of high-throughput drug screening using hypofunctional CAR-T cell model. (B) The results of primary screening. (C) The results of secondary screening. (D) The chemical structure of miltefosine. (E) Dose-response analysis of miltefosine’s effect on the specific lysis of NCI-H226-luciferase after coculture with hypofunctional CAR-T cells (n = 4). (F) The schematic diagram of experimental design of (G–I). (G) Cell viability of NCI-H226-luciferase cells after miltefosine treatment (n = 4). (H) M28Z-mediated specific lysis of NCI-H226-luciferase cells with miltefosine or PBS pretreatment for 4 days (n = 4). (I) Hypofunctional M28Z were pretreated with miltefosine or PBS for 4 days and then cocultured with NCI-H226-luciferase cells at different E:T ratios (n = 4). (J) The specific lysis of NCI-H226-luciferase cells after coculture with hypofunctional M28Z with miltefosine or anti-PD-1 antibody treatment for 4 days at 1:1 E:T ratio (n = 4, results of other E:T ratios shown in Figure S2A). (K) The specific lysis of NCI-H226-luciferase cells cocultured with hypofunctional MBBZ (after stimulated by NCI-H226-luciferase cells 2 rounds at 1:1 ratio), H28Z (after stimulated by NCI-H226-luciferase cells 4 rounds at 1:1 ratio), and HBBZ (after stimulated by NCI-H226-luciferase cells 4 rounds at 1:1 ratio) CAR-T cells for 4 days with miltefosine or anti-PD-1 antibody treatment (n = 4). Unpaired t test was used in statistical analysis. NS, not significant, ∗p < 0.05, ∗∗p < 0.01, ∗∗∗∗p < 0.0001. All error bars denote SEM. See also Figure S2.
Figure 3
Figure 3
Miltefosine enhances CAR-T cell function in a PD-1/PD-L1 pathway-independent manner (A) The specific lysis of NCI-H226-luciferase cocultured with hypofunctional M28Z-PKO for 4 days with miltefosine or anti-PD-1 antibody treatment. M28Z-PKO, M28Z CAR-T cells with PDCD1 knockout (n = 4). (B)The specific lysis of 3T3-MSLN-luciferase, 3T3-MSLN-PD-L1-luciferase, and 3T3-MSLN-PD-L1hi-luciferase cocultured with hypofunctional M28Z for 4 days with miltefosine or anti-PD-1 antibody treatment (n = 4). (C) The specific lysis of NCI-H226 cocultured with hypofunctional M28Z for 4 days with miltefosine or anti-PD-1 antibody treatment in three donors (n = 4). (D) The specific lysis of NCI-H226-luciferase cells cocultured with terminally exhausted-like M28Z CAR-T cells for 4 days with miltefosine or anti-PD-1 antibody treatment at a 1:1 ratio in three donors (n = 4). (E) The fold change (FC) of tumor killing with miltefosine treatment relative to anti-PD-1 antibody treatment (n = 4, related to Figure S2A). Unpaired t test was used in statistical analysis. NS, not significant, ∗∗p < 0.01, ∗∗∗p < 0.001, ∗∗∗∗p < 0.0001. All error bars denote SEM. See also Figure S3.
Figure 4
Figure 4
scRNA-seq identifies a distinct subpopulation shift of hypofunctional CAR-T cells upon miltefosine treatment (A) Schematic diagram of single-cell sequencing sample preparation and analysis. (B) UMAP projection of scRNA-seq data for each cluster. (C) Percentage of each cluster in total cells. (D) Heatmap of marker genes for CD8+ clusters defined in UMAP projection. (E) Heatmap of marker genes for CD4+ clusters defined in UMAP projection. (F) UMAP projection of scRNA-seq data from miltefosine and PBS samples. (G) Expression of activation-related genes shown in UMAP space. (H) Expression of exhaustion-related genes shown in UMAP space. See also Figure S4.
Figure 5
Figure 5
Miltefosine reverses the impaired glycolytic metabolism and glucose uptake of hypofunctional CAR-T cells (A) GO analysis of upregulated genes in miltefosine-treated hypofunctional CAR-T cells compared to PBS-treated samples. (B) The function of upregulated glycolysis-related genes in the glucose metabolism pathway. (C) Log10 FPKM values of glycolysis-related genes in hypofunctional CAR-T cells treated with miltefosine or PBS. (D) Changes in the extracellular acidification rate (ECAR) of donor 1-derived hypofunctional CAR-T cells after miltefosine treatment (n = 3). (E) Miltefosine improved the glycolytic ability of hypofunctional CAR-T cells derived from three different donors (n = 3). (F) 2-NBDG uptake in hypofunctional CAR-T cells treated with PBS or miltefosine. Each line represents a donor (n = 3). (G) Glucose uptake in hypofunctional CAR-T cells treated with PBS or miltefosine, measured using the Glucose Uptake-Glo assay (n = 3). (H) Changes in the oxygen consumption rate (OCR) of donor 1-derived hypofunctional CAR-T cells after miltefosine treatment (n = 3). (I) Miltefosine improved the OCR of hypofunctional CAR-T cells derived from three different donors (n = 3). Unpaired t test was used in statistical analysis. ∗p < 0.05, ∗∗p < 0.01, ∗∗∗p < 0.001, ∗∗∗∗p < 0.0001. All error bars denote SEM. See also Figure S5.
Figure 6
Figure 6
Miltefosine utilizes GLUT1 to augment glucose uptake in hypofunctional CAR-T cells (A) FPKM of SLC2A1 in the PBS and miltefosine groups. (B) GLUT1 expression in hypofunctional CAR-T cells treated with PBS or miltefosine. Each dot represents a donor (n = 3). (C) 2-NBDG uptake in hypofunctional CAR-T cells treated with PBS or miltefosine combined with BAY-876, derived from five donors. Each dot represents a donor (n = 5). (D) Hypofunctional M28Z cells were pretreated with miltefosine or PBS combined with BAY-876 for 4 days and then cocultured with NCI-H226-luciferase cells at different E:T ratios (n = 4). (E) Specific lysis of NCI-H226-luciferase cells after coculture with hypofunctional M28Z-GKO cells treated with miltefosine or an anti-PD-1 antibody for 4 days at a 1:1 E:T ratio (n = 4). (F) Hypofunctional M28Z-GKO cells were pretreated with miltefosine or PBS for 4 days and then cocultured with NCI-H226-luciferase cells at different E:T ratios (n = 4). Unpaired t test was used in statistical analysis. NS, not significant, ∗p < 0.05, ∗∗∗p < 0.001, ∗∗∗∗p < 0.0001. All error bars denote SEM. See also Figure S6.
Figure 7
Figure 7
Miltefosine enhances CAR-T cell efficacy against solid tumors in vivo (A) Experimental timeline of CDX model and the fold change of tumor volume in CAR-T cell-treated CDX mouse model in the presence or absence of miltefosine administration (PBS group, n = 3; other groups, n = 5). (B) Tumor weight of each group at the end of experiment (PBS group, n = 3; other groups, n = 5). (C) The percentages of mesothelin- and hCD3-positive area in tumor tissues (PBS group, n = 2; other groups, n = 5). Scale bar: 200 μm. (D) The fold change of tumor volume in CDX mouse model treated with CAR-T cells derived from another donor, in the presence or absence of miltefosine or anti-PD-1 antibody treatment (n = 4). (E) The proportion of hCD3+ T cells in the peripheral blood of CDX mouse model (n = 4). (F) The fold change of tumor volume in CAR-T cell-treated PDX mouse model, in the presence or absence of miltefosine or anti-PD-1 antibody treatment (n = 4). (G) The proportion of hCD3+ T cells in the peripheral blood of PDX mouse model (n = 4). Unpaired t test was used in statistical analysis. (H) Experimental timeline of the OT-1-treated melanoma isograft tumor model. (I) The fold change in tumor volume in the OT-1-treated melanoma isograft tumor model in the presence or absence of miltefosine administration (n = 7). Unpaired t test was used in statistical analysis. NS, not significant, ∗p < 0.05, ∗∗p < 0.01, ∗∗∗p < 0.001, ∗∗∗∗p < 0.0001. All error bars denote SEM. See also Figure S7.

References

    1. Wherry E.J., Kurachi M. Molecular and cellular insights into T cell exhaustion. Nat. Rev. Immunol. 2015;15:486–499. doi: 10.1038/nri3862. - DOI - PMC - PubMed
    1. Collier J.L., Weiss S.A., Pauken K.E., Sen D.R., Sharpe A.H. Not-so-opposite ends of the spectrum: CD8(+) T cell dysfunction across chronic infection, cancer and autoimmunity. Nat. Immunol. 2021;22:809–819. doi: 10.1038/s41590-021-00949-7. - DOI - PMC - PubMed
    1. Wherry E.J. T cell exhaustion. Nat. Immunol. 2011;12:492–499. - PubMed
    1. Wang Q., Qin Y., Li B. CD8(+) T cell exhaustion and cancer immunotherapy. Cancer Lett. 2023;559 doi: 10.1016/j.canlet.2022.216043. - DOI - PubMed
    1. Zajac A.J., Blattman J.N., Murali-Krishna K., Sourdive D.J., Suresh M., Altman J.D., Ahmed R. Viral immune evasion due to persistence of activated T cells without effector function. J. Exp. Med. 1998;188:2205–2213. doi: 10.1084/jem.188.12.2205. - DOI - PMC - PubMed

MeSH terms