. 2024 Dec 17;5(12):101851.
doi: 10.1016/j.xcrm.2024.101851. Epub 2024 Dec 9.

Multi-modal analysis reveals tumor and immune features distinguishing EBV-positive and EBV-negative post-transplant lymphoproliferative disorders

Affiliations

Multi-modal analysis reveals tumor and immune features distinguishing EBV-positive and EBV-negative post-transplant lymphoproliferative disorders

Jiaying Toh et al. Cell Rep Med. .

Abstract

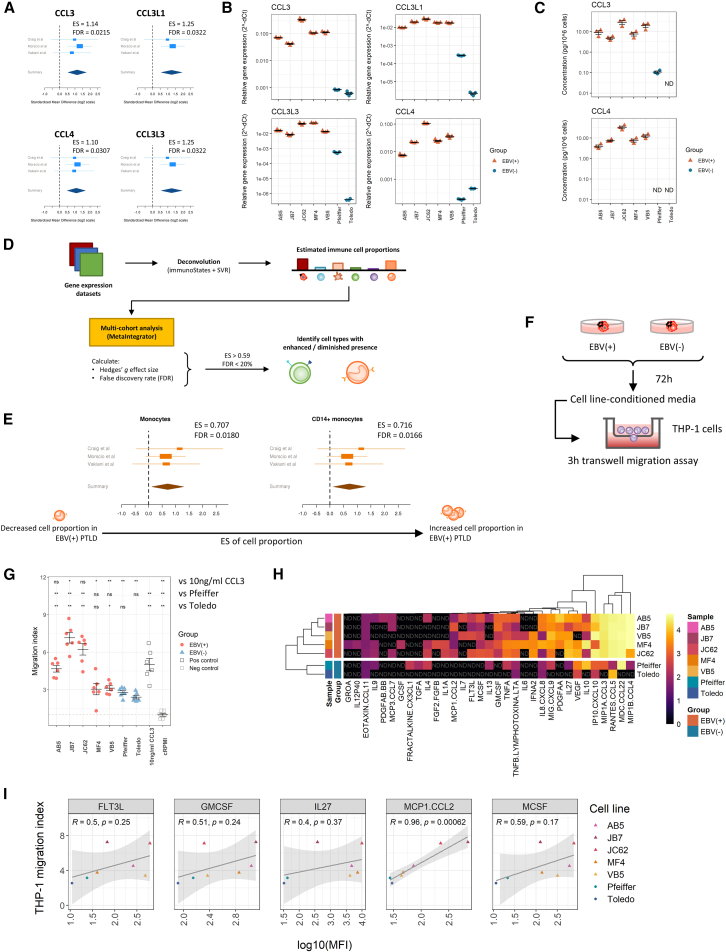
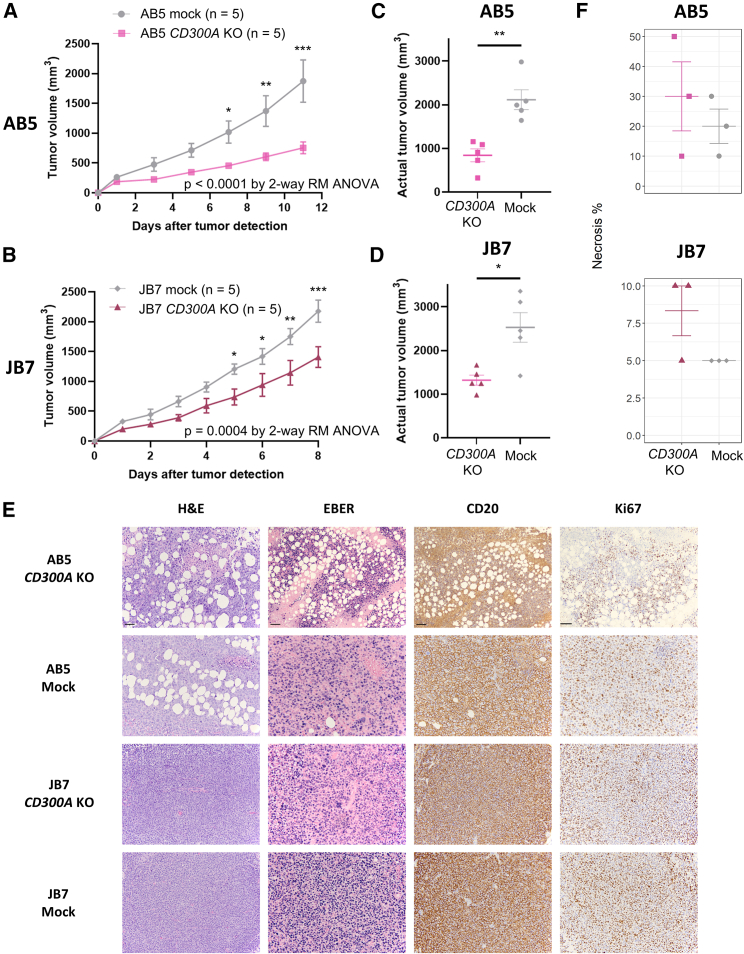
The oncogenic Epstein-Barr virus (EBV) can drive tumorigenesis with disrupted host immunity, causing malignancies including post-transplant lymphoproliferative disorders (PTLDs). PTLD can also arise in the absence of EBV, but the biological differences underlying EBV(+) and EBV(-) B cell PTLD and the associated host-EBV-tumor interactions remain poorly understood. Here, we reveal the core differences between EBV(+) and EBV(-) PTLD, characterized by increased expression of genes related to immune processes or DNA interactions, respectively, and the augmented ability of EBV(+) PTLD B cells to modulate the tumor microenvironment through elaboration of monocyte-attracting cytokines/chemokines. We create a reference resource of proteins distinguishing EBV(+) B lymphoma cells from EBV(-) B lymphoma including the immunomodulatory molecules CD300a and CD24, respectively. Moreover, we show that CD300a is essential for maximal survival of EBV(+) PTLD B lymphoma cells. Our comprehensive multi-modal analyses uncover the biological underpinnings of PTLD and offer opportunities for precision therapies.

Keywords: B cell lymphoma; CD300a; Epstein-Barr virus; multi-cohort analysis; multi-omics; post-transplant lymphoproliferative disorder; tumor microenvironment; tumor-immune interactions.


Conflict of interest statement

Declaration of interests The authors declare no competing interests.

Figures

None
Graphical abstract
Figure 1
Figure 1
Integrated multi-cohort analysis identifies a 189-gene signature distinguishing EBV(+) PTLD from EBV(−) PTLD (A) Overview of multi-cohort gene expression analysis comparing samples from EBV(+) and EBV(−) PTLD lesions. (B) Heatmap of log2-transformed effect size values for each gene in the EBV-associated PTLD signature. Gray cells denote genes not measured in the dataset. Red: overexpressed in EBV(+) PTLD; blue: overexpressed in EBV(−) PTLD. (C) Volcano plot of gene expression data from PTLD tumor microarray datasets. Red: overexpressed in EBV(+) PTLD; blue: overexpressed in EBV(−) PTLD. (D) Pathway overrepresentation analysis of genes in the EBV-associated PTLD signature. The top 15 Gene Ontology terms as ranked by adjusted p values are shown. See also Tables S1 and S2.
Figure 2
Figure 2
Independent validation of gene signature on EBV(+) PTLD patient-derived and EBV(−) B cell lines (A) tSNE plot and unsupervised affinity propagation clustering of EBV(+) and EBV(−) B cell lines by their transcriptomic profiles. (B) Volcano plot of gene expression data from EBV(+) and EBV(−) B cell lines. Red: overexpressed in EBV(+) cell lines; blue: overexpressed in EBV(−) cell lines. (C) Heatmap of log2-transformed fold change values for each of 1,407 DEGs between EBV(+) and EBV(−) B cell lines. Red: higher gene expression; blue: lower gene expression. (D) Pathway overrepresentation analysis on DEGs in EBV(+) B cell lines. The top 15 Gene Ontology terms as ranked by adjusted p values are shown. (E) Correlation of effect size from EBV-associated PTLD signature with fold change observed between EBV(+) and EBV(−) B cell lines. (F) Strategy overview to select genes for further in vitro and in vivo investigation using EBV(+) B cell lines. See also Table S2.
Figure 3
Figure 3
EBV(+) B cell lines have increased expression and secretion of chemokines compared to EBV(−) B cell lines, which correlate with enhanced monocyte migration (A) Forest plots of CCL3, CCL3L1, CCL3L3, and CCL4 expression from PTLD tumor microarray datasets. The x axes represent the log2-transformed effect size between groups. Rectangle size is proportional to the standard error of mean (SEM) difference in the study. Whiskers represent the 95% confidence interval. Diamonds represent the overall, combined effect size for the specific gene between groups. Width of the diamonds represents the 95% confidence interval of the summary effect size. (B) Relative gene expression of CCL3, CCL3L1, CCL3L3, and CCL4 in EBV(+) and EBV(−) B cell lines, quantified by quantitative reverse-transcription PCR (RT-qPCR). Red: EBV(+) cell lines; blue: EBV(−) cell lines. Data in quadruplicate are represented as mean ± SEM. (C) Secretion of CCL3 and CCL4 by EBV(+) and EBV(−) B cell lines, quantified by ELISA. Red: EBV(+) cell lines; blue: EBV(−) cell lines. Data in triplicate are represented as mean ± SEM. (D) Overview of in silico deconvolution and multi-cohort analysis of PTLD tumor microarray datasets. (E) Forest plots of estimated monocyte proportions from PTLD tumor microarray datasets. (F) Experimental schematic for transwell migration assay performed with cell culture supernatants from EBV(+) and EBV(−) B cell lines. (G) THP-1 migration indices for cell culture supernatants from EBV(+) and EBV(−) cell lines. ∗, adjusted p < 0.05; ∗∗, adjusted p < 0.01 by Wilcoxon rank-sum test. Pooled data from 3 independent experiments of n = 2 replicates each are represented as mean ± SEM. (H) Heatmap of log10-transformed mean fluorescence intensity (MFI) values from Luminex assay of cell culture supernatants. ND: cytokine MFI values below the lowest point on the standard curve (not detected). (I) Correlation of cytokine MFI values with THP-1 migration index computed as Pearson’s R. See also Figure S1, Table S7.
Figure 4
Figure 4
CD163+ monocytes are increased in the tumor microenvironment of primary EBV(+) PTLD lesions (A) Expression of CD14, CD163, and MPO in non-B/non-T cells within primary EBV(+) or EBV(−) PTLD lesions. MFIs for each marker within the membrane compartment are quantified at the single-cell level and aggregated by computing the median marker MFI from all cells within each sample. Orange: EBV(+) (n = 18); blue: EBV(−) (n = 7); points represent individual cases. Data are represented as mean ± SEM. q = adjusted p values by Wilcoxon rank-sum test. (B) Percentage of CD163+ cells within primary EBV(+) or EBV(−) PTLD lesions, quantified by CODEX. Orange: EBV(+) (n = 11); blue: EBV(−) PTLD (n = 5); points represent individual cases. Data are represented as mean ± SEM. (C) CODEX images of FFPE tissue from diagnostic biopsies of EBV(+) and EBV(−) monomorphic PTLD (DLBCL subtype). Yellow: EBNA2; red: CD3/CD4; blue: CD68/CD163. A representative case in each group is shown in parallel for comparison. Scale bar, 50 μm. (D) Histology of FFPE tissue from diagnostic biopsies of EBV(+) and EBV(−) monomorphic PTLD (DLBCL subtype). EBER in situ hybridization and IHC staining for CD163, CD3, and CD4 from a representative case per group are shown in parallel for comparison. Scale bar, 50 μm. See also Tables S3 and S8.
Figure 5
Figure 5
EBV(+) B cell lines have a distinct surface phenotype from EBV(−) B cell lines and healthy B cells (A) PCA of EBV(+) and EBV(−) B cell lines and stimulated and unstimulated B cells from a healthy donor (control B cells), using 27 markers measured by CyTOF. Points represent individual samples, color-coded by group. Eigenvectors of individual markers are indicated by arrows. (B) UMAP plots using 3,000 cells per cell line, using all 27 chosen markers. Cells are color-coded by sample and aggregated by EBV status (top) or colored by relative signal intensity of indicated surface markers (bottom). (C) Clustering of EBV(+) and EBV(−) B cell lines. Based on the UMAP in (B), 4 distinct clusters were identified (left) and the proportion of each cluster by EBV status was calculated (right). (D) Histograms for the expression of indicated phenotypic markers, represented as arcsinh-transformed signal intensity values. Each histogram represents marker expression in individual samples for EBV(+) and EBV(−) B cell lines, as well as stimulated and unstimulated control B cells. (E) Comparison of CD300a median signal intensity for indicated phenotypic markers between EBV(+) cell lines (n = 5), EBV(−) cell lines (n = 2), and control B cells (n = 2). q = adjusted p values by Kruskal-Wallis test. Data are shown as mean ± SEM. (F) Heatmap of globally scaled B cell phenotypic marker expression in B cell lines and control B cell subsets. Median arcsinh-transformed signal intensity values of each marker were scaled between 0 and 1 across all samples. Unsupervised clustering was carried out on both individual cell lines/B cell subsets (rows) and phenotypic markers (columns). (G) Heatmap of scaled B cell phenotypic marker expression in B cell lines and control B cell subsets, with cell lines and control B cells scaled separately. Median arcsinh-transformed signal intensity values of each marker were scaled between 0 and 1 on all B cell lines, and separately on all control B cell subsets, to map B cell lines to the closest control B cell subset. Unsupervised clustering was performed on both individual cell lines/B cell subsets (rows) and markers (columns). See also Figure S2, Table S4.
Figure 6
Figure 6
CD300a is more highly expressed on, and is required for, optimal growth of EBV(+) PTLD B lymphoma cells (A and B) Surface expression of CD300a in peripheral blood B cells from healthy donors and autologous LCL transformed in vitro by EBV (n = 3). Biaxial plots (A, left), histograms (A, right), and comparison of CD300a median signal intensity (B) are shown. (C) Schematic for CRISPR-Cas9-mediated gene editing for CD300A in EBV(+) PTLD B cell lines. (D) In vitro growth of CD300A KO cells relative to mock-edited controls of EBV(+) PTLD B cell lines. Cell quantities in mock-edited controls after 48 h of culture are used as the reference for normalization. ∗, p < 0.05 by Wilcoxon rank-sum test. Data shown in quadruplicate with mean ± SEM. (E) Apoptosis assay of CD300A KO or mock-edited EBV(+) PTLD B cell lines. Apoptosis stages were determined by DAPI and annexin V staining. ∗, p < 0.05; ∗∗, p < 0.01; ∗∗∗, p < 0.001; ∗∗∗∗, p < 0.0001 by unpaired t test. Data shown in triplicate with mean ± SEM. (F) Pathway overrepresentation analysis of genes downregulated in CD300A KO compared to mock control EBV(+) B cell lines using clusterProfiler. See also Figures S3–S5, Tables S4 and S5.
Figure 7
Figure 7
Loss of CD300a leads to reduced growth of EBV(+) B cell lymphomas in a xenograft mouse model of PTLD (A and B) Average tumor volume (mm3) calculated from mice injected with CD300A KO or mock-edited AB5 (A) or JB7 (B) cells (n = 5 mice per group). Data are shown as mean tumor volume ± SD for each group. Differences in tumor volume across all time points compared using a 2-way repeated measures ANOVA. (AB5: F(6, 48) = 7.987; JB7: F(7, 56) = 4.559). ∗, p < 0.05; ∗∗, p < 0.01; ∗∗∗, p < 0.001 with Benjamini-Hochberg FDR correction. (C and D) Tumor volume (mm3) at the time of sacrifice from mice injected with CD300A KO or mock-edited AB5 (C) or JB7 (D) cells. Individual tumor volumes (n = 5) are shown with mean ± SD. ∗, p < 0.05; ∗∗, p < 0.01 by Wilcoxon rank-sum test. (E) Histology of tumors harvested at sacrifice from mice injected with CD300A KO or mock-edited AB5 or JB7 cells. H&E staining, EBER in situ hybridization, and IHC staining for CD20 and Ki67 of tumors from a representative mouse per group are shown in parallel for comparison. Scale bar, 50 μm. (F) Necrosis scores of tumors harvested at sacrifice from mice injected with CD300A KO or mock-edited AB5 (top) or JB7 (bottom) cells. Scores from representative tumors (n = 3) are shown with mean ± SEM. See also Figure S6, Table S6.

References

    1. Epstein M.A., Achong B.G. The EB Virus. Annu. Rev. Microbiol. 1973;27:413–436. doi: 10.1146/annurev.mi.27.100173.002213. - DOI - PubMed
    1. Young L.S., Yap L.F., Murray P.G. Epstein–Barr virus: more than 50 years old and still providing surprises. Nat. Rev. Cancer. 2016;16:789–802. doi: 10.1038/nrc.2016.92. - DOI - PubMed
    1. Babcock G.J., Decker L.L., Volk M., Thorley-Lawson D.A. EBV Persistence in Memory B Cells In Vivo. Immunity. 1998;9:395–404. doi: 10.1016/s1074-7613(00)80622-6. - DOI - PubMed
    1. Hatton O., Strauss-Albee D.M., Zhao N.Q., Haggadone M.D., Pelpola J.S., Krams S.M., Martinez O.M., Blish C.A. NKG2A-Expressing Natural Killer Cells Dominate the Response to Autologous Lymphoblastoid Cells Infected with Epstein–Barr Virus. Front. Immunol. 2016;7:607. doi: 10.3389/fimmu.2016.00607. - DOI - PMC - PubMed
    1. Lünemann A., Vanoaica L.D., Azzi T., Nadal D., Münz C. A Distinct Subpopulation of Human NK Cells Restricts B Cell Transformation by EBV. J. Immunol. 2013;191:4989–4995. doi: 10.4049/jimmunol.1301046. - DOI - PMC - PubMed

MeSH terms

LinkOut - more resources