. 2025 Jan 11;53(2):gkae1176.
doi: 10.1093/nar/gkae1176.

Downregulation of MLF1 safeguards cardiomyocytes against senescence-associated chromatin opening

Affiliations

Downregulation of MLF1 safeguards cardiomyocytes against senescence-associated chromatin opening

Jian Lv et al. Nucleic Acids Res. .

Abstract

Aging-associated cardiac hypertrophy (AACH) increases susceptibility to heart failure in the elderly. Chromatin remodeling contributes to the gene reprogramming in AACH; however, the intrinsic regulations remain elusive. We performed a transcriptome analysis for AACH in comparison with pressure-overload-induced pathological cardiac hypertrophy in mice and identified myeloid leukemia factor 1 (MLF1) as an aging-sensitive factor whose expression was reduced during aging but could be reversed by anti-aging administrations. In human AC16 cardiomyocytes, silencing MLF1 suppressed H2O2-induced cell senescence while the phenotype was exacerbated by MLF1 overexpression. RNA-seq analysis revealed that MLF1 functioned as a transcription activator, regulating genomic-clustered genes that mainly involved in inflammation and development. ATAC-seq analysis showed a prominent reduction in chromatin accessibility at the promoter regions of senescence effectors, like IL1B and p21, after MLF1 knockdown. Despite a potential interaction of MLF1 with the histone methyltransferase PRC2, its inhibition failed to reverse the impact of MLF1 knockdown. Instead, MLF1-mediated regulation was blunted by inhibiting the acetyltransferase EP300. CUT&Tag analysis showed that MLF1 bound to target promoters and recruited EP300 to promote H3K27ac deposition. Collectively, we identify MLF1 as a pro-aging epigenetic orchestrator that recruits EP300 to facilitate opening of the condensed chromatin encompassing senescence effectors.


Figures

Graphical Abstract
Graphical Abstract
Figure 1.
Figure 1.
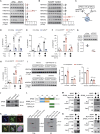
Transcriptome networks in AACH. (A) Heart morphology (upper) and heart or lung weight/body weight ratios (lower) in AACH versus pathological cardiac hypertrophy induced by TAC surgery. Scale bar, 5 mm. n = 6. (B) Representative images (left) of WGA staining and quantification (right) of the cross-section cardiomyocyte areas. Scale bar, 40 μm. n = 20. (C) Representative images (left) and quantification (right) of Masson staining showing myocardial fibrosis. Scale bar, 40 μm. (D) Impacts of aging and TAC on EF (left) and fractional shortening (FS; right) measured by echocardiography; n = 6. (E) Impacts of aging and TAC on end-diastolic left ventricular posterior wall thickness (LVPW;d; left) and end-systolic left ventricular internal dimension (LVID;s; right); n = 6. (F) Expressions of hypertrophy markers, including Nppa, Nppb, Myh6 and Myh7, in AACH versus cardiac hypertrophy measured by qRT-PCR. Line indicates the baseline expression in young and sham controls, respectively; n = 6. (G) Expressions of aging markers including P16, P21, Il1b and Il6 in AACH versus measured by cardiac hypertrophy qRT-PCR. Line indicates the baseline expression in young and sham controls, respectively; n = 6. (H) Venn diagram of upregulated or downregulated DEGs in both AACH and cardiac hypertrophy. (I) Scatter plot of transcriptomic distribution in AACH versus cardiac hypertrophy. (J) Combined enrichment analysis of the upregulated or downregulated genes in AACH versus cardiac hypertrophy. n.s., not significant. *P< 0.05, **P< 0.01, ***P< 0.001.
Figure 2.
Figure 2.
Identification of MLF1 as an AACH biomarker. (A) Profiles of selected mouse AACH databases. The current study is GSE200741. (B) Venn diagram of DEGs. (C) Heatmaps showing the expression of 21 shared genes in abovementioned databases (left) and their validation by qRT-PCR (right); n = 6. (D) Heatmap showing four aging-associated genes, Bcl2l11, Mlf1, Cdh22 and Myh7, with reversible expressions in anti-aging treatments, such as calorie restriction and resveratrol in GSE11291. (E) Immunoblot (left) and quantification (right) of MLF1 protein in young (2-month) and old (22-month) mouse hearts, or in AC16 cardiomyocytes with and without H2O2 treatment (200 μM); n = 3. n.s., not significant. *P< 0.05, **P< 0.01, ***P< 0.001.
Figure 3.
Figure 3.
MLF1 sensitizes cardiomyocytes to senescence. (A) Validation of MLF1 knockdown in AC16 cells treated with MLF1-specific or negative control siRNAs using Western blot; n = 3. (B) Representative SA-β-Gal staining images (left) and quantification (right) showing the impact of MLF1 knockdown on H2O2-induced cell senescence. Scale bar, 200 μm; n = 3. (C) Impact of MLF1 knockdown on the mRNA levels of P21 and IL1B in H2O2-treated AC16 cells; n = 3. (D) Validation of MLF1 overexpression in AC16 cells infected with Adenoviruses expressing MLF1 (Ad-MLF1) or EGFP (Ad-EGFP); n = 3. (E) Representative SA-β-Gal staining images (left) and quantification (right) showing the impact of MLF1 overexpression on H2O2-induced cell senescence. Scale bar, 200 μm; n = 3. (F) Impact of MLF1 overexpression on the mRNA level of IL1B in H2O2-treated AC16 cells; n = 3. (G) Validation of Mlf1 knockdown in neonatal rat ventricular myocytes (NRVMs) using qRT-PCR; n = 3. (H) Representative WGA staining images (left) and quantification of cell area (right) in Mlf1-knockdown NRVMs in presence or absence of PE (50 μM). Scale bar, 100 μm; n = 30. (I) Impact of Mlf1 knockdown on PE-induced hypertrophy markers, including Nppa, Nppb and Myh7. n = 6. *P< 0.05, **P< 0.01, ***P< 0.001 versus siNeg. #P< 0.05, ##P< 0.01, ###P< 0.001 versus Control.
Figure 4.
Figure 4.
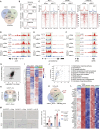
MLF1 promotes chromatin opening. (A) Volcano map showing the DEGs in AC16 cells after MLF1 knockdown detected by RNA-seq. (B) GO analysis of the upregulated (upper) and downregulated (lower) genes after MLF1 knockdown. (C) Chromatin distribution of the DEGs after MLF1 knockdown or H2O2 treatment. (D) Immunoblots showing the location of endogenous MLF1 protein in subcellular fractions of AC16 cells. EZH2 and GAPDH were used as nuclear/chromatin and cytosol internal controls, respectively. (E) Pie chart of the proportion of genes with different chromatin status after MLF1 knockdown detected by ATAC-seq. (F) Heatmap of peaks from ATAC-seq showing clustered genes with reduced chromatin accessibility after MLF1 knockdown. (G) Venn diagram of altered genes in RNA-seq and ATAC-seq after MLF1 knockdown. (H) Functional enrichment of the 119 genes with reduced chromatin accessibility as well as transcription. (I) Venn diagram of the abovementioned 119 genes together with altered genes in H2O2-treated AC16 cells. (J) Heatmap showing the expression of 38 aging-sensitive genes among the abovementioned 119 genes. (K) Illustration of ATAC-seq peaks at the promoter regions of genes related to senescence (IL1B and IL4R), and development (PDGFRA). (L) Genomic distribution analysis of MLF1 in AC16 cells using the CUT & Tag technique. (M) CUT & Tag shows the genomic distribution of MLF1. (N) Venn diagram of the abovementioned 119 genes together with peaks interacting with MLF1. (O) Motif analysis of MLF1-binding regions.
Figure 5.
Figure 5.
PRC2 interacts with MLF1 but is not required for its function. (A) Enrichment analysis of histone modifications and TFs of the downregulated genes after MLF1 knockdown predicted by GSEA and Enrichr. (B) Enrichment analysis of histone modifications and TFs of the genes with reduced chromatin accessibility predicted by Enrichr. (C) Structure docking between MLF1 and PRC2 showing the molecular basis underpinning their interaction. (D, E) Co-IP assay to validate the interaction between MLF1 and PRC2 subunits using ectopically expressed FLAG-tagged MLF1 (D) or PRC2 subunits (E), including EZH2 and SUZ12. (F) Immunofluorescence reveals the co-localization of MLF1 alongside EZH2 and SUZ12 within AC16 cells. Scale bar, 20 μm. (G) IP assay validating the endogenous interactions of MLF1 with SUZ12 and EZH2. Normal IgG was used as a negative control. Anti-SUZ12 antibody was used as a positive control for the SUZ12–EZH2 interaction. (H, I) Impacts of PRC2 inhibition by GSK126 (1 μM; H) or SUZ12 knockdown (I) on the decrease in IL1B expression after MLF1 knockdown in H2O2-treated AC16 cells. n = 3. n.s., not significant. ***P< 0.001.
Figure 6.
Figure 6.
EP300 mediates the function of MLF1 in chromatin remodeling. (A, B) Effects of siRNA-mediated MLF1 knockdown (A) and adenovirus-mediated MLF1 overexpression (B) on histone modifications, including H3K4me3, H3K9me3, H3K27me3, H3K36me3, H3K9ac and H3K27ac, measured by Western blot; n = 3. (C) Schematic illustrating histone acetylation modifiers and respective inhibitors. (D, E) Impact of the HDACs inhibitor Trichostatin A (TSA, 1 μM; D) or EP300 activator CTB (1 μM, E) on the decrease in IL1B expression after MLF1 knockdown in H2O2-treated AC16 cells. n = 3∼4, as indicated by dots. (F) Impact of the EP300 inhibitor CBP/P300-IN-12 (1 μM) on the enhancement of IL1B expression after MLF1 overexpression in H2O2-treated AC16 cells. n.s., not significant. n = 4. (G) Validation of EP300 knockdown efficiency in AC16 cells measured by Western blot. n = 3. (H) Impact of the EP300 knockdown on the enhancement of IL1B expression after Adenovirus-mediated MLF1 overexpression in H2O2-treated AC16 cells. n = 4. (I) Impacts of CBP/P300-IN-12 treatment and EP300 knockdown on H3K27ac in AC16 cells overexpressing EGFP or MLF1. n = 3. (J) IP assay validating the endogenous interactions of MLF1 with EP300. Normal IgG was used as a negative control. (K) Immunofluorescence reveals the co-localization of MLF1 with EP300 in AC16 cells. Scale bar, 20 μm. (L) Schematic illustrating the design for truncated EP300 fragments (upper) and their expression validation tagged with FLAG or HA (lower) in 293T cells. (M, N) Co-IP assay to validate the interaction between MLF1 and EP300 fragments using FLAG-tagged EP300 fragments (M) or MLF1 (N). n.s., not significant. *P< 0.05, **P< 0.01, ***P< 0.001 versus siNeg. #P< 0.05, ##P< 0.01, ###P< 0.001 versus Control.
Figure 7.
Figure 7.
MLF1 recruits EP300 to target promoters. (A) Venn diagram of MLF1, EP300 and H3K27ac-occupied genes. (B, C) CUT & Tag reveals the distribution changes of MLF1, EP300 and H3K27ac in the genome (B) and gene subsets List1 (C), following MLF1 knockdown. (DF) Illustration of CUT & Tag peaks at the promoter regions of genes related to senescence (IL1B; D and p21; E) and hypertrophic markers (NPPA and NPPB; F) after MLF1 knockdown in AC16 cells. (G) Scatter plot of transcriptomic distribution in AC16 cells after MLF1 or EP300 knockdown. (H) Venn diagram of upregulated or downregulated DEGs in both MLF1 knockdown and EP300 gene silencing. (I) Heatmaps showing the DEGs that change concordantly following MLF1 and EP300 knockdown. (J) Functional enrichment of the 390 DEGs downregulated, following the knockdown of both MLF1 and EP300. (K) Overlapping relationship of upregulated genes after H2O2 treatment and downregulated genes after both MLF1 and EP300 knockdown. (L) Heatmaps display the 35 hub genes that are induced by H2O2 treatment and subsequently downregulated following the knockdown of both MLF1 and EP300. (M) Representative SA-β-Gal staining images (left) and quantification (right) showing the impact of the IL1B knockdown on the enhancement of SA-β-Gal staining after Adenovirus-mediated MLF1 overexpression in H2O2-treated AC16 cells. Scale bar, 100 μm. n = 5. *P< 0.05, ***P< 0.001 versus siNeg. ##P< 0.01, ###P< 0.001 versus Control.

References

    1. Lieb W., Xanthakis V., Sullivan L.M., Aragam J., Pencina M.J., Larson M.G., Benjamin E.J., Vasan R.S.. Longitudinal tracking of left ventricular mass over the adult life course: clinical correlates of short- and long-term change in the framingham offspring study. Circulation. 2009; 119:3085–3092. - PMC - PubMed
    1. Upadhya B., Taffet G.E., Cheng C.P., Kitzman D.W.. Heart failure with preserved ejection fraction in the elderly: scope of the problem. J. Mol. Cell Cardiol. 2015; 83:73–87. - PMC - PubMed
    1. Liu C.Y., Liu Y.C., Wu C., Armstrong A., Volpe G.J., van der Geest R.J., Liu Y., Hundley W.G., Gomes A.S., Liu S.et al. .. Evaluation of age-related interstitial myocardial fibrosis with cardiac magnetic resonance contrast-enhanced T1 mapping: MESA (Multi-Ethnic Study of Atherosclerosis). J. Am. Coll. Cardiol. 2013; 62:1280–1287. - PMC - PubMed
    1. Afilalo J., Alexander K.P., Mack M.J., Maurer M.S., Green P., Allen L.A., Popma J.J., Ferrucci L., Forman D.E.. Frailty assessment in the cardiovascular care of older adults. J. Am. Coll. Cardiol. 2014; 63:747–762. - PMC - PubMed
    1. Obas V., Vasan R.S.. The aging heart. Clin Sci. (Lond). 2018; 132:1367–1382. - PubMed

MeSH terms