. 2025 Apr;31(2):426-444.
doi: 10.3350/cmh.2024.0686. Epub 2024 Dec 10.

Integrated molecular characterization of sarcomatoid hepatocellular carcinoma

Affiliations

Integrated molecular characterization of sarcomatoid hepatocellular carcinoma

Rong-Qi Sun et al. Clin Mol Hepatol. 2025 Apr.

Abstract

Backgrounds/aims: Sarcomatoid hepatocellular carcinoma (HCC) is a rare histological subtype of HCC characterized by extremely poor prognosis; however, its molecular characterization has not been elucidated.

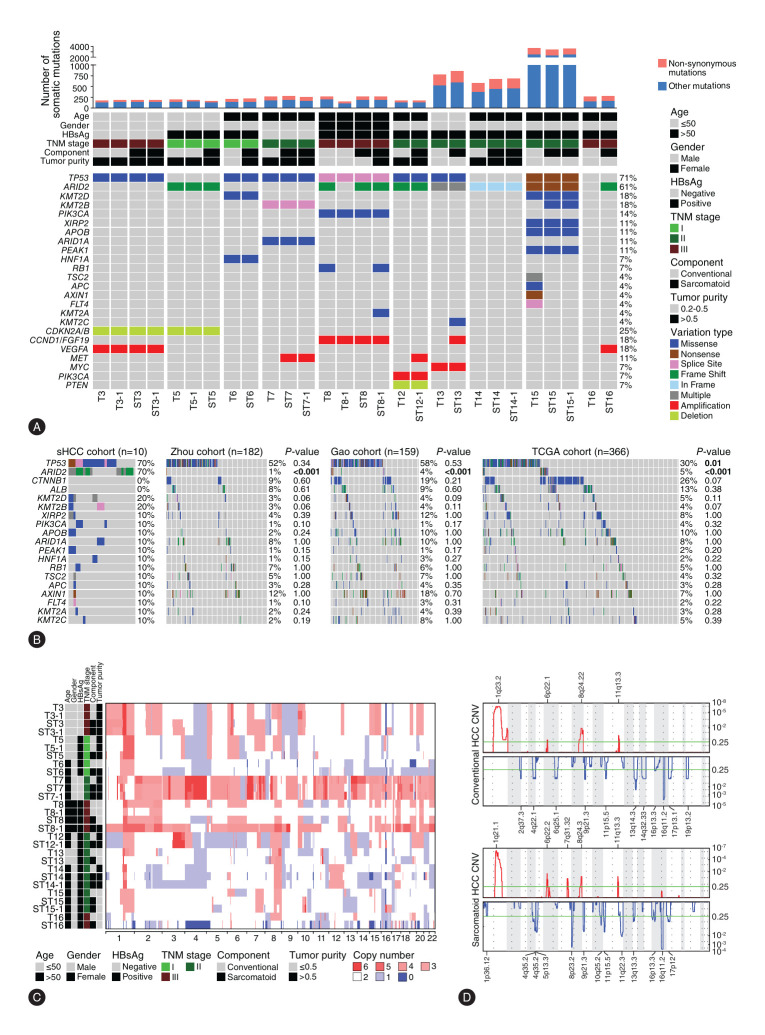
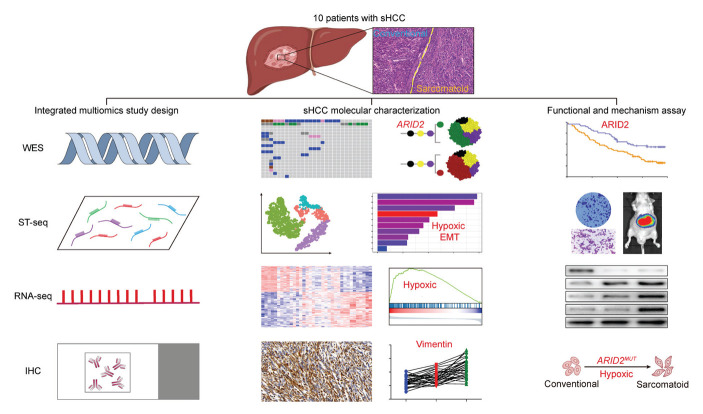
Methods: In this study, we conducted an integrated multiomics study of whole-exome sequencing, RNA-seq, spatial transcriptome, and immunohistochemical analyses of 28 paired sarcomatoid tumor components and conventional HCC components from 10 patients with sarcomatoid HCC, in order to identify frequently altered genes, infer the tumor subclonal architectures, track the genomic evolution, and delineate the transcriptional characteristics of sarcomatoid HCCs.

Results: Our results showed that the sarcomatoid HCCs had poor prognosis. The sarcomatoid tumor components and the conventional HCC components were derived from common ancestors, mostly accessing similar mutational processes. Clonal phylogenies demonstrated branched tumor evolution during sarcomatoid HCC development and progression. TP53 mutation commonly occurred at tumor initiation, whereas ARID2 mutation often occurred later. Transcriptome analyses revealed the epithelial-mesenchymal transition (EMT) and hypoxic phenotype in sarcomatoid tumor components, which were confirmed by immunohistochemical staining. Moreover, we identified ARID2 mutations in 70% (7/10) of patients with sarcomatoid HCC but only 1-5% of patients with non-sarcomatoid HCC. Biofunctional investigations revealed that inactivating mutation of ARID2 contributes to HCC growth and metastasis and induces EMT in a hypoxic microenvironment.

Conclusion: We offer a comprehensive description of the molecular basis for sarcomatoid HCC, and identify genomic alteration (ARID2 mutation) together with the tumor microenvironment (hypoxic microenvironment), that may contribute to the formation of the sarcomatoid tumor component through EMT, leading to sarcomatoid HCC development and progression.

Keywords: ARID2; Epithelial–mesenchymal transition; Multiomics; Sarcomatoid hepatocellular carcinoma.


Conflict of interest statement

Conflicts of Interest

The authors have no conflicts to disclose.

Figures

Figure 1.
Figure 1.
Genomic landscape of 28 paired sarcomatoid tumor components and conventional HCC components from 10 patients with sarcomatoid HCC. (A) The mutational spectrum of 28 paired sarcomatoid tumor components and conventional HCC components from 10 patients with sarcomatoid HCC identified by whole-exome sequencing. (B) Comparison of the most frequently mutated cancer-related genes between patients with sarcomatoid HCC (n=10) and patients with non-sarcomatoid HCC in cohorts from three previous studies. (C) Heatmap of copy-number variations in sarcomatoid HCCs. The x-axis shows chromosomal coordinates. (D) GISTIC analysis revealed the genome distribution of copy-number alterations in sarcomatoid tumor components (lower panel) and conventional HCC components (upper panel). GISTIC q-values (y-axis) for deletions (blue) and amplifications (red) are plotted across the genome (x-axis). HCC, hepatocellular carcinoma; TNM, tumor-node-metastasis.
Figure 2.
Figure 2.
Subclonal architectures and clone phylogenies of sarcomatoid HCCs. Each subclonal architecture represents an individual patient. The diameter of each oval with color is proportional to the estimated cancer cell fraction, which reflects the proportion of cells in that sample that contain the somatic mutations. For the clone phylogenies, FFPE samples with hematoxylin and eosin staining are arrayed in the middle. The clone phylogenies inferred from each conventional HCC component or sarcomatoid tumor component are displayed on the left and right side, respectively. Phylogenetic trees constructed from each patient are displayed on the bottom. Line lengths reflect the numbers of clustered somatic mutations attributed to that clone or subclone. Driver mutations are listed on the corresponding clone or subclone in each phylogenetic tree. FFPE, formalin-fixed and paraffin-embedded; HCC, hepatocellular carcinoma.
Figure 3.
Figure 3.
Transcriptome analyses of sarcomatoid HCCs. (A) Spatial transcriptome (ST) sequencing for patient P03. (B) Marker genes of the four clusters in ST sequencing. (C) Gene Ontology (GO) results of conventional HCC cluster compared with peritumor liver cluster, or sarcomatoid tumor cluster compared with conventional HCC cluster in ST sequencing. (D) The heatmap of RNA-seq for 35 samples from 9 patients with sarcomatoid HCCs. (E) GO results of conventional HCC compared with peritumor liver tissues, or sarcomatoid tumor components compared with conventional HCC components in RNA-seq. (F) Gene Set Enrichment Analysis (GSEA) results of EMT and hypoxic pathways in conventional HCC tissues or in sarcomatoid HCCs. (G) TPM of E-cadherin and Vimentin in peritumor liver tissues, conventional HCC components, and sarcomatoid tumor components from 9 patients involved in RNA-seq. EMT, epithelial–mesenchymal transition; ES, enrichment score; HCC, hepatocellular carcinoma; NES, normalized enrichment score; TPM, transcripts per million.
Figure 4.
Figure 4.
Phenotypic and microenvironment features in sarcomatoid HCCs. Immunohistochemical staining showed the expression of E-cadherin, Vimentin, N-cadherin, HIF-1α, and CAIX in 31 sarcomatoid HCCs with both sarcomatoid tumor components and conventional HCC components; scale bars=100 μm. HCC, hepatocellular carcinoma.
Figure 5.
Figure 5.
Clinical significance of ARID2 alteration in patients with sarcomatoid HCC and patients with non-sarcomatoid HCC. (A) Distribution of the somatic mutations in ARID2 identified in this study. (B) Representative ARID2 staining in peritumor tissues and tumor tissues from non-sarcomatoid HCCs and in conventional components and sarcomatoid components from ARID2-mutated sarcomatoid HCCs; scale bars=100 μm. (C, D) The statistics of ARID2 staining density in different groups, *P<0.05, **P<0.01, ***P<0.001. (E) Kaplan-Meier survival analysis showing OS and RFS rates based on ARID2 expression in 124 matched patients with non-sarcomatoid HCC. Multivariate analysis shows the ability of ARID2 expression to predict OS and RFS compared with that of other clinical parameters, *P<0.05, **P<0.01. CI, confidence interval; HCC, hepatocellular carcinoma; HR, hazard ratio; MT, mutant; OS, overall survival; RFS, recurrence-free survival; WT, wild-type.
Figure 6.
Figure 6.
Identification of ARID2 as a tumor-suppressor gene in HCC. (A) ARID2 expression examined by qRT-PCR and western blot in six HCC cell lines (HepG2, PLC/PRF/5, Hep3B, MHCC97L, MHCC97H, and HCCLM3) and in stably transfected cells. (B) Proliferation of HepG2 cells after ARID2 knockdown and of HCCLM3 cells expressing wild-type or mutant ARID2 compared with that of controls. (C) Colony formation activity of HepG2 cells after ARID2 knockdown and of HCCLM3 cells expressing wild-type or mutant ARID2 compared with that of controls. Bar graphs illustrate quantification of the colony formation assay, *P<0.05, **P<0.01, ***P<0.001. (D) Invasion of HepG2 cells after ARID2 knockdown and of HCCLM3 cells expressing wild-type or mutant ARID2 compared with that of controls. The graphs depict the number of invasive cells after 48 hr, *P<0.05, **P<0.01, ***P<0.001. (E) Representative bioluminescence images of mouse liver tumors and pulmonary metastasis. The color scale bar depicts the photon flux emitted from the mice, *P<0.05, **P<0.01, ***P<0.001. HCC, hepatocellular carcinoma.
Figure 7.
Figure 7.
Hypoxia facilitated EMT of HCC cells carrying inactivated ARID2. (A) Results of qRT-PCR and (B) western blot analysis showed changes in EMT marker (E-cadherin, N-cadherin, Vimentin, and snail) expression in HCCLM3 cells expressing wild-type or mutant ARID2 compared with that of controls. (C) Results of qRT-PCR and (D) western blot analysis showed changes in EMT marker expression in HepG2 cells after ARID2 knockdown compared with that of controls and under hypoxic conditions. (E) Results of qRT-PCR and (F) western blot analysis showed changes in EMT marker expression in HCCLM3 cells under hypoxic conditions compared with that of controls. (G) Representative images of serial tumor sections from xenograft tumor models. Scale bars=100 μm. EMT, epithelial–mesenchymal transition; HCC, hepatocellular carcinoma.
None

References

    1. Siegel RL, Miller KD, Jemal A. Cancer statistics, 2020. CA Cancer J Clin. 2020;70:7–30. - PubMed
    1. Zhou SL, Zhou ZJ, Hu ZQ, Huang XW, Wang Z, Chen EB, et al. Tumor-associated neutrophils recruit macrophages and T-regulatory cells to promote progression of hepatocellular carcinoma and resistance to sorafenib. Gastroenterology. 2016;150:1646–1658.e17. - PubMed
    1. Ahn SM, Jang SJ, Shim JH, Kim D, Hong SM, Sung CO, et al. Genomic portrait of resectable hepatocellular carcinomas: implications of RB1 and FGF19 aberrations for patient stratification. Hepatology. 2014;60:1972–1982. - PubMed
    1. Cancer Genome Atlas Research Network Comprehensive and integrative genomic characterization of hepatocellular carcinoma. Cell. 2017;169:1327–1341.e23. - PMC - PubMed
    1. Fujimoto A, Furuta M, Totoki Y, Tsunoda T, Kato M, Shiraishi Y, et al. Whole-genome mutational landscape and characterization of noncoding and structural mutations in liver cancer. Nat Genet 2016;48:500-509. Erratum in: Nat Genet. 2016;48:700. - PubMed

MeSH terms

Substances