. 2025 Apr;31(2):409-425.
doi: 10.3350/cmh.2024.0657. Epub 2024 Dec 10.

GOLM1 promotes cholesterol gallstone formation via ABCG5-mediated cholesterol efflux in metabolic dysfunction-associated steatohepatitis livers

Affiliations

GOLM1 promotes cholesterol gallstone formation via ABCG5-mediated cholesterol efflux in metabolic dysfunction-associated steatohepatitis livers

Yi-Tong Li et al. Clin Mol Hepatol. 2025 Apr.

Abstract

Background/aims: Metabolic dysfunction-associated steatohepatitis (MASH) is a significant risk factor for gallstone formation, but mechanisms underlying MASH-related gallstone formation remain unclear. Golgi membrane protein 1 (GOLM1) participates in hepatic cholesterol metabolism and is upregulated in MASH. Here, we aimed to explore the role of GOLM1 in MASH-related gallstone formation.

Methods: The UK Biobank cohort was used for etiological analysis. GOLM1 knockout (GOLM1-/-) and wild-type (WT) mice were fed with a high-fat diet (HFD). Livers were excised for histology and immunohistochemistry analysis. Gallbladders were collected to calculate incidence of cholesterol gallstones (CGSs). Biles were collected for biliary lipid analysis. HepG2 cells were used to explore underlying mechanisms. Human liver samples were used for clinical validation.

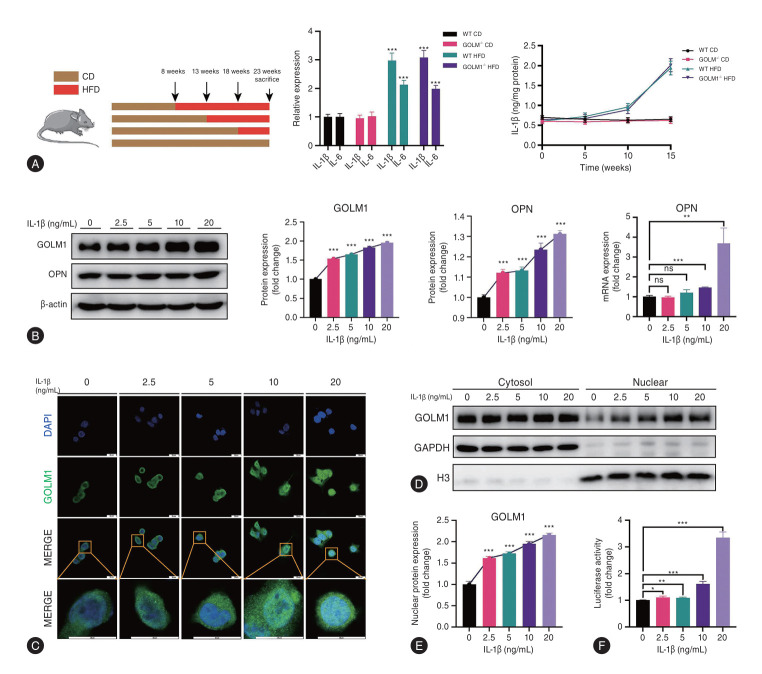
Results: MASH patients had a greater risk of cholelithiasis. All HFD-fed mice developed MASH, and the incidence of gallstones was 16.7% and 75.0% in GOLM1-/- and WT mice, respectively. GOLM1-/- decreased biliary cholesterol concentration and output. In vivo and in vitro assays confirmed that GOLM1 facilitated cholesterol efflux through upregulating ATP binding cassette transporter subfamily G member 5 (ABCG5). Mechanistically, GOLM1 translocated into nucleus to promote osteopontin (OPN) transcription, thus stimulating ABCG5-mediated cholesterol efflux. Moreover, GOLM1 was upregulated by interleukin-1β (IL-1β) in a dose-dependent manner. Finally, we confirmed that IL-1β, GOLM1, OPN, and ABCG5 were enhanced in livers of MASH patients with CGSs.

Conclusion: In MASH livers, upregulation of GOLM1 by IL-1β increases ABCG5-mediated cholesterol efflux in an OPN-dependent manner, promoting CGS formation. GOLM1 has the potential to be a molecular hub interconnecting MASH and CGSs.

Keywords: ATP binding cassette transporter subfamily G member 5; Gallstones; Golgi membrane protein 1; Metabolic dysfunction-associated steatohepatitis; Metabolism.


Conflict of interest statement

Conflicts of Interest

The authors have no conflicts to disclose.

Figures

Figure 1.
Figure 1.
GOLM1 participates in MASH-related CGS formation. (A) Left: Flow chart of the study using UK Biobank data. Middle: Cholelithiasis prevalence in healthy participants (4.3%, n=285,447), SS patients (17.5%, n=11,368), and MASH patients (19.3%, n=576). Right: Independent associations of age, sex, MASLD, MASH, SS, BMI, and IFG/DM with incident cholelithiasis. (B) Left: Schematic diagram of MASH mouse model establishment using GOLM1-/- and WT mice. Both GOLM1-/- and WT mice were randomly divided into 2 groups and fed a CD or HFD. n=12 per group at each time point. Middle left: Weight changes in the four groups. n=12 per group. Middle right: HE and Masson staining of representative livers from the four groups. Scale bar, 50 μm. Right: NASs of the four groups. n=12 per group. (C) Left and middle: Gross appearance of representative gallbladders and polarizing light microscopy examination of cholesterol crystals in the bile of the four groups. Scale bar, 50 μm. Right: Gallstone incidence in the four groups. n=12 per group. (D) IHC analysis of GOLM1 in liver tissues from the four groups. n=12 per group. (E) HE staining, Masson staining, and GOLM1 IHC staining of livers from HFD-fed mice at different time points. n=12 per group at each time point. (F) Left: GOLM1 IHC staining of livers from CD- and HFD-fed mice at different time points. Right: Gallstone incidence in normal, SS, and MASH mice. n=12 per group at each time point. ns, nonsignificant; **P<0.01, ***P<0.005. BMI, body mass index; CD, chow diet; CGS, cholesterol gallstone; GOLM1, Golgi membrane protein 1; GOLM1-/-, GOLM1 knockout; HE, hematoxylin-eosin; HFD, high-fat diet; IFG/DM, impaired fasting glucose/diabetes mellitus; IHC, immunohistochemistry; MASLD, metabolic dysfunction-associated steatotic liver disease; MASH, metabolic dysfunction-associated steatohepatitis; NAS, nonalcoholic fatty liver disease activity score; SS, simple steatosis; WT, wild-type.
Figure 2.
Figure 2.
GOLM1 fosters cholesterol efflux to promote CGS formation. (A) Concentrations of biliary cholesterol, phospholipids, bile acids, and total lipid contents and CSI scores in the four groups of mice. n=12 per group. (B) qRT-PCR analysis and IHC staining of hepatic ABCG5 in the four groups of mice. n=12 per group. Scale bar, 100 μm. (C) Bile flow rates and biliary lipid outputs of the mice in the four groups. n=12 per group. (D) GOLM1 and ABCG5 protein levels and supernatant cholesterol concentrations in HepG2-shGOLM1-1/-2 and HepG2-GOLM1 cells. ns, nonsignificant; *P<0.05, **P<0.01, ***P<0.005. After 15 weeks of CD or HFD feeding, the mice were sacrificed, and samples were collected. ABCG5, ATP binding cassette transporter subfamily G member 5; CD, chow diet; CGS, cholesterol gallstone; CSI, cholesterol saturation index; GOLM1, Golgi membrane protein 1; GOLM1-/-, GOLM1 knockout; HFD, high-fat diet; HepG2-GOLM1 cells, GOLM1-overexpressing HepG2 cells; HepG2-shGOLM1 cells, GOLM1-knockdown HepG2 cells; IHC, immunohistochemistry; qRT-PCR, quantitative real-time polymerase chain reaction; WT, wild-type.
Figure 3.
Figure 3.
GOLM1 promotes cholesterol efflux by upregulating OPN. (A) Left: Heatmap of the differentially expressed genes between the low- and high-GOLM1 groups. Middle: Linear regression lines showing the correlation between GOLM1 and OPN in the clinical cohort (n=110). Right: OPN mRNA expression in the low- and high-GOLM1 groups. (B) IHC staining of hepatic OPN in the four groups of mice. n=12 per group. Scale bar, 100 μm. (C) GOLM1, OPN, and ABCG5 protein expression in HepG2-shGOLM1-1/-2 and HepG2-GOLM1 cells. (D) GOLM1, OPN, and ABCG5 protein levels and supernatant cholesterol concentrations in HepG2-shOPN-1/-2 and HepG2-OPN cells. (E) GOLM1, OPN, and ABCG5 protein expression and supernatant cholesterol concentrations in shGOLM1, shGOLM1+OPN-OE, GOLM1-OE, and GOLM1-OE+shOPN HepG2 cells. ns, nonsignificant; *P<0.05, **P<0.01. ABCG5, ATP binding cassette transporter subfamily G member 5; CD, chow diet; GOLM1, Golgi membrane protein 1; GOLM1-/-, GOLM1 knockout; HepG2-GOLM1 cells, GOLM1-overexpressing HepG2 cells; HepG2-OPN cells, OPN-overexpressing HepG2 cells; HepG2-shGOLM1 cells, GOLM1-knockdown HepG2 cells; HepG2-shOPN cells, OPN-knockdown HepG2 cells; HFD, high-fat diet; IHC, immunohistochemistry; OPN, osteopontin; WT, wild-type.
Figure 4.
Figure 4.
GOLM1 nuclear translocation promotes OPN transcription. (A) Left: qRT-PCR analysis of OPN in the livers of the four groups of mice. n=12 per group. Middle/right: qRT-PCR analysis of OPN in HepG2-shGOLM1-1/-2 and HepG2-GOLM1 cells. (B) GOLM1 expression in the nucleus and cytoplasm of HepG2 and HepG2-GOLM1 cells. (C) IF analysis of the localization of GOLM1 in HepG2-GOLM1 and control cells. Scale bar, 20 μm. (D) ChIP assay of the binding level of the GOLM1 protein to the OPN promoter region in HepG2 and HepG2-GOLM1 cells. (E) Dual-luciferase reporter assay of luciferase activity in HepG2-GOLM1 cells. (F) Left: Schematic diagram of the serial deletion constructs of the OPN promoter. Right: Dual-luciferase reporter assay showing the luciferase activity of HepG2-GOLM1 and control cells transfected with OPN promoter deletion constructs (–500/+20, –267/+20, –127/+20, –70/+20, and –20/+20). ns, nonsignificant; *P<0.05, **P<0.01, ***P<0.005. CD, chow diet; ChIP, chromatin immunoprecipitation; GOLM1, Golgi membrane protein 1; GOLM1-/-, GOLM1 knockout; HepG2-GOLM1 cells, GOLM1-overexpressing HepG2 cells; HepG2-shGOLM1 cells, GOLM1-knockdown HepG2 cells; HFD, high-fat diet; IF, immunofluorescence; OPN, osteopontin; qRT-PCR, quantitative real-time polymerase chain reaction; WT, wild-type.
Figure 5.
Figure 5.
Liver inflammation increases GOLM1 expression and its nuclear translocation. (A) Left: Schematic diagram of the HFD feeding experiment. Middle: Relative expression of IL-1β and IL-6 in the four groups of mice. Right: Curve of the change in hepatic IL-1β with increasing HFD feeding time. n=12 per group at each time point. (B) Effect of IL-1β on the expression of GOLM1 and OPN in HepG2 cells. (C) IF analysis of the effect of IL-1β on GOLM1 localization in HepG2 cells. (D, E) GOLM1 expression in the nucleus and cytoplasm of HepG2 cells supplemented with the indicated concentrations of IL-1β. (F) Dual-luciferase reporter assay showing the luciferase activity of HepG2 cells supplemented with the indicated concentrations of IL-1β. ns, nonsignificant; *P<0.05, **P<0.01, ***P<0.005. CD, chow diet; HFD, high-fat diet; GOLM1, Golgi membrane protein 1; GOLM1-/-, GOLM1 knockout; IF, immunofluorescence; IL-1β, interleukin-1β; IL-6, interleukin-6; OPN, osteopontin; WT, wild-type.
Figure 6.
Figure 6.
GOLM1 is upregulated in MASH patients with gallstones. (A) HE staining; Masson staining; NAS; and TG, TC, AST, and ALT levels of MASH patients with gallstones (n=32) and without gallstones (n=10). Scale bar, 200 μm. (B) GOLM1 expression in the livers of MASH patients with (n=32) and without gallstones (n=10). (C) OPN expression in the livers of MASH patients with (n=32) and without gallstones (n=10). Scale bar, 100 μm. (D) ABCG5 expression in the livers of MASH patients with (n=32) and without gallstones (n=10). Scale bar, 100 μm. (E) IL-1β concentration in the livers of MASH patients with (n=32) and without gallstones (n=10). ns, nonsignificant; ***P<0.005. ABCG5, ATP binding cassette transporter subfamily G member 5; ALT, alanine aminotransferase; AST, aspartate aminotransferase; GOLM1, Golgi membrane protein 1; HE, hematoxylin-eosin; IHC, immunohistochemistry; IL-1β, interleukin-1β; MASH, metabolic dysfunction-associated steatohepatitis; NAS, nonalcoholic fatty liver disease activity score; OPN, osteopontin; TC, total cholesterol; TG, triglyceride.
None

Similar articles

Cited by

References

    1. Lammert F, Gurusamy K, Ko CW, Miquel JF, Méndez-Sánchez N, Portincasa P, et al. Gallstones. Nat Rev Dis Primers. 2016;2:16024. - PubMed
    1. Chen Y, Kong J, Wu S. Cholesterol gallstone disease: focusing on the role of gallbladder. Lab Invest. 2015;95:124–131. - PubMed
    1. Chen Z, Shao W, Li Y, Zhang X, Geng Y, Ma X, et al. Inhibition of PCSK9 prevents and alleviates cholesterol gallstones through PPARα-mediated CYP7A1 activation. Metabolism. 2024;152:155774. - PubMed
    1. Park JS, Lee DH, Lee YS, Oh E, Bae KH, Oh KJ, et al. Dual roles of ULK1 (unc-51 like autophagy activating kinase 1) in cytoprotection against lipotoxicity. Autophagy. 2020;16:86–105. - PMC - PubMed
    1. Rappez L, Stadler M, Triana S, Gathungu RM, Ovchinnikova K, Phapale P, et al. SpaceM reveals metabolic states of single cells. Nat Methods. 2021;18:799–805. - PMC - PubMed

MeSH terms