SuperSpot: coarse graining spatial transcriptomics data into metaspots
- PMID: 39657949
- PMCID: PMC11725322
- DOI: 10.1093/bioinformatics/btae734
SuperSpot: coarse graining spatial transcriptomics data into metaspots
Abstract
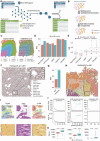
Summary: Spatial Transcriptomics is revolutionizing our ability to phenotypically characterize complex biological tissues and decipher cellular niches. With current technologies such as VisiumHD, thousands of genes can be detected across millions of spots (also called cells or bins depending on the technologies). Building upon the metacell concept, we present a workflow, called SuperSpot, to combine adjacent and transcriptomically similar spots into "metaspots". The process involves representing spots as nodes in a graph with edges connecting spots in spatial proximity and edge weights representing transcriptomic similarity. Hierarchical clustering is used to aggregate spots into metaspots at a user-defined resolution. We demonstrate that metaspots reduce the size and sparsity of spatial transcriptomic data and facilitate the analysis of large datasets generated with the most recent technologies.
Availability and implementation: SuperSpot is an R package available at https://github.com/GfellerLab/SuperSpot and archived on Zenodo (https://doi.org/10.5281/zenodo.14222088). The code to reproduce the figures is available at https://github.com/GfellerLab/SuperSpot/tree/main/figures (https://doi.org/10.5281/zenodo.14222088).
© The Author(s) 2024. Published by Oxford University Press.
Figures

Similar articles
-
Benchmarking algorithms for spatially variable gene identification in spatial transcriptomics.Bioinformatics. 2025 Mar 29;41(4):btaf131. doi: 10.1093/bioinformatics/btaf131. Bioinformatics. 2025. PMID: 40139667 Free PMC article.
-
Impeller: a path-based heterogeneous graph learning method for spatial transcriptomic data imputation.Bioinformatics. 2024 Jun 3;40(6):btae339. doi: 10.1093/bioinformatics/btae339. Bioinformatics. 2024. PMID: 38806165 Free PMC article.
-
STCGAN: a novel cycle-consistent generative adversarial network for spatial transcriptomics cellular deconvolution.Brief Bioinform. 2024 Nov 22;26(1):bbae670. doi: 10.1093/bib/bbae670. Brief Bioinform. 2024. PMID: 39715685 Free PMC article.
-
Building and analyzing metacells in single-cell genomics data.Mol Syst Biol. 2024 Jul;20(7):744-766. doi: 10.1038/s44320-024-00045-6. Epub 2024 May 29. Mol Syst Biol. 2024. PMID: 38811801 Free PMC article. Review.
-
A practical guide to spatial transcriptomics.Mol Aspects Med. 2024 Jun;97:101276. doi: 10.1016/j.mam.2024.101276. Epub 2024 May 21. Mol Aspects Med. 2024. PMID: 38776574 Review.
References
MeSH terms
Grants and funding
LinkOut - more resources
Full Text Sources

