. 2024 Dec 26;41(1):btae732.
doi: 10.1093/bioinformatics/btae732.

Autoencoder-based phenotyping of ophthalmic images highlights genetic loci influencing retinal morphology and provides informative biomarkers

Collaborators, Affiliations

Autoencoder-based phenotyping of ophthalmic images highlights genetic loci influencing retinal morphology and provides informative biomarkers

Panagiotis I Sergouniotis et al. Bioinformatics. .

Abstract

Motivation: Genome-wide association studies (GWAS) have been remarkably successful in identifying associations between genetic variants and imaging-derived phenotypes. To date, the main focus of these analyses has been on established, clinically-used imaging features. We sought to investigate if deep learning approaches can detect more nuanced patterns of image variability.

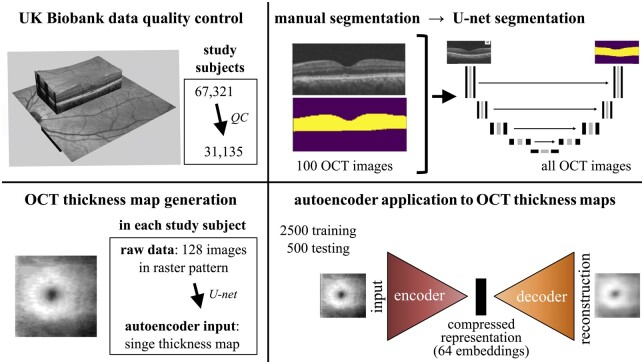
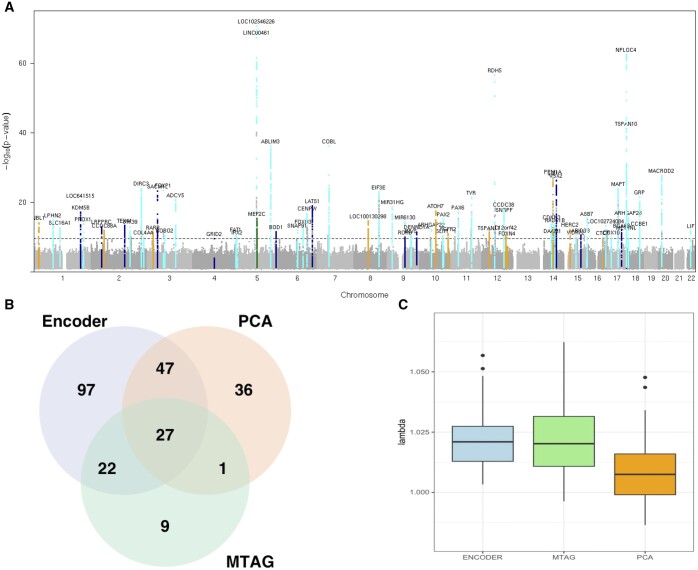
Results: We used an autoencoder to represent retinal optical coherence tomography (OCT) images from 31 135 UK Biobank participants. For each subject, we obtained a 64-dimensional vector representing features of retinal structure. GWAS of these autoencoder-derived imaging parameters identified 118 statistically significant loci; 41 of these associations were also significant in a replication study. These loci encompassed variants previously linked with retinal thickness measurements, ophthalmic disorders, and/or neurodegenerative conditions. Notably, the generated retinal phenotypes were found to contribute to predictive models for glaucoma and cardiovascular disorders. Overall, we demonstrate that self-supervised phenotyping of OCT images enhances the discoverability of genetic factors influencing retinal morphology and provides epidemiologically informative biomarkers.

Availability and implementation: Code and data links available at https://github.com/tf2/autoencoder-oct.


Figures

Figure 1.
Figure 1.
Outline of the experimental approach. OCT images from the central retinae of 67 321 UK Biobank participants were analyzed. After applying quality control (QC) filters considering genetic information and image quality, a cohort of 31 135 study subjects was identified. Aiming to generate retinal “thickness maps” for these individuals, OCT image segmentation was performed using an artificial neural network (U-Net) approach. In brief, 100 OCT images were manually segmented and the generated segmentation masks (examples shown in yellow) were used as input to the U-Net which subsequently segmented all other images. This allowed conversion of the 128 cross-sectional images obtained from each tested eye into a single thickness map image. The thickness maps of the left eyes were then used as input to an autoencoder. This was trained utilizing 2500 training and 500 test images. The output of the embedding network was designed to be a 64-dimensional vector (i.e. 64 variables were obtained for each study subject). These 64 autoencoder-derived embeddings were then used for genetic association studies, correlation analyses, and predictive modeling.
Figure 2.
Figure 2.
Genome-wide association studies of autoencoder-derived retinal OCT phenotypes (primary analysis). (A) Manhattan plot showing the P-values obtained from common-variant GWAS of embedded features (64 embeddings and first 25 embedding-related principal components). Signals that reached genome-wide significance (P < 5 × 10⁻⁸) only in embedding variable analyses are highlighted with dark blue. Signals that reached genome-wide significance only in analyses of embedding-related principal components are highlighted with orange. Signals that reach genome-wide significance only in MTAG of embedding variables are highlighted with green. All other genome-wide significant signals are highlighted with cyan. (B) Venn diagram shows the overlap of lead signals among: conventional GWAS of the 64 embeddings (“encoder” group in light blue); MTAG of the 64 embeddings (“MTAG” group in light green) and conventional GWAS of the first 25 embedding-related principal components (“PCA” group in light orange). (C) Genomic inflation factor lamda (λ) for 64 embedding-, 64 MTAG- and 25 PCA-GWAS (median λGC = 1.016).
Figure 3.
Figure 3.
Analysis of the chromosome 17q21.31 inversion association signal. (A) Genetic association study result highlighting a group of 2,936 common variants that passed the genome-wide significance threshold for MTAG of embedding no.21. The genetic alterations are colored based on their linkage disequilibrium (LD; R2) relationship to the inversion genotype. (B) Classification of the inversion status based on the pattern of alternative alleles across the 17q21.31 region for 487 409 UK Biobank participants. (C) Left eye retinal thickness maps showing the difference in retinal structure between individuals with different inversion-related alleles. Left: mean depth (thickness) representation for reference:reference (no inversion) alleles. Middle: difference between image mean for reference:reference and image mean for reference:inversion (heterozygous inversion) genotypes. Right: difference between image mean for reference:reference and image mean for inversion:inversion (homozygous inversion) genotypes. A paracentral area of differential retinal thickness can only be visualized in the reference-to-homozygous difference map (in keeping with a recessive effect). (D) Phenome-wide associations for the inversion genotype against 454 ICD10 disease codes for which there were >1000 cases in the UK Biobank cohort (when only data obtained after the date of OCT image acquisition were considered); six codes (M16, G20, I84, M20, K60, J84) remained significant after Bonferroni correction; −log10P-values are shown grouped by high-level ICD10 category.
Figure 4.
Figure 4.
Correlation and logistic regression analyses of autoencoder-derived retinal OCT phenotypes. (A) Direct (upper triangle) and genetic (lower triangle) correlations among embedded features (64 embeddings). The two correlation matrices are displayed using a heatmap where rows and columns were ordered by the distances obtained via hierarchical clustering (on the embedding value correlation matrix only). (B) Logistic regression analysis of the 64 embeddings against high-level ICD10 disease codes; only data obtained after the date of OCT image acquisition were included and only ICD10 codes for which there were >1000 cases in the UK Biobank cohort were considered; sex, age, height, and weight were factored in as covariates. A total of eight signals for five distinct ICD10 codes remained significant after Bonferroni correction: E11 (3), G40 (1), H40 (2), I25 (1), F10 (1). (C) Graph showing which specific embeddings were significantly correlated with the lead signals of the logistic regression analysis, i.e. non-insulin-dependent diabetes (E11), epilepsy (G40), glaucoma (H40) and chronic ischemic heart disease (I25); −log10P-values are shown for all 64 embedded features. (D) Left eye retinal thickness maps showing the difference in retinal structure between UK Biobank participants who were diagnosed with non-insulin-dependent diabetes (E11; first row), epilepsy (G40; second row), glaucoma (H40; third row), and chronic ischemic heart disease (I25; fourth row) after having an OCT scan against the groups of individuals that have not been assigned the relevant ICD10 codes.
Figure 5.
Figure 5.
Survival analysis investigating the contribution of embedded features upon the time-to-diagnosis for four ICD10 disease codes. (A) Concordance index evaluating the embedding-incorporating model’s ability to discriminate sex-stratified disease occurrence; the distribution across 20 repetitions of five-fold cross-validation is shown (n = 100 for each box plot); all box plots demarcate quartiles and median values, while whiskers extend to 1.5× of the interquartile range. (B) Kaplan–Meier plots showing sex-stratified risk of disease occurrence for the overall population as well as for high-risk cohorts determined by the embedding-incorporating model (top 25% based on Cox regression). (C) Graph highlighting which embedded features have a significant relationship with the selected diseases in male and female cohorts; −log10 hazard ratios are shown.

Similar articles

Cited by

References

    1. Bonazzola R, Ferrante E, Ravikumar N. et al. Unsupervised ensemble-based phenotyping enhances discoverability of genes related to left-ventricular morphology. Nat Mach Intell 2024;6:291–306. 10.1038/s42256-024-00801-1 - DOI - PMC - PubMed
    1. Bouma BE, de Boer JF, Huang D. et al. Optical coherence tomography. Nat Rev Methods Primers 2022;2:79. 10.1038/s43586-022-00162-2 - DOI - PMC - PubMed
    1. Budu-Aggrey A, Hysi P, Kehoe PG et al.The relationship between open angle glaucoma, optic disc morphology and Alzheimer’s disease: a Mendelian randomization study. bioRxiv 2020; 10.1101/2020.08.30.20184846, preprint: not peer reviewed. - DOI
    1. Bycroft C, Freeman C, Petkova D. et al. The UK Biobank resource with deep phenotyping and genomic data. Nature 2018;562:203–9. 10.1038/s41586-018-0579-z - DOI - PMC - PubMed
    1. Chua SYL, Thomas D, Allen N. et al.; UK Biobank Eye & Vision Consortium. Cohort profile: design and methods in the Eye and Vision Consortium of UK Biobank. BMJ Open 2019;9:e025077. 10.1136/bmjopen-2018-025077 - DOI - PMC - PubMed