. 2025 Jan 29;66(1):101-119.
doi: 10.1093/pcp/pcae145.

In planta ectopic expression of two subtypes of tomato cellulose synthase-like M genes affects cell wall integrity and supports a role in arabinogalactan and/or rhamnogalacturonan-I biosynthesis

Affiliations

In planta ectopic expression of two subtypes of tomato cellulose synthase-like M genes affects cell wall integrity and supports a role in arabinogalactan and/or rhamnogalacturonan-I biosynthesis

Ali S Hassan et al. Plant Cell Physiol. .

Abstract

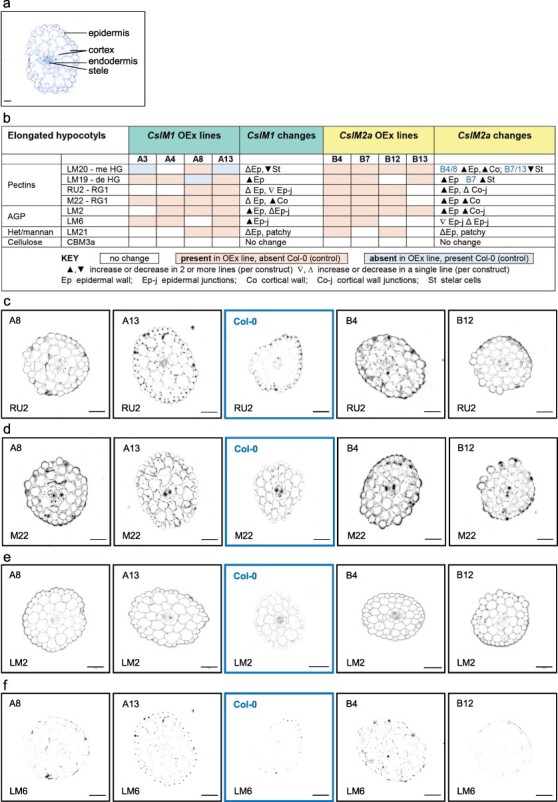
Diversification of the cellulose synthase superfamily of glycosyltransferases has provided plants with the ability to synthesize varied cell wall polysaccharides such as xyloglucan, mannans, and the mixed-linkage glucans of cereals. Surprisingly, some but not all members of the cellulose synthase-like M (CslM) gene family have recently been shown to be involved in the glycosylation of the aglycone core of a range of triterpenoid saponins. However, no cell wall activity has yet been attributed to any of the CslM gene family members. Here, evolution of the CslM gene family in eudicots is explored to better understand the differences between the two metabolically distinct classes of CslMs (CslM1 and CslM2) and the very closely related CslGs. To achieve this, a robust tBLASTn approach was developed to identify CslM1, CslM2, and CslG sequences using diagnostic peptides, suitable for complex genomes using unannotated and short-read datasets. To ascertain whether both CslM1 and CslM2 proteins have cell wall functions, in addition to the 'saponin' role of CslM2, tomato CslM1 and CslM2 genes were ectopically expressed in Arabidopsis thaliana by stable transformation and in the transient Nicotiana benthamiana system. Transformed plants were analysed with immunofluorescence, immunogold transmission electron microscopy, and cell wall polysaccharides were extracted for monosaccharide linkage analysis. Our results support a role for both CslM1 and CslM2 in the biosynthesis of type II arabinogalactan linkages, generating new insight into how the diverse functions of CslMs can coexist and providing clear targets for future research.

Keywords: Solanum lycopersicum; cellulose synthase-like; eudicots; heterologous gene expression; immunofluorescence; plant cell walls.


Conflict of interest statement

None declared.

Figures

Figure 1.
Figure 1.
Diversification of CslM proteins likely arose early in eudicot evolution with the small metabolite neofunctionalized form, CslM2, subsequently lost in some early linages and some rosids. (a) Phylogenetic analysis of gene-encoded CslM and CslJ proteins (Supplementary Fig. S2c) showing separation of CslMs into two well-supported clades (CslM1 and CslM2), separated from the monocot CslJs. Solanaceous species such as tomato and capsicum have genes for two CslM2 proteins (CslM2a and CslM2b) and they are the CslM2 proteins that are predicted to have 3-O-glycosylation activity on aglycone cores of glycoalkaloids. Maximum likelihood tree (MEGA, Kumar et al. 2018, using the JTT+G+I model and 1000 bootstrap replicates). The scale represents the number of amino acid substitutions per site. Nodes with values >70% are considered well supported (Baldauf 2003). (b) Three 50 aa long ‘diagnostic’ peptides used for stringent tBLASTn searches to identify CslG, CslM1, and CslM2 sequences, respectively, from annotated and unannotated genomes, transcriptomes, and even SRAs. Shaded residues form part of the CesA core motifs (Pedersen et al. 2023). (c) Summary of presence (blue) or absence (yellow) of CslM2-like genes in eudicot linages. The basal eudicot lineages, Proteales and Ranunculales, are shaded half blue and half yellow because there was at least one family with and one family without CslM2 sequences. The asterisks indicate taxonomic orders with experimentally demonstrated 3-O-glycosylation activity (Supplementary Table S1).
Figure 2.
Figure 2.
Application of the tBLASTn bioinformatic method to find CslM1, CslM2, and CslG sequences in the complex A. elata genome using diagnostic query peptides (Fig. 1b). The 10 CslM1 sequences identified are numbered, CslM1aj in the order that the alignments appeared in the tBLASTn output. The names CslM2a, CslM2b, and CslM2c are suggested instead of CSLM1 (AE06G00237.1), CSLM2 (AE06G00237.1), and CSLM3 (AE0G600234.1) used by Wang et al. (2022). CslG sequences are named CslG1, CslG2, and CslG3. The range number (#) indicates the order of hits on the same contig (chromosome). The first tBLASTn hit within a range (on the same contig) that exhibits a dramatic reduction in percent sequence ID (%ID) is listed as ‘Not a Cslx’ (red text), where x is the M1, M2, or G of the query peptide. All contig sequences have the NCBI accession number JAVJAP0100000xx.1, where xx is the chromosome number (09, for chromosome 9). Alternate shading is used to emphasize sequences on the same chromosome. Tandemly duplicated genes can be identified by the clustered start and stop positions of alignments (see CslM1e, CslM1f, CslM1g, and ClM1h). For simplicity, we have not used any species abbreviations before the gene names. Stringent parameters were used for tBLASTn at https://www.ncbi.nlm.nih.gov/: database, WGS, organism = A. elata, word size 2, no filter. n/a, not applicable.
Figure 3.
Figure 3.
Arabidopsis thaliana Col-0 (grey) ectopically expressing (OEx) CslM1 (A3, A4, A8, and A13; blue) and CslM2a (B4, B7, B12, and B13; orange) do not show a seed phenotype. (a) Two-dimensional seed area, seed length, seed width, and ratio of seed length to width. Points shown are the mean dimensions of 20–30 seeds per biological replicate (n = 6–7). (b) Mucilage extrusion patterns of multiple seeds per line (top panel) and the cropped surface pattern of a representative seed of each line (bottom panel). Scale bar applies to both top and bottom panels where it indicates 500 and 100 µm, respectively. (c) Mucilage secretory cell morphology shown as a representative SEM image of each line (scale bar = 50 µm). (d) Quantified MSC area (example marked in purple on Col-0), columella area (example marked in orange on Col-0), the proportion of columella to the MSC area, and the MSC radial wall thickness (example marked in yellow on Col-0). Points shown are the mean dimensions of 10 cells per seed per biological replicate (n = 5). A Student’s t-test was used to test statistical differences between mutants and Col-0. Significant differences to Col-0 (P < .05–.01) are indicated by an asterisk above the bar. Bar plots show the mean and standard deviation, while open grey symbols represent each replicate.
Figure 4.
Figure 4.
Immunofluorescence labelling of cross sections of Arabidopsis elongated hypocotyls ectopically expressing tomato CslM1 and CslM2a. Toluidine blue staining of elongated hypocotyl in wild-type Columbia (Col-0) (a) and the ectopically expressing (OEx) lines (Supplementary Fig. S9). (b) Summary of clear differences in the cell-type distribution and/or labelling intensity of cell wall epitopes, based on images in Supplementary Fig. S9, with a representative image below for four of the antibodies and two of four lines (c–f). The most consistent differences were observed with two pectin antibodies, INRU RU2 (RG-I) and M22 (RG-I) (c, d), and two AGP antibodies, LM2 (AGP) and LM6 (AGP) (e, f). Scale bars (a) 20 µm and (c–f) 50 µm.
Figure 5.
Figure 5.
Immunogold TEM of elongated hypocotyls. (a) LM2 antibody (AG) and (b) M22 (rhamnogalactan-I) labelling of three different cell layers in elongated hypocotyls: epidermis, cortex, and stele (top, middle, and bottom series of panels, respectively). For each cell type, the top row is wild-type Columbia (Col-0); the middle row is one of four CslM1 ectopically expressing lines; and the bottom row is one of four CslM2a ectopically expressing (OEx) lines (all lines in Supplementary Fig. S11). Different lines were used for the two antibodies: LM2 antibody (a), lines A8 (CslM1) and B12 (CslM2a); M22 antibody (b), lines A3 (CslM1) and B13 (CslM2a).
Figure 6.
Figure 6.
Transient expression of tomato CslM1 and CslM2a constructs in N. benthamiana leaves results in higher levels of type II AG. (a) Toluidine blue-stained leaf sections show regions of improperly formed lower epidermal cells in both CslM1 and CslM2a ectopic expressors (arrowed), but not in EV controls. In these aberrant regions, it appears as if there is only an outer wall with no side walls or an internal epidermal wall. Despite these structural changes, there were no consistent changes in the distribution of cell wall epitopes in the lower epidermal walls, or elsewhere in the leaf sections (Supplementary Fig. S13). Scale bars: 50 µm. (b) The level of type II AG increased ∼2-fold for both CslM1 and CslM2a ectopically expressing lines harvested 7 days after infiltration (n = 2 biological replicates, Experiment 2). Polysaccharide data are based on linkage analysis (mol%) (Supplementary Table S7).
Figure 7.
Figure 7.
A time course transient expression experiment with tomato CslM1 and CslM2a constructs in N. benthamiana leaves. Seedlings were infiltrated with either empty vector, CslM1, or CslM2a ectopic expression (OEx) constructs, and leaf tissue was sampled on Days 2, 4, and 7 for qPCR (Supplementary Fig. S14) with additional days included for microscopy (Days 2, 3, 4, 5, and 7) (Supplementary Fig. S15). (a) Comparison of Day 4 and 7 transient OEx with tomato CslM1 and CslM2a, compared to EV controls. Rows show the different constructs (empty vector, CslM1 and CslM2a), columns show different visualization methods as indicated [toluidine (tol) blue, LM2 labelling of AG epitopes, and M22 labelling of RG-I]. Images for all Days 2, 3, 4, 5, and 7 are in Supplementary Fig. S15. Scale bars, for each pair of images for each OEx line: top (100 μm) and bottom (50 μm). At least two independent leaf samples were analysed per line, and for EV controls, the entire lower epidermis was scanned on three independent leaves to confirm the absence of aberrant lower epidermal walls (arrows) as observed in the CslM OEx lines. (b) Immunogold TEM of N. benthamiana leaves from the final day (Day 7) of the time course experiment. Columns show the different constructs (empty vector, CslM1 OEx, and CslM2a OEx). Sections were labelled with M22, RG-I or LM2, AG. For each construct (and antibody), a representative epidermal cell wall is shown (top), and one internal (non-epidermal) wall is shown (bottom). Scale bar is 500 nm. For OEx lines, the internal walls show examples of stub walls in the region where side walls have not formed or have collapsed. Additional unlabelled TEM images of the aberrant walls are presented in Supplementary Fig. S16.

References

    1. Aharoni A., Sonawane P.D., Itkin M. and Jozwiak A. (2020) Cellulose-synthase-like enzymes and uses thereof. World Patent WO2020049572A1.
    1. Ajayi O.O., Held M.A. and Showalter A.M. (2021) Two β-glucuronosyltransferases involved in the biosynthesis of type II arabinogalactans function in mucilage polysaccharide matrix organization in Arabidopsis thaliana. BMC Plant Biol. 21: 245. - PMC - PubMed
    1. Amos R.A. and Mohnen D. (2019) Critical review of plant cell wall matrix polysaccharide glycosyltransferase activities verified by heterologous protein expression. Front. Plant Sci. 10: 915. - PMC - PubMed
    1. APG IV . (2016) An update of the Angiosperm Phylogeny Group classification for the orders and families of flowering plants: APG IV. Bot. J. Linn. Soc. 181: 1–20.
    1. Atmodjo M.A., Hao Z.Y. and Mohnen D. (2013) Evolving views of pectin biosynthesis. Annu. Rev. Plant Biol. 64: 747–779. - PubMed

MeSH terms

LinkOut - more resources