. 2025 Jan 11;53(2):gkae1180.
doi: 10.1093/nar/gkae1180.

Long G4-rich enhancers target promoters via a G4 DNA-based mechanism

Affiliations

Long G4-rich enhancers target promoters via a G4 DNA-based mechanism

Jeffrey D DeMeis et al. Nucleic Acids Res. .

Abstract

Several studies have now described instances where G-rich sequences in promoters and enhancers regulate gene expression through forming G-quadruplex (G4) structures. Relatedly, our group recently identified 301 long genomic stretches significantly enriched for minimal G4 motifs (LG4s) in humans and found the majority of these overlap annotated enhancers, and furthermore, that the promoters regulated by these LG4 enhancers are similarly enriched with G4-capable sequences. While the generally accepted model for enhancer:promoter specificity maintains that interactions are dictated by enhancer- and promoter-bound transcriptional activator proteins, the current study tested an alternative hypothesis: that LG4 enhancers interact with cognate promoters via a direct G4:G4 DNA-based mechanism. This work establishes the nuclear proximity of LG4 enhancer:promoter pairs, biochemically demonstrates the ability of individual LG4 single-stranded DNAs (ssDNAs) to directly interact target promoter ssDNAs, and confirms that these interactions, as well as the ability of LG4 enhancers to activate target promoters in culture, are mediated by G4 DNA.


Figures

Graphical Abstract
Graphical Abstract
Figure 1.
Figure 1.
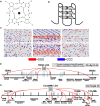
LG4 DNA. (A) Structure of an individual G-quartet wherein guanine nucleotides are held together by hydrogen bonds centered about a central potassium cation (K+). (B) Cartoon depiction of unimolecular antiparallel G4 DNA where each square corresponds to an individual G-quartet and the corners of each quartet correspond to a single guanine. (C) Two examples of LG4 loci in which ≥3 consecutive genomic Gs and ≥3 consecutive genomic Cs are highlighted. Top center, LG4 located at human Chr5:551935:556936:1; Top left and right, ∼5 kb sequences located 100 kb upstream and downstream of the central LG4 (Chr5:451935:456936:1 and Chr5:651936:656935:1, respectively). Bottom center, LG4 located at human Chr12:132686134:132690031:1. Bottom left and right, ∼5 kb sequences located 50 kb upstream and downstream of the central LG4 (Chr12:132636134:132640031:1 and Chr12:132736134:132740031:1, respectively). (D) Illustration of an insulated neighborhood within Chr5p15.33 centered on the LG4 located at Chr5:551935:556936:1 which is depicted above the assembly as a cartoon G4 structure labeled 550kb LG4. Protein coding genes and their orientation as annotated in Ensembl (25) are indicated by arrows located below the line segment representing the specified insulated neighborhood. Arrows originating at the LG4 and ending at various gene promoters indicate GeneHancer annotated promoter regulations for enhancers within the LG4 locus (GH05J000553, GH05J000555). Dashed lines represent regions of this insulated neighborhood which were concatenated to the LG4 within a single Pore-C read (Read SRR11589412.3086865.1). (E) Illustration of an insulated neighborhood within Chr12q24.33 which contains an LG4 located at Chr12:132686134:132690031:1. The LG4 is shown as a cartoon G4 structure labeled 132.68Mb LG4. Arrows originating at the LG4 and terminating at various promoters denote GeneHancer annotated promoter regulations (GH12J132686). The dashed lines denote regions of this insulated neighborhood which were joined to the LG4 within a single Pore-C read (Read SRR11589401.9930809.1). Genomic positions refer to GRCh38. Annotations of Pore-C reads (SRR11589412.3086865.1 and Read SRR11589401.9930809.1) are detailed in Supplementary Table S1.
Figure 2.
Figure 2.
EQuIP (Enhancer Quadruplex ImmunoPrecipitation). (A) Cartoon of stepwise EQuIP protocol. In brief, EQuIP employs a probe set consisting of distinct biotinylated oligo probes complementary to different regions of the LG4. Probes are designed to target regions flanking sequences meeting the minimal criteria for G4 formation as flanking sequences are presumably held single stranded by their neighboring G4s and therefore free to basepair with complementary probes. These probe sets are combined with crosslinked, digested chromatin and allowed to hybridize to LG4 DNA. Complexes containing biotinylated-probes bound to LG4 DNA are isolated using streptavidin magnetic beads then DNA recovered and analyzed by PCR. (B) Representative PCRs employing DNA template isolated from PC3 cell EQuIP pulldowns, pulldowns using non-specific probes (Mock IP), or total input DNA collected prior to IP. PCR amplicons (∼300 bp) located: (Chr5 LG4) within the Chr5 LG4 or within the annotated promoters upstream of the primary TSS of the MYO10, EXOC3, CEP72 and PDCD6 protein coding genes. PCR amplicons were verified by sequencing. % band intensity (EQuIP IP/Input) is presented as a bar graph below corresponding amplicons and depicts average values and standard deviations corresponding to multiple independent EQuIP assay replicates (n ≥ 3). Significance determined by unpaired two-tailed t-test. Full gel images are shown in Supplementary Figure S1.
Figure 3.
Figure 3.
Direct interaction between EXOC3 and CEP72 promoters and the Chr5 LG4 enhancer. (A) Illustration of an insulated neighborhood within Chr5p15.33 centered on the LG4 located at Chr5:551935:556936 which is depicted above the assembly as a cartoon G4 structure labeled 550kb LG4. Protein coding genes and their orientation as annotated in Ensembl (25) are indicated as arrows below the line segment representing the genomic region. Arrows originating at the LG4 and ending at various gene promoters indicate GeneHancer annotated promoter regulations for enhancers within the LG4 locus (GH05J000553, GH05J000555). (B) Flow chart of EMSA protocol. (C) Images of 1.5% agarose Tris-glycine gels ran at 4°C for 8 h at 75 V and then stained for 24 h with SYBR Gold. Each construct was run on a gel in either the unfolded (H2O) or folded (KCl)[250 mM] state as indicated above the image. Samples including more than one construct were folded together. Red arrows denote gel shifts observed when a promoter and the Chr5 LG4 are folded together. See Supplementary Figure S2 for a side by side comparison of HIF1 and EXOC3, and Supplementary Figure S3 for detailed EMSA quantifications.
Figure 4.
Figure 4.
EXOC3 promoter deletion analysis. (A) Cartoon depiction of positions of deletion constructs within the full length EXOC3 promoter sequence. Nucleotide positions are given with respect to the TSS indicated by an arrow. (B) Images of 1.5% agarose Tris-glycine gels ran at 4°C for 8 h at 75 V then stained with SYBR Gold for 24 h. Sample content within each well is indicated above the gel image. The strand of each construct used in this EMSA is denoted as either (+) for the sense strand or (−) for the antisense strand. Each construct was run on a gel in either the unfolded (H2O) or folded (KCl)[250 mM] state as indicated above the image. (C) Cartoon depiction of positions of deletion constructs within the EXOC3 5′ Half promoter sequence identified in B. (D) Gel images generated identically to those in panel (B). (E) Cartoon depiction of positions of deletion constructs within the EXOC3 −1592 to −1010 promoter sequence identified in panel (D). (F) Gel images generated identically to those in panel (B). Arrows denote gel shifts observed when a promoter sequence and the Chr5 LG4 are folded together. See Supplementary Figure S3 for detailed EMSA quantifications.
Figure 5.
Figure 5.
Direct interactions between EP400 and ZNF84 promoters and the Chr12 LG4 enhancer. (A) Illustration of an insulated neighborhood within Chr12q24.33 which contains an LG4 located at Chr12:132686134:132690031. The LG4 is shown as a cartoon G4 structure labeled 132.68Mb LG4. Arrows originating at the LG4 and terminating at various promoters denote GeneHancer annotated promoter regulations (GH12J132686). Protein coding genes and their orientation as annotated in Ensembl (25) are indicated as arrows below the line segment representing the genomic region. (B) Images of 1.5% agarose Tris-glycine gels ran at 4°C for 8 h at 75 V and then stained for 24 h with SYBR Gold examining EP400 (left), ZNF84 (middle) and GOLGA3 (right) promoters are shown. Each construct was run on a gel in either the unfolded (H2O) or folded (KCl)[250 mM] state as indicated above the image. Samples including more than one construct were folded together. Arrows denote gel shifts observed when a promoter and a LG4 are folded together. See Supplementary Figure S3 for detailed EMSA quantifications.
Figure 6.
Figure 6.
EMSA gel shifts involve G4 structures. (A) EMSA examining gel shifts formed by folding the + strand of the EXOC3 promoter and the − strand of the Chr5 LG4 together in [50–200 mM] KCl and LiCl solutions; 1.5% agarose Tris-glycine gel ran at 4°C for 8 h at 75 V and then stained for 24 h with SYBR Gold. (B) EMSA examining gel shifts formed by folding the + strand of the EXOC3 promoter and the − strand of the Chr5 LG4 together. Gels were stained with SYBR Gold to detect total DNA and NMM to detect G4 structures. (C) Dot blot of DNA isolated from the corresponding EMSA bands probed with the G4-specific antibody BG4. Dot blots of excised DNA are shown immediately to the right of their corresponding EMSA bands. Dot blot images are representative of triplicate experiments. (D) BG4 Dot blot using EMSA-isolated DNA corresponding to ZNF84 + Chr12LG4- folded in either H2O (left well) or KCl (top band in right lane). Dot blots of excised DNA are shown to the right of their corresponding EMSA bands.
Figure 7.
Figure 7.
Chr5 LG4 presence increases EXOC3 promoter activity in cultured cells. Luminescence was quantified and normalized to control reporter cotransfections. Resulting ratios were plotted using GraphPad Prism software. Unpaired two-tailed t-test with Welsh’s correction was performed to determine significance. (A) Chr5 LG4 presence increases EXOC3 promoter activity. A549 cells were cotransfected with 50 ng of reporter plasmid (EXOC3 or HIF1a) and 50 ng of enhancer containing plasmid (Chr5 LG4 or SV40 in both orientations). (B) Luciferase assay stratified by enhancer orientation. Stratification of data displayed in (A) based on the orientation of the enhancer in TOPO pCR2.1. Transfection with sense LG4 was normalized to average RLU of transfections with sense SV40 and transfections with antisense LG4 were normalized to the average RLU of transfections with antisense SV40. *P < 0.0001. (C) A549 cells were transfected with 50 ng of reporter plasmid (pGL4-EXOC3-LG4, pGL4-HIF1a-LG4, pGL4-EXOC3-SV40 or pGL4-HIF1a-SV40) and LG4 RLU normalized to SV40 RLU. Resulting ratios were plotted using GraphPad Prism software. (D) A549 cells were transfected with 50 ng of reporter plasmid (pGL4-EXOC3-LG4 or pGL4-EXOC3-SV40) +/− TMPyP4 [100 nM] and RLU normalized to negative control (n = 8). Unpaired two-tailed t-test with welsh’s correction was performed to determine significance. Illustrations of reporter constructs are depicted in Supplementary Figure S5.

References

    1. Razin S.V., Ulianov S.V., Iarovaia O.V.. Enhancer function in the 3D genome. Genes (Basel). 2023; 14:1277. - PMC - PubMed
    1. Furlong E.E.M., Levine M.. Developmental enhancers and chromosome topology. Science. 2018; 361:1341–1345. - PMC - PubMed
    1. Ptashne M. Gene regulation by proteins acting nearby and at a distance. Nature. 1986; 322:697–701. - PubMed
    1. Dekker J., Rippe K., Dekker M., Kleckner N.. Capturing chromosome conformation. Science. 2002; 295:1306–1311. - PubMed
    1. Golov A.K., Gavrilov A.A., Kaplan N., Razin S.. A genome-wide nucleosome-resolution map of promoter-centered interactions in human cells corroborates the enhancer–promoter looping model. eLife. 2023; 12:RP91596. - PMC - PubMed

LinkOut - more resources