. 2025 Mar 6;74(4):586-602.
doi: 10.1136/gutjnl-2024-332535.

Integration of lipidomics with targeted, single cell, and spatial transcriptomics defines an unresolved pro-inflammatory state in colon cancer

Affiliations

Integration of lipidomics with targeted, single cell, and spatial transcriptomics defines an unresolved pro-inflammatory state in colon cancer

Ramani Soundararajan et al. Gut. .

Abstract

Background: Over a century ago, Virchow proposed that cancer represents a chronically inflamed, poorly healing wound. Normal wound healing is represented by a transitory phase of inflammation, followed by a pro-resolution phase, with prostaglandin (PGE2/PGD2)-induced 'lipid class switching' producing inflammation-quenching lipoxins (LXA4, LXB4).

Objective: We explored if lipid dysregulation in colorectal cancers (CRCs) is driven by a failure to resolve inflammation.

Design: We performed liquid chromatography and tandem mass spectrometry (LC-MS/MS) untargeted analysis of 40 human CRC and normal paired samples and targeted, quantitative analysis of 81 human CRC and normal paired samples. We integrated analysis of lipidomics, quantitative reverse transcription-PCR, large scale gene expression, and spatial transcriptomics with public scRNASEQ data to characterize pattern, expression and cellular localisation of genes that produce and modify lipid mediators.

Results: Targeted, quantitative LC-MS/MS demonstrated a marked imbalance of pro-inflammatory mediators, with a dearth of resolving lipid mediators. In tumours, we observed prominent over-expression of arachidonic acid derivatives, the genes encoding their synthetic enzymes and receptors, but poor expression of genes producing pro-resolving synthetic enzymes and resultant lipoxins (LXA4, LXB4) and associated receptors. These results indicate that CRC is the product of defective lipid class switching likely related to inadequate or ineffective levels of PGE2/PGD2.

Conclusion: We show that the lipidomic profile of CRC tumours exhibits a distinct pro-inflammatory bias with a deficiency of endogenous resolving mediators secondary to defective lipid class switching. These observations pave the way for 'resolution medicine', a novel therapeutic approach for inducing or providing resolvins to mitigate the chronic inflammation driving cancer growth and progression.

Keywords: COLORECTAL CANCER; EICOSANOIDS; GENE EXPRESSION; INFLAMMATION; LIPID METABOLISM.


Conflict of interest statement

Competing interests: None declared.

Figures

Figure 1
Figure 1. Non-targeted shotgun lipidomic analysis identifies upregulation of linolenic acid and arachidonic acid enriched structural and bioactive lipids in colon tumours. (A) Orthogonal partial least square analysis of colon tumours (n=40) and matched normal mucosa (n=40) reveals two distinct and tight clusters of tumours and normal controls cleanly separated from each other. The calculated Q2 and R1 values represent the predictability and goodness of fit, R2X (p1=0.092, o1=0.298), R2Y (p1=0.407, o1=0.131), Q (p1=0.321, o1=0.123). (B) Volcano plot depicts the upregulated and the downregulated lipid mediators in normal and tumour samples. The p value is shown on the y-axis and the log2 fold change is shown on the x-axis. P<0.05 versus normal controls. (C) Heatmap of linoleic acid/arachidonic acid enriched phospholipids (Phosphatidylethanolamine, phosphatidylinositol, phosphoglyceride and phosphatidylserine) in colon tumours (T, n=40) and matched normal mucosa (N, n=40). The Student’s t-test was performed using GraphPad V.10 software. P<0.05 versus normal controls. (D) A significant increase in myristic acid bearing sphingomyelin/phosphatidylcholines (SM (d18:1/14:0), PC (14:0/16:0)) in tumours relative to matched normal controls. The relative amount of the lipid mediator is expressed as log10 (concentration) in ng/mg of tissue. Data were expressed as a scatter dot plot. The Student’s t-test was performed using GraphPad Prism V.10. P<0.05 versus normal controls.
Figure 2
Figure 2. Quantitative targeted lipid analysis shows a significant bias towards pro-inflammatory lipid mediators in colon tumours versus normal matched mucosa. (A) Quantitative LC–MS/MS analysis of targeted lipids in colon tumours and matched normal mucosa controls (n=81 per group) is visualised as a heat map generated using the R program. The fatty acid substrates, arachidonic acid (AA), eicosapentaenoic acid (EPA), docosahexaenoic acid (DHA) and adrenic acid; pro-inflammatory lipid mediators of ALOX5 pathway (HETEs and leukotrienes) and COX pathway (prostaglandins and thromboxanes) are shown in the heatmap. The pro-resolving lipoxins (LXA4) and (LXB4) are also listed. Lipid mediators that were also tested included the EETs, HEPEs and the HODEs. There is a significant increase in pro-inflammatory lipid mediators including 5-HETE and leukotrienes (LTB4, LTC4, LTD4 and LTE4) in tumours versus controls. Conversely, prostaglandins (PGD2 and PGE2) show a significant decrease in tumours relative to normal controls. (B–F, I–L) Quantitative LC–MS/MS analysis of targeted lipid mediators (pro-inflammatory and pro-resolution) was performed using colon tumours and matched normal controls (n=81 per group). (B) 5-HETE, (C) LTB4, (D) LTC4, (E) LTD4 and (F) LTE4, known pro-inflammatory mediators, are significantly increased in tumours relative to matched normal controls. P<0.0001 and p<0.01 relative to matched normal controls. (G) LC–MS/MS analysis of LTB4 reveals distinct ionic species. (H) The LTB4 structure is shown and the charge to mass ratio (m/z) of the ionic species is listed. (I) 11-HEPE is decreased in tumours versus normal controls. P=0.0045 relative to matched normal controls. (J–L) The other pro-resolution mediators 18-HEPE (p=0.1109), LXA4 (p=0.6574) and LXB4 (0.14) levels remain unchanged in tumours versus matched controls. The data was logarithmically transformed to the base 10. The y-axis represents the tumour values subtracted from their matched normal controls for each of the lipid mediators in our study. The individual values are shown above and below the median. The quantity of lipid mediators was expressed as log10 (pg/50 mg of tissue). The data were analysed statistically using paired two-tailed t-test, Wilcoxon rank sum analysis (GraphPad Prism V.10).
Figure 3
Figure 3. Upregulation of genes producing LTB4 and its receptor LTB4R and immune cell markers in the myeloid compartment (CCR2 and CCL2) supports the presence of an inflammatory milieu in the colorectal cancer tumour microenvironment. (A) qRT-PCR analysis revealed a significant increase in ALOX5 mRNA in tumour versus matched normal controls (n=80 per group, ****p<0.00001). (B) ALOX5AP mRNA levels were significantly upregulated in tumours relative to the matched normal controls (n=77 per group, **p<0.01). (C) There was an upregulation of LTA4H transcript in tumours when compared with matched normal controls ((n=60, *p<0.05). (D) LTB4R mRNA was significantly increased in tumours relative to matched normal control (n=78 per group, ***p<0.001). (A–D) For these comparisons, the data is expressed as mean±SEM and graphed as a vertical scatter plot, GraphPad Prism V.10, two-tailed paired Student’s t-test. (E–H, M–P) Top cluster view of transcripts expressed as log2 in various cell types based on analysis of colon cancer single cell RNA-seq data (n=62). (E) ALOX5 was expressed mainly in macrophages, mast cells, immune B cells, epithelial tumour cells, stroma and plasma cells. (F) ALOX5AP expression mirrored ALOX5 and in addition it is also remarkably expressed in immune T cells. (G) LTA4H was present in many cell types including epithelial tumour cells. (H) LTB4R was most restricted in expression and primarily expressed in myeloid cells, tumour cells and immune T cells. (I) LTC4S was downregulated in tumour relative to matched normal controls (n=15 per group, *p<0.05). (J) CCR2, a recruitment receptor for macrophages is upregulated in tumour versus matched normal controls (n=78, **p<0.01). (K) CCL2, the chemokine ligand for CCR2 was unchanged in tumours versus matched controls (n=78 per group, p=0.0731). (L) TGFβ is markedly upregulated in tumours (n=61 per group, p<0.0001). (I–L) For these comparisons, the data was expressed as mean±SEM and graphed as a vertical scatter plot. GraphPad Prism V.10, two-tailed paired t-test. (M) LTC4S was mainly expressed in mast cells and at an average level in all other cellular compartments. (N) CCR2 was expressed primarily in myeloid cells, plasma cells and T cells. (O) CCL2 was expressed in myeloid cells and stromal cells. (P) TGFβ was ubiquitously expressed in most cell types other than normal epithelial cells. (Q) A schematic of top cluster view of different cell types from single-cell colon RNA-seq portal.
Figure 4
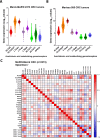
Figure 4. Increased expression of enzymes synthesising pro-inflammatory lipid mediators ALOX5 in the microarray datasets of human colorectal cancer (CRC) tumours. The Affymetrix gene expression of representative arachidonic acid metabolising enzymes/receptors in (A) Merck-Moffitt 2373 CRC tumours and (B) Marisa 585 CRC tumours is shown. (C) Spearman correlation of the gene expression of lipid metabolising enzymes/receptors with genes measuring inflammatory signalling and EMT as well as the CMS1-4* scores Merck-Moffitt 2373 CRC tumours. Of note, genes linked to arachidonic acid lipid production (PLA2G4A and TNF), genes related to pro-inflammatory mediators (ALOX5, ALOX5AP, LTA4H, LTC4S) and their receptors (LTB4R, CYSLTR1, CYSLTR2) all appear to be coordinately expressed along with the inflammatory biomarkers (TGFB1, NFKB1, NFKB2) and associated macrophage markers (CCL2, CCR2) in colon tumours. TGFB gene expression is strongly linked to EMT, with relative overexpression of vimentin and under expression of CDH1. Notably, genes linked to lipid class switching (ALOX12, ALOX15, IL4, IL13, EPHX1) were poorly expressed in colon tumours. Finally, the pro-inflammatory milieu is present in CMS1 and CMS4. CMS1*, CMS2*, CMS3* and CMS4* scores are designated to measure the propensity of a tumour to fall into CMS1 (immune activated), CMS2 (immune desert), CMS3 (immune excluded) and CMS4 (immune inflamed) classes, respectively. These analyses were performed using GraphPad Prism V.10.
Figure 5
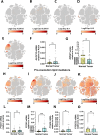
Figure 5. The low levels of prostaglandins (PGD2 and PGE2) and decreased expression of pro-resolution lipid mediators suggest defective class switching in colon tumours. (A–E) scRNA-seq analysis reveals that genes associated with lipid class switching (ALOX12, ALOX15, IL4, IL13) except EPHX1 are poorly expressed in colon tumours. EPHX1 was present exclusively in the macrophages (myeloid compartment). (F) The ALOX15 transcript was weakly expressed by quantitative reverse transcription-PCR and did not show any quantitative difference among colon tumour and matched normal controls (n=42 per group). (G) Interestingly, EPHX1 mRNA was significantly downregulated in colon tumours versus matched normal controls (n=55 per group, *p<0.05). (H–K) COX pathway genes, PTGS1 and PTGS2, that are linked to the synthesis of PGG2/PGH2, precursors for PGE2/PGD2 synthesis, are expressed predominantly in myeloid cells and mast cells, whereas prostaglandin E synthase (PTGES) was weakly expressed in epithelial cells while PTGES2 was ubiquitously expressed in all the sampled cells. (L, M) PTGS1 was poorly expressed in tumour and normal samples (n=46 per group), but PTGS2 was, in fact, moderately overexpressed in tumour versus normal samples (n=46 per group, **p<0.01). (N, O) PGE2 synthesising genes, PTGES (n=43 per group) and PTGES2 (n=16 per group), were weakly expressed in both normal and tumour samples with PTGES showing some modest increased expression in tumour samples versus matched normal controls (*p<0.05).
Figure 6
Figure 6. Analysis of the Cancer Genome Atlas database (TCGA) reveals a significant decrease in transcripts encoding PGE2 receptors in colon tumours. Paired and unpaired analysis of (A–C) PTGER1, (D–F) PTGER2, (G–I) PTGER3 and (J–L) PTGER4 transcripts in tumour and matched normal controls. For paired samples (n=39 per group), the y-axis represents transcript per million (TPM) and is expressed as median. Unpaired data (n=39 normal and n=144 tumour) is expressed as mean±SEM. Statistical analysis was performed using GraphPad Prism V.10. Paired or unpaired two-tailed t-test and Wilcoxon rank sum analysis were performed. *p<0.05 and ****p<0.00001 versus normal mucosa controls.
Figure 7
Figure 7. Quantitative LC–MS/MS analysis reveals low levels of PGD2/PGE2 indicative of a defective lipid class switching in colorectal cancer tumours. (A–C) LC–MS/MS analysis of prostaglandins in tumour and matched normal controls. (A) PGD2 levels in colon tumours showed a significant decrease relative to the matched normal controls (n=76 per group, p=0.028). (B) PGE2 levels also showed a significant decrease in colon tumours relative to matched normal controls (n=81 per group, p=0.0444). (C) PGF2a levels remained unchanged in colon tumours versus matched normal mucosa controls (n=82 per group, p=0.0796). The quantity of lipid mediators was expressed as log10 (pg/50 mg of tissue). The y-axis represents the tumour values subtracted from their matched normal controls for each of the lipid mediators in our study. The individual values are shown above and below the median. The data was analysed statistically using GraphPad Prism V.10 and expressed as mean±SEM. Paired two-tailed t-test, Wilcoxon rank sum analysis. (D) Prostaglandin D synthase (PTGDS) expression was extremely low in all the cellular compartments as determined by scRNA seq data. (E) The HPGD encoding the key enzyme responsible for PGE2 degradation is ubiquitously expressed. (F) HPGD mRNA, as measured by quantitative reverse transcription-PCR, was significantly downregulated in colon tumours relative to matched normal controls (n=14 per group, *p<0.05). (G) Top cluster view of transcripts expressed as log2 in various cell types based on single cell RNA-seq data from colon tumours (n=62).
Figure 8
Figure 8. Spatial transcriptomics analysis reveals a relative increase in expression of pro-inflammatory genes linked to LTB4 synthesis in tumours with higher LTB4 levels. H&E-stained images, mapped gene clusters, coexpression of ALOX5/ALOX5AP genes in various clusters of low LTB4 (A–T) and high LTB4 colon tumours (P–AQ). (AR) Quantitative analysis of ALOX5, (AS) ALOX5AP and (AT) ALOX5+ALOX5AP show a significant increase in ALOX5AP and ALOX5+ALOX5AP expression in high LTB4 versus low LTB4 producing colon tumours. Paired two-tailed t-test with Wilcoxon rank sum analysis was performed using GraphPad Prism V.10. N=4 low LTB4 and n=4 high LTB4 tumours were used for the spatial transcriptomics analysis.
Figure 9
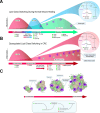
Figure 9. Proposed new colorectal cancer (CRC) harmonised model linking tumour-derived arachidonic acid (AA) to dysregulated lipid class switching, diminished efferocytosis, chronic inflammation, immunosuppression and tumour growth. (A) Normal wound healing is characterised by initial phase of inflammation with a subsequent resolution that is secondary to lipid class switching and efferocytosis of dying neutrophils. (B) Dysregulated lipid class switching in CRC is linked to low PGE2 levels resulting in a failure to produce the pro-resolution lipoxins. (C) Apoptotic tumour cells release excessive AA that fuels chronic inflammation, diminished efferocytosis, immunosuppression and tumour growth.

References

    1. Siegel RL, Miller KD, Jemal A. Cancer statistics, 2020. CA Cancer J Clin. 2020;70:7–30. doi: 10.3322/caac.21590. - DOI - PubMed
    1. Siegel RL, Miller KD, Goding Sauer A, et al. Colorectal cancer statistics, 2020. CA Cancer J Clin. 2020;70:145–64. doi: 10.3322/caac.21601. - DOI - PubMed
    1. Xi Y, Xu P. Global colorectal cancer burden in 2020 and projections to 2040. Transl Oncol. 2021;14:101174. doi: 10.1016/j.tranon.2021.101174. - DOI - PMC - PubMed
    1. Cercek A, Diaz LA., Jr PD-1 Blockade in Mismatch Repair-Deficient Rectal Cancer. Reply. N Engl J Med. 2022;387:855–6. doi: 10.1056/NEJMc2209706. - DOI - PubMed
    1. Sun H, Zhang L, Wang Z, et al. Single-cell transcriptome analysis indicates fatty acid metabolism-mediated metastasis and immunosuppression in male breast cancer. Nat Commun. 2023;14:5590. doi: 10.1038/s41467-023-41318-2. - DOI - PMC - PubMed

LinkOut - more resources