. 2024 Dec 10;15(1):10622.
doi: 10.1038/s41467-024-54051-1.

Photosynthetic directed endosymbiosis to investigate the role of bioenergetics in chloroplast function and evolution

Affiliations

Photosynthetic directed endosymbiosis to investigate the role of bioenergetics in chloroplast function and evolution

Bidhan Chandra De et al. Nat Commun. .

Abstract

Cyanobacterial photosynthesis (to produce ATP and NADPH) might have played a pivotal role in the endosymbiotic evolution to chloroplast. However, rather than meeting the ATP requirements of the host cell, the modern-day land plant chloroplasts are suggested to utilize photosynthesized ATP predominantly for carbon assimilation. This is further highlighted by the fact that the plastidic ADP/ATP carrier translocases from land plants preferentially import ATP. Here, we investigate the preferences of plastidic ADP/ATP carrier translocases from key lineages of photosynthetic eukaryotes including red algae, glaucophytes, and land plants. Particularly, we observe that the cyanobacterial endosymbionts expressing plastidic ADP/ATP carrier translocases from red algae and glaucophyte are able to export ATP and support ATP dependent endosymbiosis, whereas those expressing ADP/ATP carrier translocases from land plants preferentially import ATP and are unable to support ATP dependent endosymbiosis. These data are consistent with a scenario where the ancestral plastids may have exported ATP to support the bioenergetic functions of the host cell.


Conflict of interest statement

Competing interests: Authors declare that they have no competing interests.

Figures

Fig. 1
Fig. 1. An approach to study the properties of plastidic ADP/ATP carrier translocases.
A In-silico analysis and bioinformatic identification of plastidic ADP/ATP carrier translocase proteins from key lineages of photosynthetic eukaryotes. B Engineering cyanobacteria, Synechococcus elongatus PCC7942 (Syn7942), for recombinant expression of bioinformatically identification of plastidic ADP/ATP carrier translocase proteins. C ATP-dependent directed endosymbiosis between yeast mutants and cyanobacterial mutants expressing plastidic ADP/ATP carrier translocases.
Fig. 2
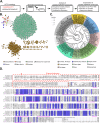
Fig. 2. Bioinformatic analysis and identification of plastidic ADP/ATP carrier translocases.
A The general workflow for identification and characterization of plastidic ADP/ATP carrier translocases. B Sequence similarity network (SSN) for ADP/ATP carrier translocase proteins found across the photosynthetic eukaryotes; the SSN is analyzed using an alignment score 120. The NTT proteins from Endosymbionts (Brown), and the ADP/ATP carrier translocase proteins from red algae (Red), diatoms (blue), microalgae/green algae (light green), higher plants (teal), the selected sequence from the SSN were presented rhombus border. C A smaller data set phylogenetic analysis of putative primary plastid ADP/ATP carrier translocase family proteins from archea to higher plant (see Results and Methods section). D Amino acid sequence alignment of selected NTT homologous and orthologs of putative plastidic ADP/ATP carrier translocase family protein from red algae and higher plant. The multiple sequence alignment was performed using Clustal Omega (https://www.ebi.ac.uk/Tools/msa/clustalo/) and data was presented using jalview software. Colored boxes indicate conserved amino acid residues among NTT and putative plastidic ADP/ATP carrier translocase family proteins from red algae and higher plant (100%: fore black, back blue; 80%–60%: fore black, back light blue). The pink dot represent amino acid query sequence: CAE46506.1; the Green dot amino acid sequence of plastidic putative ADP/ATP carrier protein (Cyanidioschyzon merolae strain 10D) NCBI id: XP_005536231.1 and its corresponding PDB id: M1V528; the dotted red rectangular box represented the N-terminal extension of putative plastidic ADP/ATP carrier translocase family proteins from red algae, glaucophyte and higher plant; the red star represented plastidic signal peptide conserved phenylalanine (F) essential organelle targeting; the pink underline represented the predicted twelve transmembrane domain for plastidic putative ADP/ATP carrier protein (C. merolae strain 10D) PDB id: M1V528. Source data are provided as a Source Data file.
Fig. 3
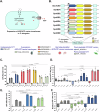
Fig. 3. Cyanobacterial cell-based assays to study the properties of ADP/ATP carrier translocases.
A Syn7942 mutants expressing bioinformatically identification of plastidic ADP/ATP carrier translocase proteins are used for ATP export/import assays. B Description of genetic recombination at the neutral site II (NS2) in the Syn7942 genome to afford engineered SynJEC3, SynBD1-8 strains (also see Table 1). The genomic DNA PCR analysis of mutant strains is shown in Supplementary Fig. 5. The color code neutral site II (NS2) in light gray box; endoparasite nucleotide transporter CAE46506.1 gene in dark blue; red algal plastidic genes: XP_005536231.1 gene in red, KAF6002099.1 gene in light pink, PXF48205.1 gene in orange, XP005707402.1 gene in pattern red; plant plastidic nucleotide transporter NP_178146.1 gene in pattern light green, TRINITY_DN12309 gene in light green, plant plastidic mitochondrial family NC_003076.8 gene in light blue; constitutive trc promoter in yellow bend arrow; genes encodind SNARE-like proteins C.tr.-incA in yellow and CT_813 in brown. C ATP export was measured by luciferase assay. The Syn7942 (wild-type), engineered SynJEC3, SynBD1 to 5 cell counts were normalized. The cells were saturated with 80 µM ATP followed by wash and 80 µM ADP addition. Extracellular ATP was measured before ADP addition and after ADP addition (5 and 10 min). D Residual ATP titer was measured by luciferase assay. The Syn7942 (wild-type), SynJEC3, SynBD2 and SynBD6 cell counts were normalized. The cells were incubated with 50 nM ATP and the residual ATP was measured at various time points. E ATP export for measured for Syn7942 (wild-type), SynJEC3, SynBD8 as described previously. F Residual ATP titer was measured for Syn7942 (wild-type), SynJEC3, SynBD8 as described previously. The color code bar for Syn7942 in gray bar, SynJEC3 blue bar, SynBD1 in red, SynBD2 light pink, SynBD3 light brown, SynBD4 pattern brown, SynBD5 pattern green, SynBD6 in light blue bar and SynBD8 in light green bar. All assays were performed in triplicate (n = 3 technical replicates; data are presented as mean values +/− SEM). P-values were calculated by two-tailed t-test comparing the two means. Source data are provided as a Source Data file.
Fig. 4
Fig. 4. Directed endosymbiosis.
A Schematic representation of ATP dependent directed endosymbiosis. B Spot growth of yeast/cyanobacteria chimeras for multiple rounds on selection conditions. C Genomic DNA PCR to detect yeast MAT allele and CAT gene for engineered cyanobacterial mutants. M is for DNA ladder, MAT allele amplification from round 2 to 6 were shown at lane 1: control host yeast, lane 2 to 4: S. cerevisiae cox 2-60-SynJEC3, BD2 and BD3. CAT gene amplification shown at lane 6: control host yeast (No CAT gene were amplified for host control yeast cells); S. cerevisiae cox 2-60-SynJEC3 (no CAT gene amplification from round 5 onward represents absence of synJEC3), S. cerevisiae cox 2-60-SynBD2 and BD3 can be seen till round 6. D Cell count analysis from round 2 to round 6 cell propagation. The bar graph was presented as Control: yeast cells; 2-6a represents S. cerevisiae cox 2-60-SynJEC3 cell counts from second round to round five. 2-6b S. cerevisiae cox 2-60-SynBD2 cell counts from second round to round six; and 2-6c represents S. cerevisiae cox 2-60-SynBD3 cell counts from second round to round six. Data represents the mean of three independent experiments. Error bars are displayed. E An approximate viability of yeast/cyanobacteria chimeras was calculated based on chimera cells count and doubling. All Cell counts were performed in triplicate (n = 3 biological replicates; data are presented as mean values +/− SEM). (n = 3 biological replicates; data are presented as mean values +/− SEM). Error bars are displayed. Two-sided t-tests were used to compare means without adjustments. Source data are provided as a Source Data file.
Fig. 5
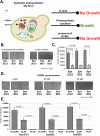
Fig. 5. Dependence of yeast/cyanobacteria chimeras on photosynthesis.
A Schematic representation to study the growth dependence on yeast/cyanobacteria chimeras on photosynthesis. B Spot growth of yeast/cyanobacteria chimeras for multiple rounds under photosynthetic selection conditions or in absence of light (dark conditions). The experiment was repeated three times independently with similar results. C The bar diagram presenting the chimeras growth, and their cell count after 72 hours. Error bars are displayed. D Growth of round 3 Yeast S. cerevisiae cox 2-60-SynJEC3, S. cerevisiae cox 2-60-SynBD2, S. cerevisiae cox 2-60-SynBD3 chimeras on Selection Medium III in presence of DCMU, final concentration 0 µM or 20 µM or 40 µM. 10,000 cells were propagated in each spot followed by incubation for 72 hours under photosynthetic day/night cycle. The experiment was repeated three times independently with similar results. E The bar diagram presenting the chimeras growth, and their cell count after 72 hours of incubation in presence of DCMU with photosynthetic day/night. All Cell counts were performed in triplicate (n = 3 biological replicates; data are presented as mean values + /− SEM). Error bars are displayed. Two-sided t-tests were used to compare means without adjustments. Source data are provided as a Source Data file.
Fig. 6
Fig. 6. Imaging studies of the yeast/cyanobacteria chimeras.
Bright field microscopic image corresponding to pTERF image showing control S. cerevisiae cox 2-60, and chimeras S. cerevisiae cox2-60-SynJEC3, S. cerevisiae cox2-60-SynBD2, S. cerevisiae cox2-60-SynBD3 and S. cerevisiae cox2-60-SynBD8. Marged image of bright field chimeric cells (at gray) and pTIRF (X100) microscopic images can be predicted using 561 nm laser for visualization of endosymbiont autofluorescence chlorophyl (in red Em.=653/95 nm) from photosynthetically enabled engineered Syn. No such signal was detected from control yeast cells. SP8 Fluorescent confocal microscopic (x63) image of control S. cerevisiae cox 2–60, and endosymbiontic chimera. Marged images: host cell was stained using Conn A-FITC (emission at 510–520 nm wavelength, in green) and cyanobacterial autofluorescence can detected at 616-650 nm wavelength range. The experiment was repeated three times independently with similar results.

References

    1. Mereschkowsky, C. Uber natur und ursprung der chromatophoren im pflanzenreiche. Biologisches Centralblatt25, 293–604 (1905).
    1. Margulis, L. Origin of Eukaryotic Cells: Evidence and Research Implications for a Theory of the Origin and Evolution of Microbial, Plant and Animal Cells on the Precambrian Earth. (Yale University Press, 1970).
    1. Zimorski, V., Ku, C., Martin, W. F. & Gould, S. B. Endosymbiotic theory for organelle origins. Curr. Opin. Microbiol.22, 38–48 (2014). - PubMed
    1. Jensen, P. E. & Leister, D. Chloroplast evolution, structure and functions. F1000prime reports vol. 6 (2014). - PMC - PubMed
    1. Martin, W. & Kowallik, K. V. Annotated english translation of Mereschkowsky’s 1905 paper ‘über natur und ursprung der chromatophoren im pflanzenreiche’. Eur. J. Phycol.34, 287–295 (1999).

Publication types

MeSH terms

Substances

LinkOut - more resources