. 2024 Dec 10;4(1):262.
doi: 10.1038/s43856-024-00690-w.

Blood-based quantification of Aβ oligomers indicates impaired clearance from brain in ApoE ε4 positive subjects

Affiliations

Blood-based quantification of Aβ oligomers indicates impaired clearance from brain in ApoE ε4 positive subjects

Lara Blömeke et al. Commun Med (Lond). .

Abstract

Background: Quantification of Amyloid beta (Aβ) oligomers in plasma enables early diagnosis of Alzheimer's Disease (AD) and improves our understanding of underlying pathologies. However, quantification necessitates an extremely sensitive and selective technology because of very low Aβ oligomer concentrations and possible interference from matrix components.

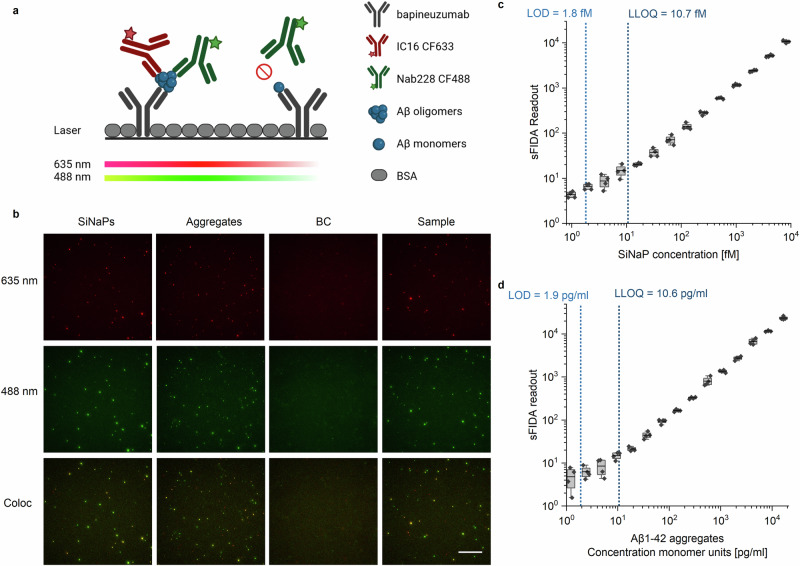
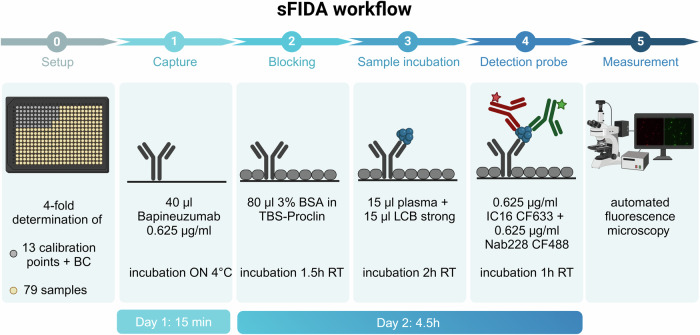
Methods: In this report, we developed and validated a surface-based fluorescence distribution analysis (sFIDA) assay for quantification of Aβ oligomers in plasma.

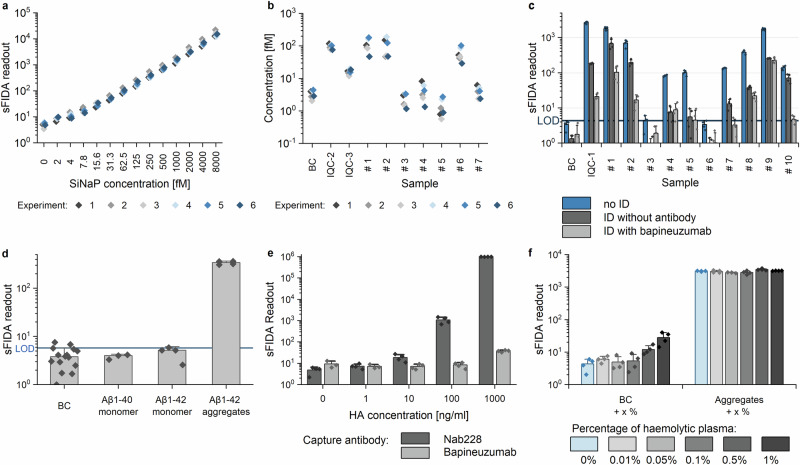
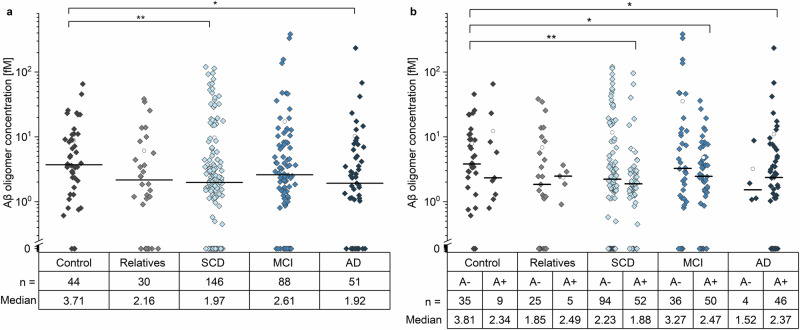
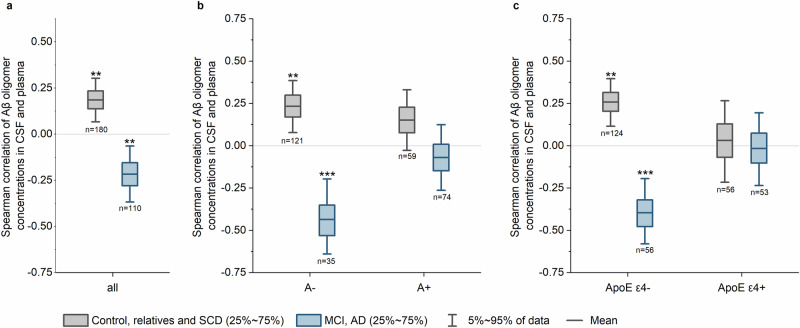
Results: The blood-based sFIDA assay delivers a sensitivity of 1.8 fM, an inter- and intra-assay variation below 20% for oligomer calibration standards and no interference with matrix components. Quantification of Aβ oligomers in 359 plasma samples from the DELCODE cohort reveals lower oligomer concentrations in subjective cognitive decline and AD patients than healthy Control participants.

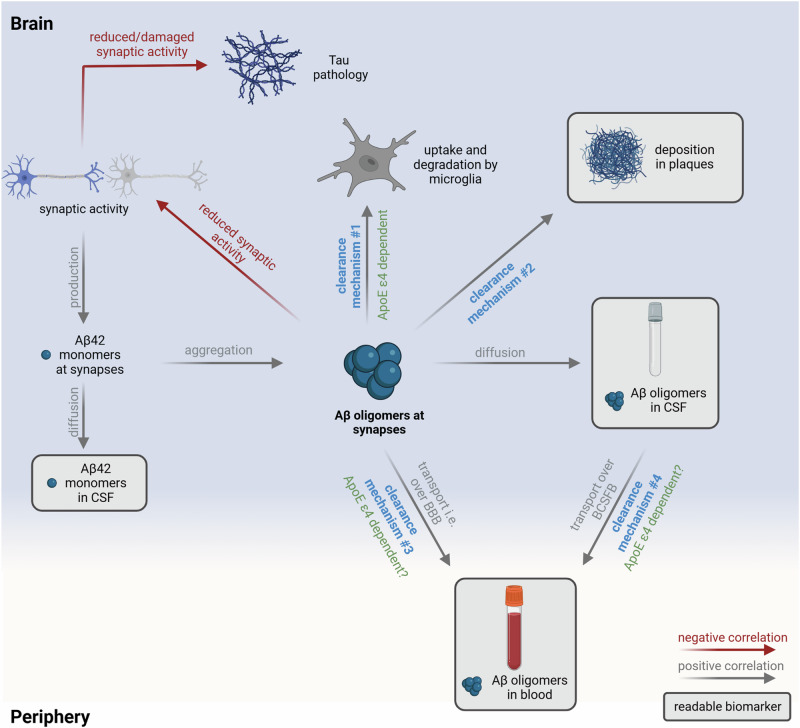
Conclusions: Correlation analysis between CSF and plasma oligomer concentrations indicates an impaired clearance of Aβ oligomers that is dependent on the ApoE ε4 status.

Plain language summary

People with Alzheimer’s disease have difficulties with reasoning and communication. In Alzheimer’s disease, small proteins called amyloid beta (Aβ) stick together, forming tiny clusters in the brain that eventually grow larger. In this study, we aimed to measure these clusters in the blood. When we tested our method on blood samples from 359 people, we surprisingly found that people with Alzheimer’s disease and memory problems had fewer clusters of Aβ compared to healthy individuals. Our finding suggests that genetic factors may influence the body’s ability to clear these clusters from the brain.


Conflict of interest statement

Competing interests: D.W. and O.B. are co-founders and shareholders of attyloid GmbH. This affiliation had no influence of the interpretation of the data. All other authors declare no competing interests related to this work.

Figures

Fig. 1
Fig. 1. Principle of sFIDA setup, imaging and calibration.
a The biochemical principle of sFIDA is similar to a sandwich ELISA with capture and detection antibodies directed against overlapping epitopes of the Aβ N-terminus. Therefore, monomers can be captured but not detected as the epitope is already occupied. After preparation, the assay surface is imaged using dual colour fluorescence microscopy (635 and 488 nm, respectively). Created with biorender.com. b Exemplary images of 500 fM SiNaPs coated with Aβ1−15, aggregates composed of 564 pg/ml Aβ1−42, a blank plasma (blank control, BC) and an AD plasma sample for the red (illumination with 635 nm) and green (illumination with 488 nm) fluorescence channels and colocalization. For imaging, the gray-scale value of 14-bit images was adjusted to min and max values of 750 and 7500, respectively. The scale bar is 50 µm. c Calibration curve of 1 fM to 8 pM Aβ1−15 SiNaPs for the colocalization. d Dilution series of Aβ1−42 aggregates consisting of 1.1 to 18,060 pg/ml Aβ1−42 monomers. Boxplots include 25-50% intervals with a line for the mean. Whiskers present 1.5x the interquartile range. Limit of detection (LOD) and lower limit of quantification (LLOQ) were calculated as BC with a single- or ten-fold standard deviation. Standard deviations were calculated across the four replicates. Please note the logarithmic scale.
Fig. 2
Fig. 2. Time course of the sFIDA workflow.
The use of 384 well plates allow a close-meshed concentration series and the determination of 79 patient samples on one plate in 4-fold replicate determination. The individual steps consist of an over night (ON) incubation of the capture antibody at 4 °C, a 1.5 h blocking step following by 2 h incubation of the plasma samples and 1 h incubation of detection antibodies. The final measurement is conducted by an automated fluorescence microscope. Created with BioRender.com.
Fig. 3
Fig. 3. Inter-assay variation and specificity controls for Aβ oligomer quantification in plasma.
a Repeated preparation of SiNaP calibration in six individual experiments showed an inter-assay variation of 19.3%. b Repeated measurements of seven samples of the validation cohort, a blank plasma (BC) and two internal quality controls (IQC, refers to aggregates at 141 pg/ml (IQC-2) and 17.6 pg/ml Aβ1−42 monomers (IQC-3), respectively) were calibrated and mean inter-assay variation was calculated as 41.9%. c A blank control, Aβ1−42 aggregates (IQC-1 with 18 ng/ml Aβ1−42 monomer concentration) and 10 plasma samples of Control, MCI and AD patients were subjected to immunodepletion (ID). Unspecific ID (beads without antibody conjugation) resulted in a signal reduction to 6.9% for IQC-1 and to 20.2% for plasma samples for signals above the LOD (limit of detection). However, with specific immunodepletion using bapineuzumab, the signal of IQC-1 was eliminated (signal <1% compared to the non-depleted sample) and that of the samples was reduced on average to 5.1%. d Blank plasma (BC) was spiked with 452 pg/ml of Aβ1−40, Aβ1−42 monomer and aggregates formed from 452 pg/ml Aβ1−42 monomer. Samples were analysed by sFIDA. e Plasma was spiked with different concentrations of heterophilic antibody (HA) and analysed in two different assay setups, i.e., with monoclonal mouse antibody Nab228 as the capture antibody or with monoclonal humanized antibody bapineuzumab, respectively, to investigate heterophilic antibody interference. f Blank plasma and 18 ng/ml Aβ aggregates (concentration based on the monomer unit concentration) were spiked with haemolytic plasma and the effect on detection of aggregates was analysed. Standard deviations were calculated across the four replicates. Please, note the logarithmic scaling.
Fig. 4
Fig. 4. Concentrations of Aβ oligomers in plasma samples.
a Aβ oligomer concentrations in plasma decreased significantly in SCD and AD patients compared to the Control group (p value SCD: 0.008; AD: 0.017). b After subdivision by amyloid pathology (A, based on CSF Aβ1-42/Aβ1-40 ratio), SCD, MCI and AD patients positive for amyloid pathology (A + ) showed significantly decreased Aβ oligomer concentrations in plasma compared to the amyloid negative (A-) Control group (p value for Control (A-) vs. amyloid positive SCD: 0.002; MCI: 0.041; AD: 0.031). Please note the logarithmic scale. Samples that fell below LOD were set to zero. For reasons of clarity, the median Aβ oligomer concentrations are given for each analysis group below the logarithmically scaled figures (Median; values in fM). Number of samples in each group is referenced as n. SCD subjective cognitive decline, MCI mild cognitive impairment, AD Alzheimer’s disease; open circle: mean; line: median, * p-value of Mann-Whitney-U test 0.01 - 0.05; ** p-value of Mann-Whitney-U test 0.001 - 0.01.
Fig. 5
Fig. 5. Box plots for the bootstrap distribution of the Spearman coefficient of correlation r between Aβ oligomer levels in CSF and plasma.
a The combined group of Controls, relatives and SCD patients (grey) showed a weak, but significant direct correlation of Aβ oligomer levels in CSF and plasma (Spearman r = 0.186, p-value = 0.005), whereas MCI and AD patients (blue) showed an inverse correlation (Spearman r = -0.217, p-value = 0.009). b The groups were sub-divided by the presence of CSF amyloid pathology (A-/A + ) based on the ratio of Aβ1−42/Aβ1−40. c The groups were sub-divided based on their ApoE ε4 status where carrying at least one ApoE ε4 allele defines positivity (ApoE ε4 + ). Only for amyloid negative (A-) or ApoE ε4 negative patients, significant correlations between oligomers in CSF and plasma were observed with the Control, relatives and SCD patients showing a direct correlation (A-: Spearman r = 0.233, p-value = 0.007; ApoE ε4 negative: Spearman r = 0.257, p-value = 0.001) and MCI and AD patients an inverse correlation (A-: Spearman r = -0.436, p-value = <0.001; ApoE ε4 negative: Spearman r = -0.396, p-value = <0.001). Boxplots include 25-50% intervals with a line for the mean. Whiskers present the 5-95% intervals. p-value of Spearman r distribution: * p-value 0.01 ‒ 0.05, ** p-value 0.001 ‒ 0.01, *** p-value < 0.001.
Fig. 6
Fig. 6. Model of the clearance mechanisms for Aβ oligomers and the influence on the use of Aβ oligomers as biomarker.
Aβ monomer production at synapses is dependent on synaptic activity,. At a certain time point, aggregation of Aβ monomers leads to the formation of toxic Aβ oligomers that can be cleared by different mechanisms: Aβ oligomers can be degraded by microglia (clearance mechanism #1), diffuse into CSF or deposited into plaques (clearance mechanism #2). Moreover, Aβ oligomers may be transported to blood either directly across the BBB via glymphatic clearance or interstitial flow (clearance mechanism #3), or after diffusion into CSF and reaching blood via BCSFB (clearance mechanism #4). Formation of plaques in patients with amyloid pathology allows oligomers to be deposited (clearance mechanism #2), which may become the preferred fate of Aβ oligomers. This may lead to reduced clearance to blood and reduced Aβ oligomer concentrations in plasma. Additionally, transport of Aβ oligomers from the brain and CSF to plasma may be inefficient in ApoE ε4 carriers influencing correlation analysis. Created with BioRender.com.

References

    1. Cummings, J. et al. Alzheimer’s disease drug development pipeline: 2022. Alzheimers Dement (N Y 8, e12295 (2022). . - PMC - PubMed
    1. Cline, E. N., Bicca, M. A., Viola, K. L. & Klein, W. L. The Amyloid-β Oligomer Hypothesis: Beginning of the Third Decade. J Alzheimers Dis64, S567–s610 (2018). - PMC - PubMed
    1. Hampel, H. et al. The Amyloid-β Pathway in Alzheimer’s Disease. Molecular Psychiatry26, 5481–5503 (2021). - PMC - PubMed
    1. Mroczko, B., Groblewska, M., Litman-Zawadzka, A., Kornhuber, J. & Lewczuk, P. Amyloid beta oligomers (AbetaOs) in Alzheimer’s disease. J Neural Transm (Vienna)125, 177–191 (2018). - PubMed
    1. Hladky, S. B. & Barrand, M. A. Mechanisms of fluid movement into, through and out of the brain: evaluation of the evidence. Fluids Barriers CNS11, 26 (2014). - PMC - PubMed

LinkOut - more resources