. 2025 Feb;5(2):291-305.
doi: 10.1038/s43587-024-00752-7. Epub 2024 Dec 10.

IL-23R is a senescence-linked circulating and tissue biomarker of aging

Affiliations

IL-23R is a senescence-linked circulating and tissue biomarker of aging

Chase M Carver et al. Nat Aging. 2025 Feb.

Abstract

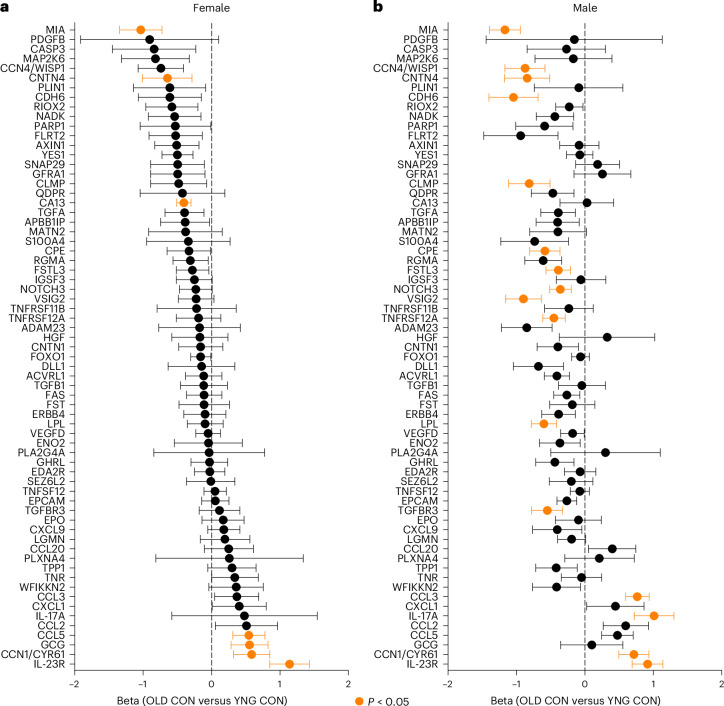
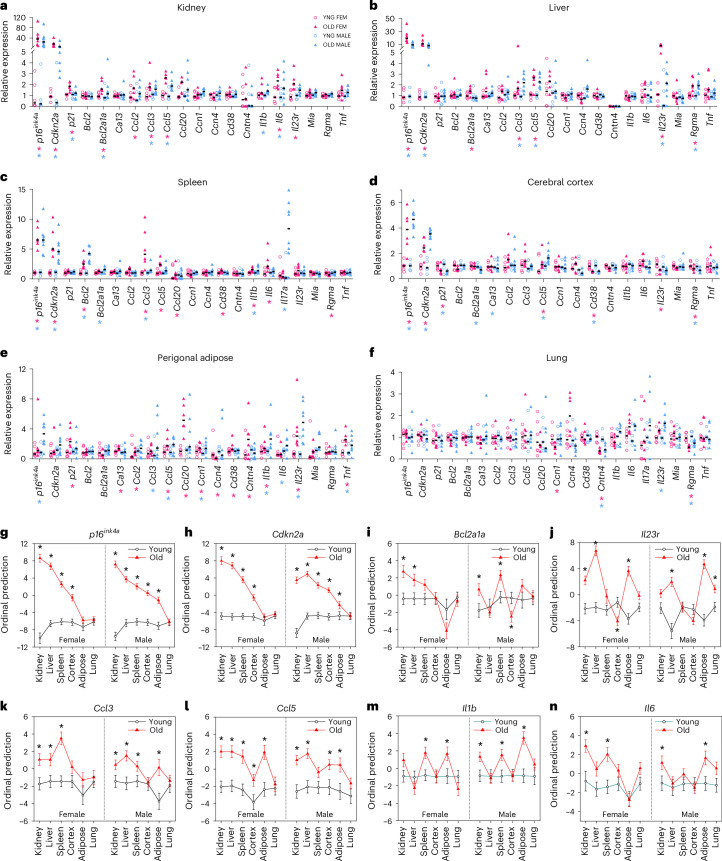
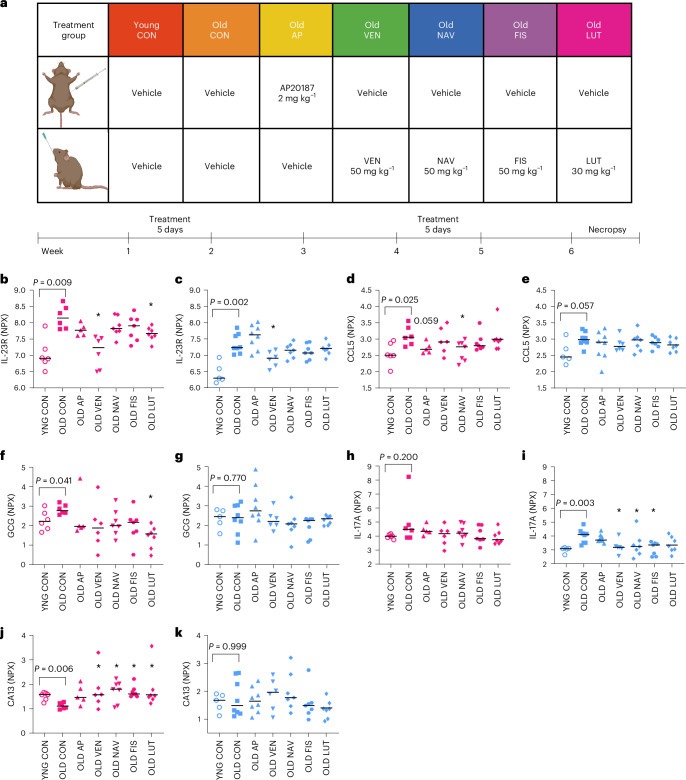
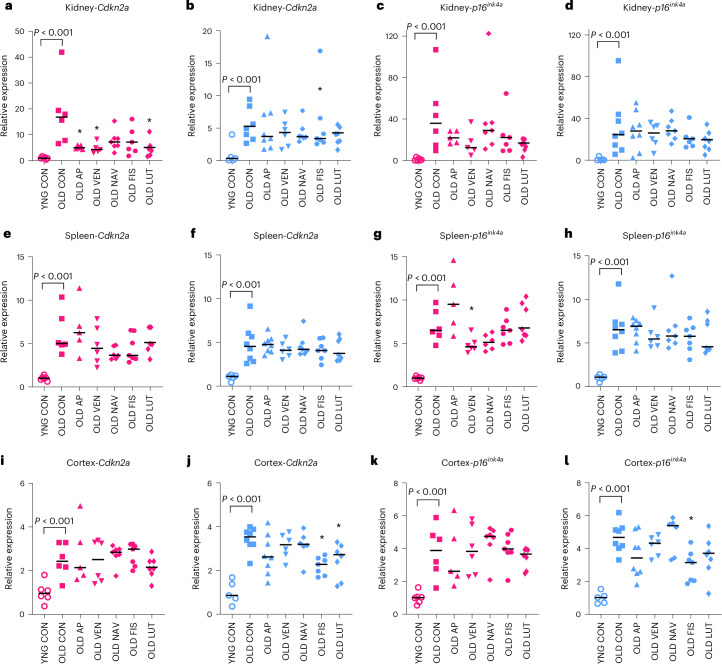
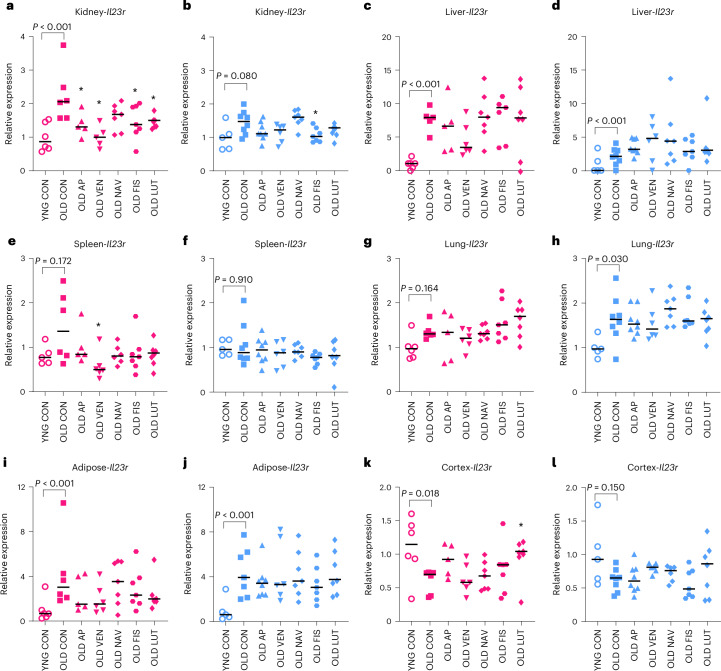
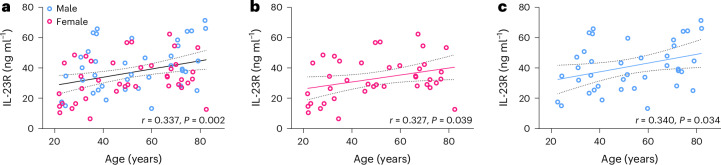
Cellular senescence is an aging mechanism characterized by cell cycle arrest and a senescence-associated secretory phenotype (SASP). Preclinical studies demonstrate that senolytic drugs, which target survival pathways in senescent cells, can counteract age-associated conditions that span several organs. The comparative efficacy of distinct senolytic drugs for modifying aging and senescence biomarkers in vivo has not been demonstrated. Here, we established aging- and senescence-related plasma proteins and tissue transcripts that changed in old versus young female and male mice. We investigated responsivity to acute treatment with venetoclax, navitoclax, fisetin or luteolin versus transgenic senescent cell clearance in aged p16-InkAttac mice. We discovered that age-dependent changes in plasma proteins, including IL-23R, CCL5 and CA13, were reversed by senotherapeutics, which corresponded to expression differences in tissues, particularly in the kidney. In plasma from humans across the lifespan, IL-23R increased with age. Our results reveal circulating factors as candidate mediators of senescence-associated interorgan signal transduction and translationally impactful biomarkers of systemic senescent cell burden.


Conflict of interest statement

Competing interests: M.J.S., C.M.C., A.J.H., E.J.A., N.K.L. and Mayo Clinic have intellectual property related to this research. This research was reviewed by the Mayo Clinic Conflict of Interest Review Board and was conducted in compliance with Mayo Clinic Conflict of Interest policies. D.J.B. has a potential financial interest related to this research. He is a co-inventor on patents held by Mayo Clinic, patent applications licensed to or filed by Unity Biotechnology, and a Unity Biotechnology shareholder. Research in the Baker laboratory has been reviewed by the Mayo Clinic Conflict of Interest Review Board and is being conducted in compliance with Mayo Clinic Conflict of Interest policies. The other authors declare no competing interests.

Figures

Fig. 1
Fig. 1. Conserved and distinct plasma proteins are altered by age in female and male mice.
a,b, Beta estimates corresponding to comparison of old control (OLD CON) versus young control (YNG CON) protein abundance determined by Olink PEAs in female (a) and male (b) plasma samples. Statistically significant differences between OLD CON and YNG CON are highlighted in orange (P < 0.05, two-sided Kruskal–Wallis rank sum test), with negative values indicating a decrease in protein levels in aging, and positive values indicating an increase in protein abundance in aging samples. Datapoints summarize the mean beta estimate and bars summarize the ± standard error. Sample sizes: YNG CON female, n = 6; YNG CON male, n = 5; OLD CON female, n = 6; OLD CON male, n = 8. Source data
Fig. 2
Fig. 2. Senescence- and age-associated genes are expressed across tissues in old female and male p16-InkAttac mice.
af, RT-PCR gene expression values from young female, old female, young male and old male tissues for kidney (a), liver (b), spleen (c), cerebral cortex (d), perigonadal adipose (e) and lung (f). Values are normalized relative to the expression of young control mice of each sex per tissue; black bars indicate median values for each group. gn, Shown are ordinal logistic regression models comparing gene expression from young and old kidney, liver, spleen, cortex, adipose and lung for p16ink4a (g), Cdkn2a (h), Bcl2a1a (i), Il23r (j), Ccl3 (k), Ccl5 (l), Il1b (m) and Il6 (n). Symbols denote the mean ordinal prediction beta estimate ± standard error. *P < 0.05 significance between old and young mice of same sex by two-sided ordinal logistic regression. Samples sizes: young female, n = 6; young male, n = 5; old female, n = 6; old male, n = 8. Source data
Fig. 3
Fig. 3. Age-related changes in plasma proteins are reverted by short-term senotherapeutic interventions.
a, Treatment groups (top) and senotherapeutic treatment timeline (bottom) of young and old mice that received either vehicle or AP20187 (AP) by i.p. injection and either vehicle or one of four senolytic drugs (VEN, NAV, FIS or LUT) by oral gavage. Beginning on week 1, mice were treated once daily for 5 days, followed by 2 weeks without treatment, followed by 5 days of further treatment, followed by 1 week without treatment before necropsy. bk, Plasma protein levels are demonstrated for all biomarkers that differed by age and at least one senolytic intervention significantly reversed the age-related change in at least one sex. This criterion was met for IL-23R (b,c), CCL5 (d,e), GCG (f,g), IL-17A (h,i) and CA13 (j,k). Pink, female groups; blue, male groups. Protein values were measured by Olink PEAs and are reported as NPX. Bars summarize median values. Samples sizes: YNG CON female, n = 6; OLD CON female, n = 6; OLD AP female, n = 5; OLD VEN female, n = 5; OLD NAV female, n = 7; OLD FIS female, n = 7; OLD LUT female, n = 7; YNG CON male, n = 5; OLD CON male, n = 8; OLD AP male, n = 8; OLD VEN male, n = 6; OLD NAV male, n = 7; OLD FIS male, n = 7; OLD LUT male, n = 7. YNG CON versus OLD CON reflect statistics provided in Fig. 1 with exact P values provided. Kruskal–Wallis tests with multiple comparison correction were used for comparison of old treatment groups with OLD CON. We report *P < 0.05. See Methods for additional description of the two-step statistical approach. a, Created with BioRender.com. Source data
Fig. 4
Fig. 4. p16 expression in old p16-InkAttac mice is reduced in a subset of aged tissues in response to short-term transgenic or pharmacological senescent cell targeting.
al, RT-PCR was used to assess Cdk2na (a,b,e,f,i,j) and p16ink4a (c,d,g,h,k,l) gene expression between old control (OLD CON) versus senolytic drug-treated mice, in kidney (ad), spleen (eh), and cortex (il). Values are expression relative to YNG CON per group. Pink, female groups; blue, male groups. Cdkn2a detects both transcript variants 1 (p19arf) and 2 (p16ink4a) (a,b,e,f,i,j) and p16ink4a detects only transcript variant 2 (c,d,g,h,k,l). YNG CON versus OLD CON reflect statistics provided in Fig. 2 with exact P values provided. Kruskal–Wallis tests with multiple comparison correction were used for comparison of old treatment groups with OLD CON. We report two-tailed *P < 0.05. Bars summarize the median group values. Samples sizes: YNG CON female, n = 6; OLD CON female, n = 6; OLD AP female, n = 5; OLD VEN female, n = 5; OLD NAV female, n = 7; OLD FIS female, n = 7; OLD LUT female, n = 7; YNG CON male, n = 5; OLD CON male, n = 8; OLD AP male, n = 8; OLD VEN male, n = 6; OLD NAV male, n = 7; OLD FIS male, n = 7; OLD LUT male, n = 7. Source data
Fig. 5
Fig. 5. Ccl5 gene expression decreases in a subset of aged tissues in response to short-term transgenic or pharmacological senescent cell targeting.
al, Comparison of Ccl5 gene expression measured by RT-PCR between senolytic drug intervention and OLD CON in kidney (a,b), liver (c,d), spleen (e,f), lung (g,h), perigonadal adipose (i,j) and cortex (k,l). Pink, female groups; blue, male groups. YNG CON versus OLD CON reflect statistics provided in Fig. 2 with exact P values provided. Kruskal–Wallis tests with multiple comparison correction were used for comparison of old treatment groups with OLD CON. We report two-tailed *P < 0.05. Bars summarize the median group values. Samples sizes: YNG CON female, n = 6; OLD CON female, n = 6; OLD AP female, n = 5; OLD VEN female, n = 5; OLD NAV female, n = 7; OLD FIS female, n = 7; OLD LUT female, n = 7; YNG CON male, n = 5; OLD CON male, n = 8; OLD AP male, n = 8; OLD VEN male, n = 6; OLD NAV male, n = 7; OLD FIS male, n = 7; OLD LUT male, n = 7.
Fig. 6
Fig. 6. Il23r gene expression is altered in a subset of aged tissues in response to short-term transgenic or pharmacological senescent cell targeting.
al, Comparison of Il23r gene expression measured by RT-PCR between senolytic drug intervention and OLD CON in kidney (a,b), liver (c,d), spleen (e,f), lung (g,h), perigonadal adipose (i,j) and cortex (k,l). Pink, female groups; blue, male groups. YNG CON versus OLD CON reflect statistics provided in Fig. 2 with exact P values provided. Kruskal–Wallis tests with multiple comparison correction were used for comparison of old treatment groups with OLD CON. We report two-tailed *P < 0.05. Bars summarize the median group values. Samples sizes: YNG CON female, n = 6; OLD CON female, n = 6; OLD AP female, n = 5; OLD VEN female, n = 5; OLD NAV female, n = 7; OLD FIS female, n = 7; OLD LUT female, n = 7; YNG CON male, n = 5; OLD CON male, n = 8; OLD AP male, n = 8; OLD VEN male, n = 6; OLD NAV male, n = 7; OLD FIS male, n = 7; OLD LUT male, n = 7.
Fig. 7
Fig. 7. Plasma IL-23R protein increases with age in humans.
ac, Measurement of IL-23R in human EDTA plasma in combined (a), female (pink) (b) and male (blue) (c) Mayo Clinic Biobank participants aged 20–82 years. Best fit line and 95% confidence interval (dashed lines) were determined by linear regression. Female participants (F = 4.545, d.f. = 38, P = 0.0395). Male participants (F = 4.837, d.f. = 37, P = 0.0342). Two-tailed test of Pearson correlation values (r) and P values are provided for each plot. Source data
Extended Data Fig. 1
Extended Data Fig. 1. Cycle threshold values from RT-PCR gene expression in young (Y) and old (O) tissues from female (pink) and male (blue) mice.
The maximum number of cycles for each experiment was 40. n = 11 Y KID, 14 O KID, 11 Y LIV, 14 O LIV, 11 Y SPLN, 14 O SPLN, 11 Y LNG, 14 O LNG, 11 Y FAT, 14 O FAT, 11 Y CTX, 14 O CTX. Bars summarize the mean ± s.e.m.
Extended Data Fig. 2
Extended Data Fig. 2. Correlation between tissue gene expression and plasma protein senescence in young and old mice.
Spearman correlations between tissue gene expression of senescence factors in young and old (A, B) kidney, (C, D) liver, (E, F) spleen, and (G, H) perigonadal adipose, and the plasma proteins CA13, CCL2, CCL3, CCL5, CCN1, IL17A, IL23R, and MIA for (A, C, E, G) female and (B, D, F, H) male mice. R-values are provided, and p values can be found in the source data. Samples sizes of per group: young female n = 6; old female n = 6; young male n = 5; old male n = 8. Source data
Extended Data Fig. 3
Extended Data Fig. 3. In situ hybridization (RNAscope) of Il23r+ cells co-localized to p16ink4a and Cd3e in the renal sinus and perivascular areas of aged mouse kidney.
(A) Representative images of p16ink4a (green) and Il23r (red) in C57BL/6 aged kidney perivascular tissue (21 mo. old). Blue color is an open channel for contrast of tissue architecture. (B) RNAscope of p16ink4a (green), Il23r (red), and Cd3e (cyan) from young (top, 2 mo.) and old (bottom, 24 mo.) kidney tissue from mice on p16-InkAttac background. DAPI nuclear stain is depicted in dark blue. Old kidney exhibits dense and perivascular Cd3e + Il23r+ immune nodes. (CF) Young and (GJ) old kidney tissue from RNAscope, similar to that shown in B. (C, D, G, H) Interstitial and perivascular tissue exhibit co-localization of Cd3e, Il23r, and p16ink4a in old but not young kidney. (E, I) Aged glomeruli show the presence of Cd3e + Il23r+ cells. (F, J) Connective tissue shows dense accumulation of Cd3e+ cells in both young and old kidney, but only old tissue exhibits co-localization with Il23r and p16ink4a. All scale bars = 100 μm. Experiments were repeated in 2 biological replicates of young and 4 replicates of old mice.
Extended Data Fig. 4
Extended Data Fig. 4. Senescence- and age-associated genes, including Il23r, are expressed in senescent fibroblasts in vitro.
(A) Representative 10x images of senescence-associated β-galactosidase (SA-β-gal) staining in sham and irradiated (IR) mouse embryonic fibroblasts (MEFs). Left panels are bright-field images, right panels are DAPI fluorescent images of the same field of view. Experiments were repeated in (B, C) Shown are quantifications for (B) percentage and (C) total number of SA-β-gal cells per image field. (D) Quantification of nucleus area in sham and irradiated cells as depicted in A. For B-D, bars denote mean ± s.e.m., p values provided vs. sham by two-tailed Mann-Whitney U test, with Holm-Sidak multiple-comparison correction. n = 12 sham, n = 12 IR. (E) RT-PCR gene expression of senescence- and age-associated markers in sham (open blue circles) and irradiated (solid orange triangle) MEFs. Values are expression relative to sham control. (F) Concentrations of senescence-related proteins in conditioned media (MEF CM) measured in pg/mL with Luminex multiplex assay. (G) Normalized protein expression (NPX) of senescence-related proteins in conditioned media measured with Olink PEA assay. Inset shows IL-23R values re-scaled. For E-G, bars denote mean ± s.e.m., * p < 0.05 vs. sham by two-tailed Mann-Whitney U test, with Holm-Sidak multiple-comparison correction for data. n = 6 samples per group.
Extended Data Fig. 5
Extended Data Fig. 5. Senolytic compounds have differential selectivity, potency, and efficacy in apoptosis of senescent cells in vitro.
Cleaved caspase-3 activity was measured in proliferating or etoposide-induced senescent primary human lung fibroblasts. (AD) Concentration-response curves for percent change in cleaved caspase-3 intensity within senescent (red diamonds) or proliferating (white circles) cells and after incubation (3 days) with senolytic compounds (A) VEN, (B) NAV, (C) FIS, or (D) LUT. (E) Etoposide-induced senescent fibroblast or (F) proliferating fibroblast concentration-response curves of normalized cleaved caspase intensity by application of VEN (green circles), NAV (purple squares), FIS (orange triangles), or LUT (blue downward triangles) compounds. Symbols denote mean ± s.e.m., n = 4 samples per group. Source data
Extended Data Fig. 6
Extended Data Fig. 6. p16 gene expression in aged liver, lung or perigonadal adipose in response to short-term transgenic or pharmacological senescent cell targeting.
RT-PCR was used to assess p16 gene expression between old control (OLD CON) and senolytic drug treated mice, in (AD) liver, (EH) lung, and (IL) perigonadal adipose. (A, C, E, G, I, K) Female groups are shown in pink, and (B, D, F, H, J, L) males are shown in blue. YNG CON versus OLD CON reflect statistics provided in Fig. 2 with exact p-values provided. Kruskal-Wallis tests with multiple comparison correction were used for comparison of old treatment groups with OLD CON. Bars summarize the median group values. Samples sizes per group, YNG CON female n = 6; OLD CON female n = 6; OLD AP female n = 5; OLD VEN female n = 5; OLD NAV female n = 7; OLD FIS female n = 7; OLD LUT female n = 7; YNG CON male n = 5; OLD CON male n = 8; OLD AP male n = 8; OLD VEN male n = 6; OLD NAV male n = 7; OLD FIS male n = 7; OLD LUT male n = 7.
Extended Data Fig. 7
Extended Data Fig. 7. p21 gene expression in aged tissues in response to short-term transgenic or pharmacological senescent cell targeting.
RT-PCR was used to assess p21 gene expression between old control (OLD CON) and senolytic drug treated mice, in (A, B) kidney, (C, D) liver, (E, F) spleen, (G, H) lung, (I, J) perigonadal adipose, and (K, L) cortex. (A, C, E, G, I, K). Female groups are shown in pink, and (B, D, F, H, J, L) males are shown in blue. YNG CON versus OLD CON reflect statistics provided in Fig. 2 with exact p-values provided. Kruskal-Wallis tests with multiple comparison correction were used for comparison of old treatment groups with OLD CON. We report two-tailed * p < 0.05, based on our hypothesis that each treatment would revert the levels of each age-associated factor closer to youthful levels. Bars summarize the median group values. Samples sizes per group, YNG CON female n = 6; OLD CON female n = 6; OLD AP female n = 5; OLD VEN female n = 5; OLD NAV female n = 7; OLD FIS female n = 7; OLD LUT female n = 7; YNG CON male n = 5; OLD CON male n = 8; OLD AP male n = 8; OLD VEN male n = 6; OLD NAV male n = 7; OLD FIS male n = 7; OLD LUT male n = 7.

References

    1. Bianchi, T., Rufer, N., MacDonald, H. R. & Migliaccio, M. The tumor suppressor p16Ink4a regulates T lymphocyte survival. Oncogene25, 4110–4115 (2006). - PubMed
    1. Yousefzadeh, M. J. et al. An aged immune system drives senescence and ageing of solid organs. Nature594, 100–105 (2021). - PMC - PubMed
    1. Childs, B. G. et al. Senescent intimal foam cells are deleterious at all stages of atherosclerosis. Science354, 472–477 (2016). - PMC - PubMed
    1. Roos, C. M. et al. Chronic senolytic treatment alleviates established vasomotor dysfunction in aged or atherosclerotic mice. Aging Cell15, 973–977 (2016). - PMC - PubMed
    1. Schafer, M. J., Miller, J. D. & LeBrasseur, N. K. Cellular senescence: implications for metabolic disease. Mol. Cell. Endocrinol.455, 93–102 (2017). - PMC - PubMed

MeSH terms

LinkOut - more resources