. 2025 Jun;9(6):836-864.
doi: 10.1038/s41551-024-01273-9. Epub 2024 Dec 10.

Heterogeneity-driven phenotypic plasticity and treatment response in branched-organoid models of pancreatic ductal adenocarcinoma

Affiliations

Heterogeneity-driven phenotypic plasticity and treatment response in branched-organoid models of pancreatic ductal adenocarcinoma

Aristeidis Papargyriou et al. Nat Biomed Eng. 2025 Jun.

Abstract

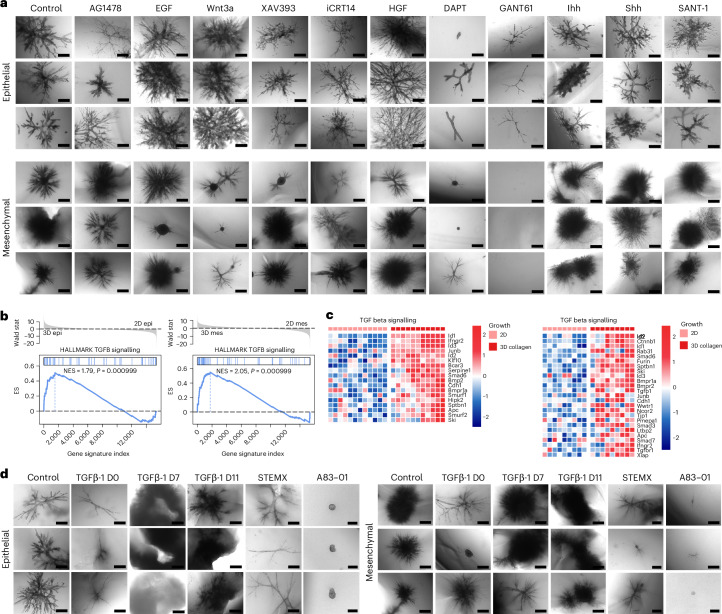
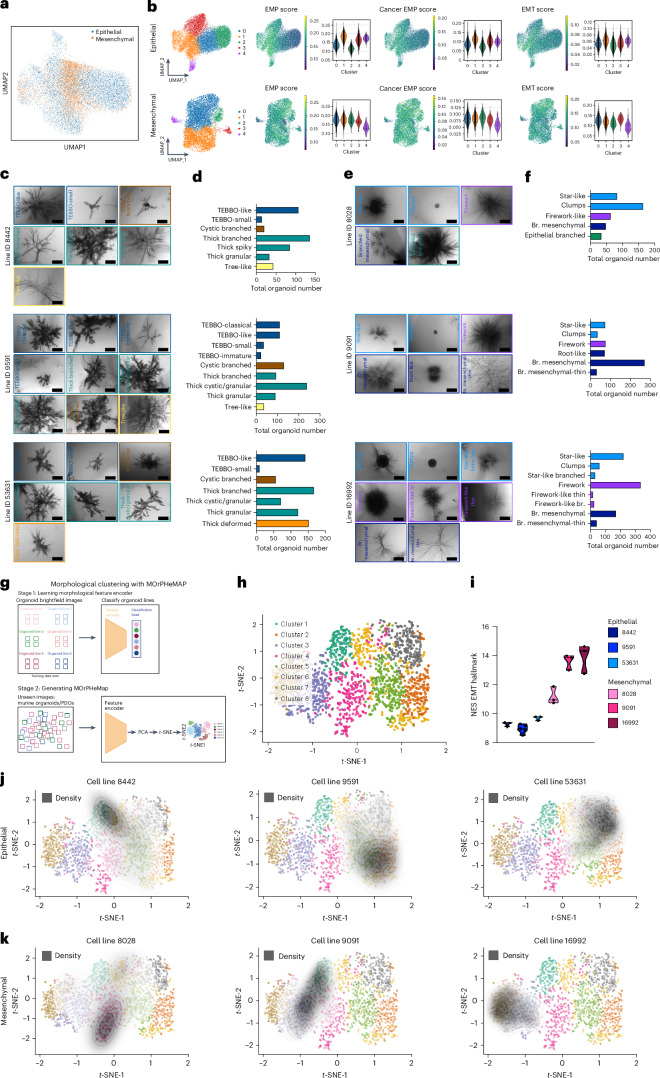
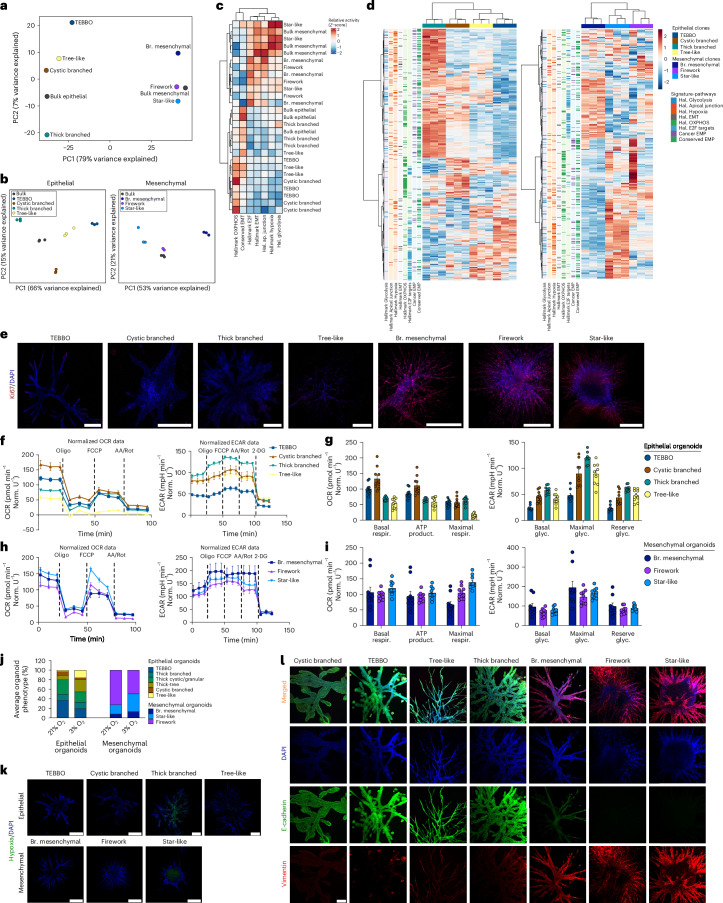
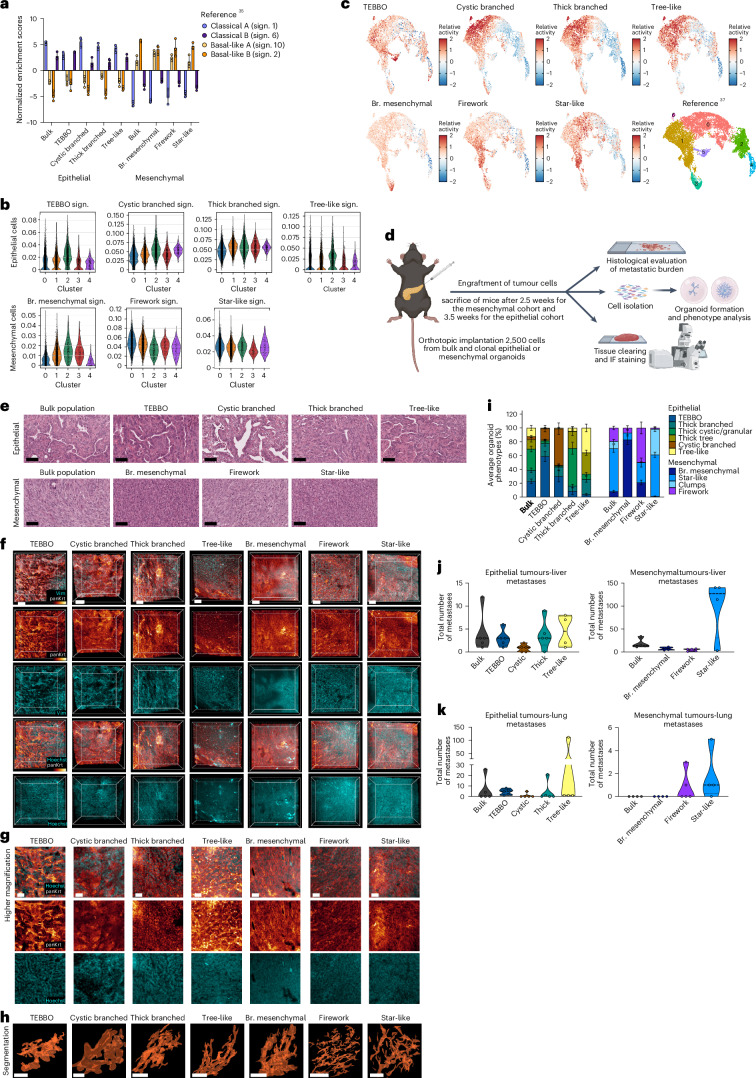
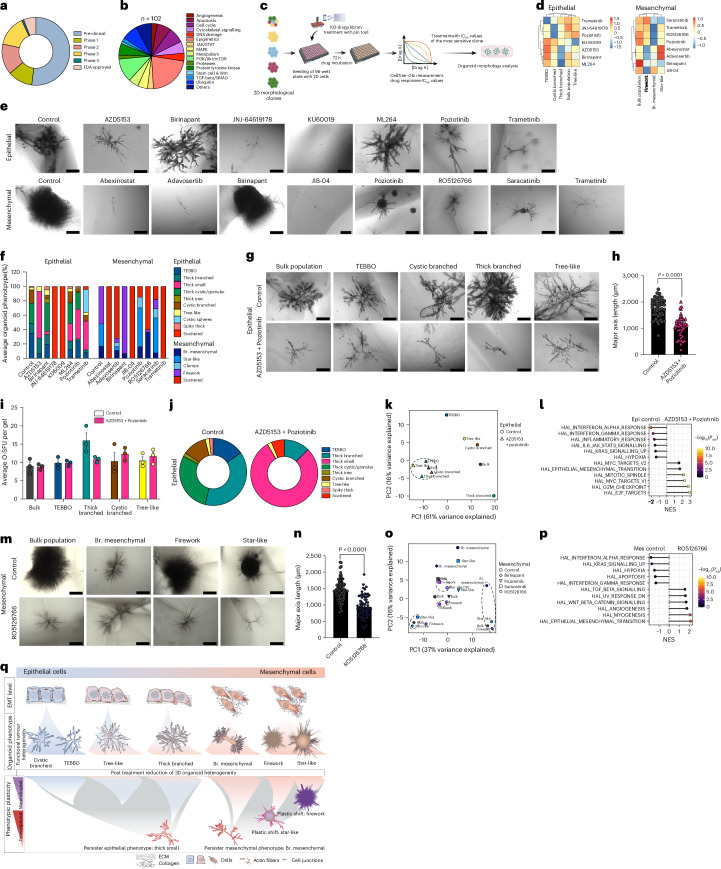
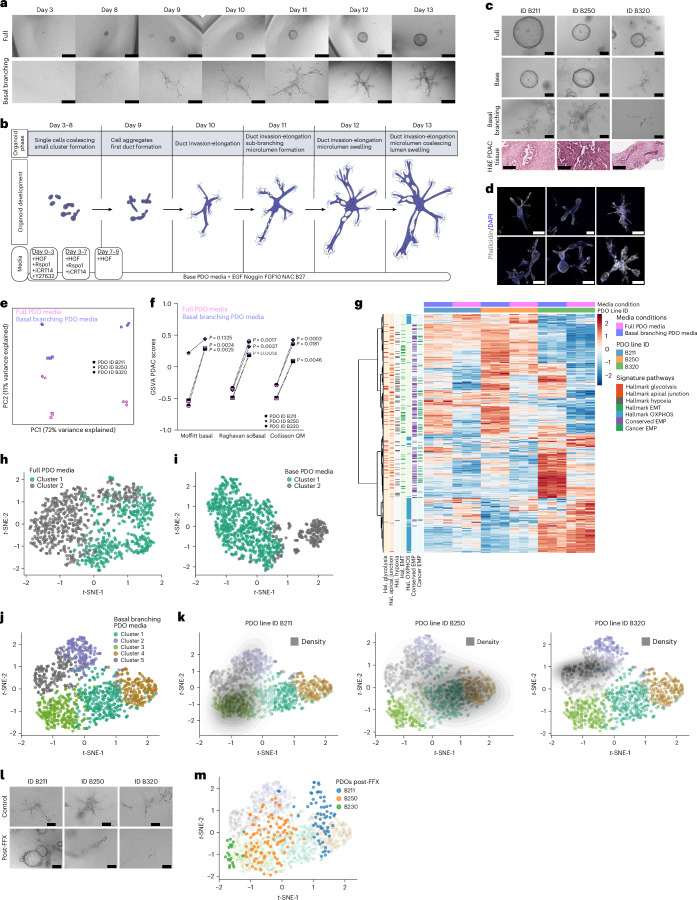
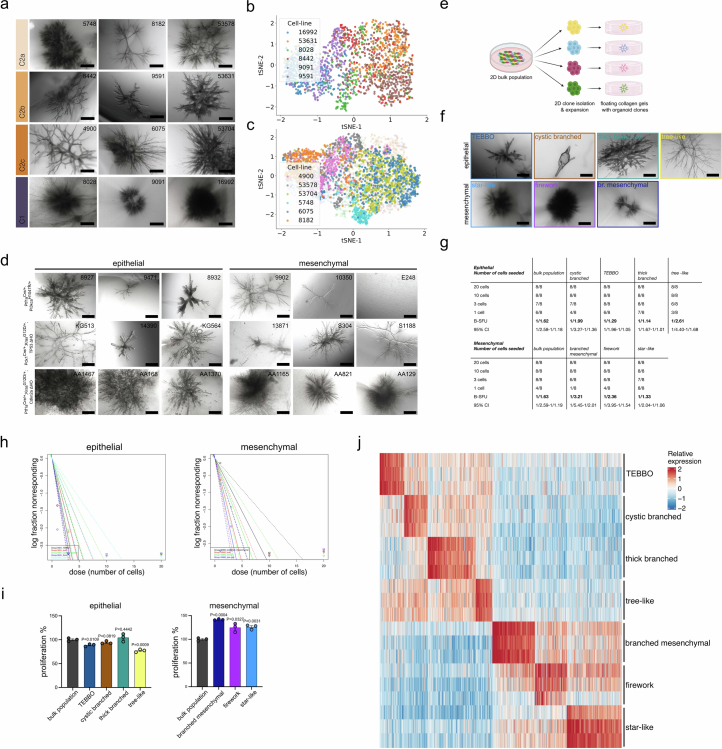
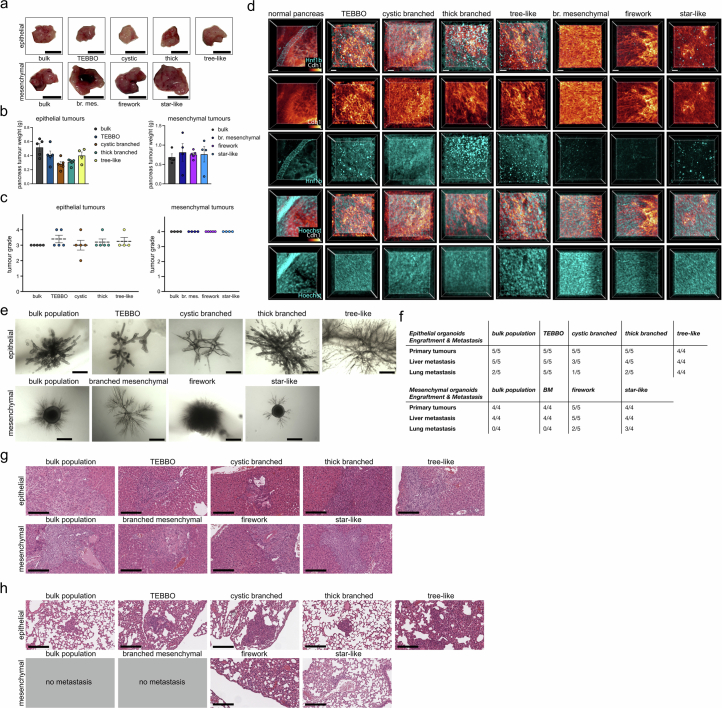
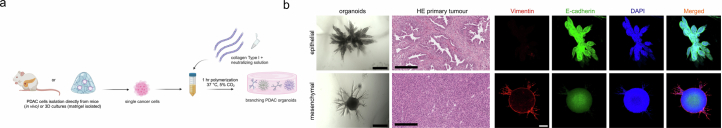
In patients with pancreatic ductal adenocarcinoma (PDAC), intratumoural and intertumoural heterogeneity increases chemoresistance and mortality rates. However, such morphological and phenotypic diversities are not typically captured by organoid models of PDAC. Here we show that branched organoids embedded in collagen gels can recapitulate the phenotypic landscape seen in murine and human PDAC, that the pronounced molecular and morphological intratumoural and intertumoural heterogeneity of organoids is governed by defined transcriptional programmes (notably, epithelial-to-mesenchymal plasticity), and that different organoid phenotypes represent distinct tumour-cell states with unique biological features in vivo. We also show that phenotype-specific therapeutic vulnerabilities and modes of treatment-induced phenotype reprogramming can be captured in phenotypic heterogeneity maps. Our methodology and analyses of tumour-cell heterogeneity in PDAC may guide the development of phenotype-targeted treatment strategies.


Conflict of interest statement

Competing interests: M.L. was a contractor for the Chan Zuckerberg Initiative and received speaker fees from Pfizer and Janssen Pharmaceuticals. F.J.T. consults for Immunai Inc., Singularity Bio B.V., CytoReason Ltd, Cellarity and Omniscope, and has ownership interest in Dermagnostix GmbH and Cellarity. The other authors declare no competing interests.

Figures

Fig. 1
Fig. 1. PDAC subtypes give rise to morphologically distinct branching organoids.
a, Schematic representation of the preparation of PDAC organoid cultures in floating collagen gels. Image created with BioRender.com. b, Confocal IF imaging of the organoid cytoskeleton (purple) and DAPI (blue) for epithelial and mesenchymal organoids. Images are maximum projections generated with Imaris. Scale bars, 200 µm (for mesenchymal), 500 µm (for epithelial organoids). c, Daily imaging of single-cell-derived organoids from the epithelial line (ID: 9591) and the mesenchymal line (ID: 16992) over the course of 13 days of development (here displaying Days 3–13). Scale bars, mesenchymal: 200 μm (Days 3–9), 500 μm (afterwards); epithelial: 200 μm (Days 3–5), 500 μm (afterwards). d, Major axis length of the organoid development of n = 1,099 epithelial (from the mouse line ID: 9591, 3 individual experiments) and n = 904 mesenchymal (from the mouse line ID: 16992, 3 individual experiments) organoids. Plot presents mean ± s.e.m. e, Confocal IF imaging of the proliferation marker Ki67 (green) and DAPI (blue) for epithelial (from the mouse line ID: 9591, 3 individual experiments) and mesenchymal (from the mouse line ID: 16992, 3 individual experiments) organoids. Scale bars, 100 µm (Day 3) and 200 µm (Day 5 onwards) for mesenchymal panel; 50 µm (Day 3) and 200 µm (Day 5 onwards) for epithelial panel. f, Confocal IF imaging of the epithelial marker E-cadherin (green), the mesenchymal marker N-cadherin (red) and DAPI (blue) for mesenchymal (n = 3 independent mouse lines; IDs: 8028, 9091, 16992) and epithelial (n = 3 independent mouse lines; IDs: 8442, 9591, 53631) organoids. Scale bars, 200 µm. g, Hierarchical clustering of RNA sequencing data from epithelial and mesenchymal 3D organoids derived from different KrasG12D background mice. Tumour grading, Kras mRNA levels retrieved from a previous study. Heat map of the leading-edge genes for both clusters. h, H&E staining of the primary tumours and corresponding brightfield organoid morphologies (n = 3 mouse lines for mesenchymal, n = 3 mouse lines for epithelial). Scale bars, 200 µm (H&E), 500 µm (organoids). i, ELDA of epithelial and mesenchymal organoids (left) and plot of the log fraction of non-responding wells (without organoids) versus the number of seeded cells (right). j,k, GSEA comparing 2D mesenchymal and 3D mesenchymal organoids (j) and 2D epithelial and 3D epithelial organoids (k). Every bar represents individual genes for the given gene set. Source data
Fig. 2
Fig. 2. Canonical TGFβ signalling is essential for the formation of branching PDAC organoids for both epithelial and mesenchymal subtypes.
a, Morphological effect of major developmental pathways: EGFR by AG1478 (EGFR inhibitor) and EGF, Wnt/β-catenin by Wnt3a, XAV393 (Tankyrase inhibitor), iCRT14 (β-catenin-Tcf inhibitor), Notch (γ-secretase inhibitor), HGF, and Hedgehog by Ihh, Shh, GANT61 (GLI antagonist) and SANT-1 (Smo antagonist) on epithelial (n = 1,045 organoids, line ID: 9591, 3 individual experiments) and mesenchymal organoids (n = 873 organoids, line ID: 16992, 3 individual experiments). Treatments were performed with 10 µM AG1478, 5 ng EGF, 100 ng Wnt3a, 5 µM XAV939, 5 µM iCRT14, 5 ng HGF, 10 µM DAPT, 10 µM GANT61, 100 ng Ihh, 100 ng Shh, 2 µM Sant-1. Scale bars, 500 µm. b, GSEA of epithelial (n = 3 mouse lines, from 3 individual experiments) and mesenchymal (n = 3 mouse lines, from 3 individual experiments) 2D monolayers and 3D organoids for the TGFβ pathway. c, Heat maps of most up and downregulated genes between 2D monolayers and 3D cells for epithelial and mesenchymal organoids (from left to right). d, Monotreatments of KrasG12D epithelial (n = 468 organoids, line ID: 9591, 3 individual experiments) or mesenchymal (n = 618 organoids, line ID:16992, 3 individual experiments) organoids with 5 ng of TGFβ-1; treatment administration from Day 0, Day 7 or Day 11 after seeding, 1× StemXVivo EMT-inducing media supplement (termed STEMX) treatment from Day 0, or 5 µM TGFβ-RI inhibitor A83-01 treatment from Day 0. All organoids were imaged on Day 13. Scale bars, epithelial organoids: 200 µm (all A83-01), 500 µm (all others); mesenchymal organoids: 200 µm (all STEMX and the bottom A83-01), 500 µm (all others).
Fig. 3
Fig. 3. Intra-cell-line heterogeneity drives organoid phenotype diversity.
a, UMAP plots from single-cell RNA sequencing of epithelial and mesenchymal 2D bulk populations. b, UMAP plots from single-cell RNA sequencing of epithelial 2D bulk populations (cell line ID: 9591, n = 16,747 cells) and mesenchymal 2D bulk populations (cell line ID: 16992, n = 9,190 cells). Conserved EMP, Cancer EMP according to the signature gene sets and EMT hallmark scores are presented in violin plots, the y-axis represents the AUCell scores for the specific pathways. c, Major morphologies found in epithelial organoid lines (n = 3 mouse lines, IDs: 8442, 9591, 53631). Colour coding implies the hierarchical relation of the super families. Scale bars, 500 µm. d, Manual clustering of the total number of organoids (line ID: 8442 n = 438, ID: 9591 n = 864, ID: 53631 n = 718 organoids). e, Major morphologies found in mesenchymal organoid lines (n = 3 mouse lines, ID: 8028, 9091, 16992). Colour coding implies the hierarchical relation of the super families. Scale bars, 500 µm. f, Manual clustering of the total number of organoids (line ID: 8028 n = 392, ID: 9091 n = 562 and ID: 16992 n = 900 organoids). g, Schematic representation of the workflow to develop MOrPHeMap; image created with BioRender.com. h, K-means clustering of the image-derived features of unseen data set of n = 1,579 organoids (from 6 mouse lines, 3-E IDs: 8442, 9591, 53631 and 3-M IDs: 8028, 9091, 16992) revealed 8 distinct morphological clusters. i, NES of the EMT hallmark from the 3 epithelial and 3 mesenchymal mouse lines grown in 3D collagen gels. j,k, Individual cell-line morphological heterogeneity as visualized by density overlays superimposed on the imaged-derived clusters. The overlays indicate which cell lines correspond to which cluster. j, t-SNE plots of the organoids clustering from the epithelial lines (IDs: 8442, 9591, 53631). k, t-SNE plots of the organoids clustering from the mesenchymal lines (IDs: 8028, 9091, 16992). Br. mesenchymal, branched mesenchymal; Br. mes.-thin, branched mesenchymal thin. Source data
Fig. 4
Fig. 4. Molecular and functional characterization of distinct organoid morphologies.
Transcriptomic and pathway analyses from individual organoid phenotypes isolated from the E-mouse line ID: 9591 and the M-mouse line ID: 16992. a, PCA of bulk RNA sequencing from different morphological epithelial and mesenchymal organoids. Each dot represents the mean of 3 independent experiments. b, Subtype-specific PCA of the bulk RNA sequencing from different morphological epithelial (left) and mesenchymal organoids (right). c, Heat map score activity of epithelial and mesenchymal organoids. d, Heat map of the hallmarks: Glycolysis, Apical Junction, Hypoxia, EMT, Oxidative phosphorylation, E2F targets, EMP and Cancer EMP characterizing the individual clonal epithelial (left) and mesenchymal (right) organoids. e, Immunofluorescence staining for the proliferation marker Ki67 in epithelial and mesenchymal organoids. Scale bars, 500 µm. f, Seahorse OCR and ECAR measurements in distinct epithelial organoid phenotypes. g, Quantification of basal respiration, ATP production and maximal respiration in the OCR (left), and basal, maximal and reserved glycolysis in the ECAR (right) normalized data for distinct epithelial organoid phenotypes. h, Seahorse OCR (left) and ECAR (right) measurements in distinct mesenchymal organoid phenotypes. i, Quantification of basal respiration, ATP production and maximal respiration in the OCR (left), and basal, maximal and reserved glycolysis in the ECAR (right) normalized data for distinct mesenchymal organoid phenotypes. fi, n = 10 technical replicates for the OCR and n = 9 technical replicates for the ECAR measurements for both epithelial and mesenchymal organoid phenotypes. Graph represents mean ± s.e.m. j, Manual phenotype analysis of organoids in normal and hypoxic (3% O2) conditions for epithelial and mesenchymal organoids. n = 189 epithelial (3 individual experiments) and 235 mesenchymal (3 individual experiments) organoids. Bar plot represents the average number of organoid phenotypes (%). k, In vitro hypoxia confocal imaging. Staining was performed with the fluorescent Image-iT green hypoxia reagent (Thermo Fisher) and DAPI, n = 2 individual experiments. Scale bars, 500 µm. l, Confocal IF imaging of E-cadherin (green), Vimentin (red) and DAPI (blue) for the 4 major epithelial morphological clones: cystic branched, TEBBO, tree-like and thick branched (from left to right), and the 3 major mesenchymal morphological clones: branched mesenchymal, firework and star-like (from left to right). Scale bars, 200 µm. Br. mesenchymal, branched mesenchymal; respir., respiration; glyc., glocolysis; product., production. Source data
Fig. 5
Fig. 5. Organoids phenotypes represent distinct tumour cell states with unique in vivo biological functions.
a, Scoring of the individual organoid phenotypes isolated from the E-mouse line ID: 9591 and the M-mouse line ID: 16992 for PDAC subtype-specific signatures. Graph represents mean ± s.e.m., each dot represents an independent experiment. b, Violin plots of scRNA-seq from the parental epithelial and mesenchymal cells scored for the organoid phenotype signatures. The y-axis represents the AUCell scores for the specific signatures. c, UMAP scoring the individual organoid phenotype signatures to a human PDAC data set. d, Schematic representation of the in vivo orthotopic transplantation and the subsequent analysis, including histopathological analysis, whole-tissue clearing and IF staining, and organoid line isolation/characterization; image created with BioRender.com. e, H&E staining of orthotopically transplanted organoids. Scale bars, 60 µm. fh, 3D in vivo growth patterns of PDAC organoids. f, 3D views of PDAC organoid grafts stained for pan-Keratin and Vimentin. All scale bars, 100 μm. g, High magnifications of pan-Keratin from the PDAC grafts in f, demonstrating different growth patterns of the various organoid lines. All scale bars, 20 μm. h, 3D segmentations of coherent tumour cell strands from different organoid grafts. All scale bars, 30 μm. i, Manual phenotype analysis of organoids post implantation (n = 41 lines, n = 1,171 organoids from the epithelial lines and n = 633 organoids from the mesenchymal lines). Bar plot represents the mean ± s.e.m. of the average number of organoid phenotypes (%). j, Truncated violin plots of the total number of metastatic nodules in the liver from epithelial (left) and mesenchymal (right) transplanted organoid phenotypes. k, Truncated violin plots of the total number of metastatic nodules in the lung from epithelial (left) and mesenchymal (right) transplanted organoid phenotypes. Br. mesenchymal, branched mesenchymal; sign., signature. Source data
Fig. 6
Fig. 6. Defining PDAC subtype and organoid phenotype-specific vulnerabilities to radio- and chemotherapy.
a, Schematic representation of the in vitro workflow for the different treatment approaches with either FOLFIRINOX (FFX) IC50 values or 8 Gy irradiation; image created with BioRender.com. b,c, Average O-SFU per gel for epithelial (b) and mesenchymal (c) type of organoids. All organoid numbers correspond to 3 E-lines (IDs: 8442, 9591, 53631) and 3 M-lines (IDs: 8028, 9091, 16992). For all E and M-lines control n = 9, FFX n = 7, FFX W.O. n = 7, 8 Gy n = 4 and 8 Gy W.O. n = 4 individual experiments (except for the M-line ID: 8028 where control n = 7 individual experiments). Graphs represent median with interquartile range. Unpaired two-tailed non-parametric t-test, Mann–Whitney test. d, Representative organoid morphologies of epithelial (from 3 mouse lines) and mesenchymal (from 3 mouse lines) organoids before (control n = 2,438 organoids), after treatment with FFX (n = 1,470 organoids), 8 Gy irradiation (n = 428 organoids) or their washout phases (FFX W.O. n = 1,594 and 8 Gy W.O. n = 638 organoids). Scale bars, 500 µm. e, MRI images of the in vivo tumours at Day 14 after transplantation for epithelial (top) and mesenchymal (bottom) transplanted lines. Scale bars, 1 cm. f, Quantification of the tumour volume from the MRI measurements. Graph represents mean ± s.e.m, unpaired two-tailed parametric t-test with Welch’s correction, two-tailed. g, Representative H&E images of the transplanted tumours. Scale bars, 200 µm. h, Histological grading of the transplanted tumours (n = 33 mice); graph represents mean ± s.e.m. i, Manual phenotypic analysis of epithelial (n = 915 organoids, from the mouse line ID: 9591 from at least 3 individual experiments) and mesenchymal (n = 1,257 organoids, from the mouse line ID: 16992 from at least 3 individual experiments) organoids before, after treatment and in the respective washout phase. Pie charts represent the average number of organoid phenotypes (%). Source data
Fig. 7
Fig. 7. Targeted therapy reduces phenotypic heterogeneity via phenotypic reprogramming.
Targeted therapy treatment and transcriptomic analysis of individual organoid phenotypes isolated from the E-mouse line ID: 9591 and the M-mouse line ID: 16992. a, Pie chart of the library design (n = 102 drugs) with the drug approval status: preclinical, phase 1, 2, 3, 4 and FDA approved. b, Pie chart of the specific targeted pathways by the 102 drugs. c, Schematic summary of the drug-treatment workflow; image created with BioRender.com. d, Heat maps of the z-score for specific drugs from the 102-drug screening of the 2D epithelial (4 phenotype clones and the bulk population from the mouse line ID: 9591, n = 2 individual experiments) and mesenchymal (3 phenotype clones and the bulk population from the mouse line ID: 16992, n = 2 individual experiments) cells. e, Brightfield imaging of bulk organoid morphologies post treatment with selective drugs using the IC50 values of the most sensitive 2D clones in 3D. Scale bars, 200 µm (mesenchymal treated with JIB-04 ), 500 µm (all others). f, Manual phenotypic analysis of epithelial bulk (n = 397 organoids from 3 individual experiments) and mesenchymal bulk (n = 246 organoids from 3 individual experiments) organoid populations after the selective treatment. Bar plot represents the average number of organoid phenotypes (%). g, Brightfield images of epithelial control (n = 334 organoids, 3 individual experiments) and combinatory treatment with AZD5153+Poziotinib (n = 321 organoids, 3 individual experiments) organoids from the bulk population, TEBBO, cystic branched, thick branched and tree-like phenotypes. Scale bars, 500 µm. h, Major axis length (µm) of bulk epithelial organoids as control (n = 51 organoids from 3 individual experiments) and organoids treated with AZD5153+Poziotinib (n = 49 organoids from 3 individual experiments). Graph represents mean ± s.e.m., unpaired two-tailed parametric t-test with Welch’s correction, two-tailed. i, O-SFUs per gel of control and AZD5153+Poziotinib-treated (in pink) epithelial organoid phenotypes; graph represents mean ± s.e.m. of 3 individual experiments. j, Manual phenotypic analysis of control and AZD5153+Poziotinib-treated bulk organoid populations of bulk epithelial organoids (n = 107 organoids). Pie chart represents the average number of organoid phenotypes (%). k, PCA analysis of the bulk RNA sequencing from control and AZD5153+Pozitionib-treated bulk, TEBBO, cystic branched, thick branched and tree-like organoids. Each dot represents the mean of 3 individual experiments. Dashed circles highlight the organoid phenotypes under the combinatory treatments. l, Dot plot of the GSEA comparing the epithelial control (from all phenotypes) and AZD5153+Poziotinib-treated (from all phenotypes) epithelial organoids. Padj, Benjamini–Hochberg adjusted P values. m, Mesenchymal control and RO5126766-treated organoid morphologies for the bulk population, branched mesenchymal, firework and star-like phenotypes. Scale bars, 500 µm. n, Major axis length (µm) of bulk mesenchymal organoids as control (n = 93 organoids from 3 individual experiments) and after treatment with RO5126766 (n = 67 organoids from 3 individual experiments). Graph represents mean ± s.e.m., unpaired two-tailed parametric t-test with Welch’s correction, two-tailed. o, PCA analysis of the bulk RNA sequencing from control and bulk, branched mesenchymal, firework and star-like organoids treated with Birinapant, Poziotinib, Saracatinib or RO5126766. In addition, we included an earlier time point for the star-like organoids (Day 10). Dashed circles highlight the organoid phenotype transitions under specific treatments. Each dot represents the mean of 3 individual experiments (except for the branched mesenchymal+RO5126766 with 1 replicate). p, Dot plot of GSEA comparing the mesenchymal control (from all phenotypes) with the RO5126766-treated (from all phenotypes) mesenchymal organoids. q, Graphical summary of the distinct epithelial and mesenchymal organoid phenotypes and how mono or combinational treatments can either plastically switch morphologies or reveal persister phenotypes. Br. mesenchymal, branched mesenchymal. Source data
Fig. 8
Fig. 8. Patient-derived organoids develop heterogeneous phenotypes in basal branching PDO media.
a, Daily imaging of single-cell-derived organoids over the course of 13 days of development (here representing Days 3 and 8–13). The PDOs were cultured in full PDO media (top; n = 342 organoids) and in basal branching PDO media (bottom; n = 573 organoids). Scale bars, 200 µm (full PDO media); 200 µm (Days 3–11) and 500 µm (from Day 12 onwards) for the basal branching PDO media. b, Graphical summary of the organoid development in the basal branching PDO media with the media composition and the different developmental phases. c, Characteristic PDO organoid morphologies (n = 3 PDO lines) cultured in different conditions: full PDO media (top), base PDO media (middle), basal branching PDO media (bottom) and H&E staining of the corresponding primary tumours. Scale bars, 100 µm (PDO line ID B320 cultured in full PDO media and base PDO media), 200 µm (all others). d, Confocal IF imaging of phalloidin (white) and DAPI (blue). Scale bar, 200 µm, illustrating the different morphologies the PDO line ID B250 displays in basal branching PDO media. e, PCA of bulk RNA sequencing for the PDO lines (IDs: B211, B250 and B320) in full PDO media (pink colour) and basal branching PDO media (lilac colour). f, Gene set variation analysis (GSVA) of the basal/quasi-mesenchymal profile of PDO lines cultured in full PDO media and basal branching PDO media. Unpaired two-tailed parametric t-test with Welch’s correction, two-tailed. g, Heat map of bulk RNA sequencing for the PDO lines (IDs: B211, B250 and B320) for the hallmarks: Glycolysis, Apical Junction, Hypoxia, EMT, Oxidative phosphorylation, EMP and Cancer EMT characterizing the individual PDOs cultured in full PDO media or in basal branching PDO media. h, K-means clustering of the image-derived features of unseen data set of n = 832 organoids reveals 2 distinct morphological clusters when PDOs were cultured in full PDO media. i, K-means clustering of the image-derived features of unseen data set of n = 834 organoids reveals 2 distinct morphological clusters when PDOs were cultured in base PDO media. j, K-means clustering of the image-derived features of unseen data set of n = 928 organoids reveals 5 distinct morphological clusters when PDOs were cultured in basal branching PDO media. k, Individual PDO line (ID: B211 (left), ID: B250 (middle), ID: B320 (right)) grown in basal branching PDO media, with morphological heterogeneity as visualized by density overlays superimposed on the imaged-derived clusters. The overlays indicate which cell lines correspond to which cluster. l, Characteristic morphologies of organoids grown in basal branching PDO media as control or after pre-treatment with FFX IC50 values. Scale bars, 200 µm. m, Clustering of PDOs (superimposed on the K-means clustering from j) after pre-treatment with IC50 values of FFX and then culturing in basal branching PDO media. Source data
Extended Data Fig. 1
Extended Data Fig. 1. Characterization of epithelial and mesenchymal branching in PDAC organoids.
a Organoid morphologies of epithelial (upper panel mouse line ID: 9591, from 3 independent experiments-exception is the concentration 2.5 mg/mL with only 2 independent replicates included) and mesenchymal (lower panel mouse line ID 16992, from 3 independent experiments-exception is the concentration 2.5 mg/mL with only 2 independent replicates included) organoids grown in various collagen concentrations from 1.0 mg/mL up to 2.5 mg/mL, Scale bars, 500 μm. b Quantification of the organoids major axis length in the different collagen concentrations (n = 612 for the epithelial and n = 563 for the mesenchymal), graph represents mean±sem. c Organoid morphologies for epithelial (upper panel mouse line ID: 9591, 3 independent experiments) and mesenchymal (lower panel mouse line ID: 16992, 3 independent experiments) organoids grown in collagen Type I gels with the addition of the ECM proteins fibronectin (FN, concentration 40 µg/mL), laminin (LM, concentration 40 µg/mL) or the combination (FN + LM), Scale bars, 500 μm. d Quantification of the organoids major axis length in the different collagen Type I matrices with the addition of FN, LM or both (n = 378 organoids for the epithelial and n = 388 organoids for the mesenchymal), graph represents mean±sem. e-f Heatmaps of most up and down-regulated genes between epithelial and mesenchymal organoids for the “Reactome ECM degradation” and the “WP MMPs”. g Confocal IF imaging of an EMT panel, first column: E-cadherin (green) /N-cadherin (red) /DAPI (blue), second column: E-cadherin (green) /Vimentin (red) /DAPI (blue), third column: E-cadherin (green) /β-catenin (red) /DAPI (blue), fourth column: ZEB-1 (green) /ZO-1 (red) /DAPI (blue) and fifth column: YAP (green) / phalloidin (white) /DAPI (blue) for epithelial (top) and mesenchymal organoids (bottom), scale bars upper panel (10x magnification)= 200 μm, lower panel-higher magnifications (60x)= 30 μm. Images on the second and fourth row are taken on a 60x objective (higher magnification) of their respective upper panel or from the similar organoid phenotypes. h Gene set enrichment analysis (GSEA) comparing epithelial and mesenchymal 3D organoid cultures, NES= normalized enrichment scores, FDR= false discovery rate. Every bar represents individual genes for the given gene set. i Morphologies of epithelial and mesenchymal organoids in primary, secondary and tertiary structures. Scale bars primary structures= 1000 μm, secondary 1000 for the epithelial and 500 μm for the mesenchymal and tertiary= 500 μm. j Extreme limiting dilution analysis (ELDA) and log plot of nonresponding wells vs. cell dosage for the primary, secondary, and tertiary structures of epithelial and mesenchymal organoids. Source data
Extended Data Fig. 2
Extended Data Fig. 2. EMT induction via TGFβ signalling reveals heterogeneous responses.
a Confocal IF imaging of E-cadherin (green), Vimentin (red) and DAPI (blue) for the epithelial (top) and mesenchymal (bottom) 2D cells (n = 3 mouse E and 3 mouse M lines) after 7 days EMT induction with 5 ng TGFβ1 or 1x STEMX, Scale bars= 50 μm. b Epithelial (top, from the mouse line ID: 9591) and mesenchymal (bottom, from the mouse line ID: 16992) organoid morphologies after treatment of the 2D cells for 7 days prior to seeding into organoid cultures with: 5 ng TGFβ1, 1x STEMX or 5 µM A83-01. Scale bars, 500 μm. c Epithelial and mesenchymal organoid morphologies after treatment of the 2D cells for 20 days prior to seeding into 3D-cultures with: 5 ng TGFβ1, 1x STEMX or 5 µM A83-01, additionally the treatment renewal with 1x STEMX, 5 µM A83-01 at day 0 and at specific days for TGFβ1: day 0, day 7, day 11 was included. All scale bars are 500 μm except from the 20 Days treated with A83-01 W.O. and then treated with additional A83-01 (most right column) where scale bars are 200 μm. d Quantification of epithelial and mesenchymal organoid morphologies in their W.O. phase from epithelial origin organoids (from the mouse line ID: 9591) after 7- or 20-days pre-treatment with 5 ng TGFβ1 or 1x STEMX (7 days treatment control n = 101, TGFβ1 W.O. n = 89 and STEMX W.O. n = 114 organoids from 3 individual experiments. 20 days treatment control n = 159, TGFβ1 W.O. n = 59 and STEMX W.O. n = 80 organoids). Unpaired two-tailed parametric t-test with Welch’s correction, two-tailed. e Confocal IF imaging of E-cadherin (green), Zeb1 (red) and DAPI (blue) for the epithelial organoids after 20 days of EMT induction with: 5 ng TGFβ1, 1x STEMX as control populations and with treatment renewal using 1x STEMX at day 0 and at specific days for TGFβ1: day 0 and day 7. The two main populations (without treatment renewal) are displayed, #1 the stable mesenchymal and #2 the reverting epithelial, Scale bars, 200 μm. Source data
Extended Data Fig. 3
Extended Data Fig. 3. Structural characterization of distinct organoid phenotypes from epithelial and mesenchymal PDAC subtypes.
a Phalloidin (red)/DAPI (blue) IF staining (top) of the distinct epithelial and mesenchymal organoid phenotypes. Surface segmentation of the above images with Imaris Scale bars= 300 μm for TEBBO, cystic branched, 500 μm for thick branched and tree-like, 400 μm for the branched mesenchymal and 200 μm for the firework and star-like organoids. b-j Morphological parameters analysis for epithelial (from the mouse line ID: 9591) organoid phenotypes: TEBBO (n = 106 organoids), cystic branched (n = 105 organoids), thick branched (n = 267 organoids) and tree-like (n = 57 organoids). b Major axis length of epithelial organoids in μm. c Thickness of core branches in μm. d Violin plot of average number of main branches. e Total number of nodes. f Average number of spiky branches. g Average number of terminal end buds. h Number of swollen lumens/microlumens i Lumen size of the epithelial organoid phenotypes measured in μm2. b-c and e-i Graphs represent median with interquartile range. Unpaired two-tailed non parametric t-test, Mann-Whitney test. j % average level of granular appearance of organoids (low, medium, high). k-n Morphological parameters analysis for mesenchymal (from the mouse line ID: 16992) organoid phenotypes: branched mesenchymal (n = 158 organoids), firework (n = 261 organoids) and star-like (n = 206 organoids). k Major axis length of mesenchymal organoids in μm. l Branch (or core branch) thickness measured in μm. m Average number of total branches (main and subbranches). k-m Graphs represent median with interquartile range. Unpaired two-tailed non parametric t-test, Mann-Whitney test. n Comparison of the core area of star-like organoids to the theoretical perfect circular area by measuring the diameter (radius=diameter/2) of the organoids and then calculating the area (A), A= π*r2. Graph represents median with interquartile range. Source data
Extended Data Fig. 4
Extended Data Fig. 4. Deciphering inter-cell and intra-cell organoid heterogeneity.
a Characteristic organoid morphologies derived from four different transcriptional clusters as previously described (C2a, C2b, C2c, C1). Scale bars= 500 μm. b t-SNE plot clustering showing the individual organoid lines from Fig. 3h. c t-SNE plot clustering for the C2a and C2c organoids (n = 2015 organoids) superimposed on the Extended Data Fig. 4b. d Organoid phenotypes (n = 588 organoids) from epithelial and mesenchymal type of organoids derived from various mouse models (with different driver mutations): Ptf1aCre/+; Pi3kca+H1047R/+ (n = 6 mouse lines, note that the line E248 is not forming 3D organoids), Pdx1Cre/+; KrasG12D/+; TP53 ΔHO (n = 6 mouse lines), Ptf1aCre/+; KrasG12D/+; Cdkn2a ΔHO (n = 6 mouse lines). Scale bars= 500 μm. e Schematic representation of the morphological clone isolation and expansion. Image created with BioRender.com. f Major 3D morphological families that were used for further characterisation. Scale bars= 500 μm. g Extreme Limiting Dilution Analysis (ELDA) of epithelial and mesenchymal organoid phenotypes. h Log plot of nonresponding wells vs cell dosage for the epithelial (left) and mesenchymal (right) 3D organoid phenotypes. i Proliferation rate as % compared to the bulk population for the epithelial (from the mouse line ID: 9591 from 3 individual experiments) and mesenchymal (from the mouse line ID: 16992 from 3 individual experiments) 2D clones. Unpaired two-tailed parametric t-test with Welch’s correction, two-tailed. Both graphs represent mean±sem. j Heatmap of signature genes from E and M organoid phenotypes. Source data
Extended Data Fig. 5
Extended Data Fig. 5. Orthotopic transplantation of organoid phenotypes.
a Images of epithelial and mesenchymal tumours after transplantation of distinct organoid phenotypes. Scale bars= 1cm. b-c n = 41 mice, for the epithelial transplanted organoids n = 5 mice/phenotype (tree-like n = 4 mice) and for the mesenchymal transplanted organoids n = 4 mice/phenotype (firework n = 5 mice). b Pancreas tumour weight (g) for epithelial and mesenchymal organoid phenotypes derived tumours. Graphs represent mean±sem. c Tumour grading for epithelial and mesenchymal organoid phenotypes derived tumours. Graphs represent mean±sem. d In vivo marker expression of different transplanted organoid phenotypes. 3D views of in vivo PDAC organoid grafts stained for E-cadherin and Hnf1β. Note absent nuclear Hnf1β staining in mesenchymal organoid lines. All scale bars= 20 μm. e Characteristic organoid morphologies from cell lines isolated post-implantation (epithelial on top, mesenchymal bottom). Scale bars= 500 μm. f Summary table of the tumour engraftment and liver/lung metastatic colonization efficacy from epithelial and mesenchymal transplanted organoids in mice. BM: branched mesenchymal. g HEs of liver metastasis from epithelial (top) and mesenchymal (bottom) organoid phenotypes transplanted in mice. Scale bars= 200 μm. h HEs of lung metastasis from epithelial (top) and mesenchymal (bottom) organoid phenotypes transplanted in mice. Scale bars= 200 μm. Source data
Extended Data Fig. 6
Extended Data Fig. 6. Pharmacotyping reveals unique organoid responses towards targeted therapies.
All epithelial organoid phenotypes in Fig. 6 are derived from the mouse line ID: 9591 and the mesenchymal from the mouse line ID: 16992. a Heatmap of AUC values from epithelial (left) and mesenchymal (right) clones. b Representative organoid morphologies of epithelial 3D morphological clones: TEBBO, cystic branched, thick branched, and tree-like (from left to right) under control (DMSO treated) conditions or treated with the most sensitive IC50 values of: AZD5153, Birinapant, JNJ-64619178, KU60019, ML264, Poziotinib and Trametinib. All scale bars= 500 μm except for the TEBBO and thick branched phenotypes treated with KU60019, scale bars= 200 μm. c Representative organoid morphologies of mesenchymal 3D morphological clones: branched mesenchymal, firework-like and star-like (from left to right) under control conditions or treated with the most sensitive IC50 values of: Abexinostat, Adavosertib, Birinapant, JIB-04, Poziotinib, RO5126766, Saracatinib and Trametinib. All scale bars= 500 μm except for the firework phenotypes treated with Abexinostat, Adavosertib or JIB-04, scale bars= 200 μm. d Average Organoid structure formation units O-SFU/gel for the epithelial 3D morphological clones under the abovementioned (Extended Data Fig. 6b) treatment conditions. Graph represents mean±sem, from 3 individual experiments. e Average Organoid structure formation units O-SFU/gel for the mesenchymal 3D morphological clones under the abovementioned (Extended Data Fig. 6c) treatment conditions. Graph represents mean±sem, from 3 individual experiments. f Major axis length (in μm) of star-like control at Day 13 (n = 42 organoids), star-like control at Day 10 (n = 68 organoids), and firework organoids at Day 13 after treatment with Poziotinib (n = 53 organoids) or Saracatinib (n = 47 organoids). Graph represents mean±sem, unpaired two-tailed parametric t-test with Welch’s correction, two-tailed. g Dot plot of the GSEA from the mesenchymal star-like organoid phenotype control vs. Birinapant treated. h Dot plot of the GSEA from the mesenchymal firework organoid phenotype control vs. Poziotinib treated. i Dot plot of the GSEA from the mesenchymal firework organoid phenotype control vs. Saracatinib treated. j Dot plot of the GSEA from the mesenchymal star-like (Day 10) organoid phenotype control vs. the firework organoids treated with Saracatinib (star-like acquired phenotype, at Day 13). g-j NES= normalized enrichment score, padj=Benjamini-Hochberg adjusted p-values. Source data
Extended Data Fig. 7
Extended Data Fig. 7. Defining the composition of the basal branching PDO media to induce branching morphogenesis in PDOs.
a Representative organoid morphologies of established PDAC lines: DANG, MiaPaCa2, Panc1, PatuS, PatuT, PSN-1 and BxPC3 (from left to right) grown inside floating collagen gels in their established media culture conditions: (either RPMI or DMEM + 10% FBS) (n = 2035 total organoids). All scale bars= 200 μm. b Schematic representation of the PDO generation. Image created with BioRender.com. c Organoid morphological resemblance in Matrigel and Collagen matrix grown conditions. Scale bars= 500 μm. d Confocal IF imaging of PDOs grown in floating collagen gels for E-cadherin (green), N-cadherin (red), DAPI (blue) and phalloidin (white), scale bars= 100 μm. e Extreme Limiting Dilution Analysis (ELDA) of different PDO lines. f Plot of the log fraction of nonresponding wells (empty of organoids) versus the number of the seeded cells. g Representative organoid morphologies of the PDO lines ID B211, B250 and B320 in Full PDO Media, Base PDO Media and Base PDO Media with addition of 1% B27, 500 µM N-acetyl cysteine (NAC), 25 ng FGF10, 50 ng EGF, 10 ng HGF, 25 ng Noggin, 25 ng Rspondin1 or 5 µM iCRT14 (n = 350 organoids for B211, n = 470 organoids for B250, n = 413 for B320). Top panel is a 5x magnification, scale bar= 500 μm and bottom panel is a zoom-in 10x image or higher magnification (10x) images, scale bar= 200 μm for each individual PDO line.
Extended Data Fig. 8
Extended Data Fig. 8. Capturing heterogeneous branching in PDO phenotypes.
a Representative organoid morphologies of established PDAC lines: DANG, MiaPaCa2, Panc1, PatuS, PatuT, PSN-1 and BxPC3 (from left to right) grown inside floating collagen gels in two different media culture conditions: the established media conditions containing 10% FBS (top) and the Basal Branching PDO Media (bottom) (n = 113 organoids in the 10% FBS Media and 106 organoids in the Basal Branching PDO Media). All scale bars= 500 μm except from the PatuS and BxPC3 organoids where the scale bars= 200 μm. b-f Analyses of the following PDO line IDs: B211, B250, B320. b Heatmap of bulk RNA sequencing for different pathways associated with the extracellular matrix organization and rearrangement. c Individual PDO line morphological heterogeneity in Full PDO Media as visualized by density overlays superimposed on the imaged-derived clusters. The overlays indicate which cell lines correspond to which cluster. d Individual PDO line morphological heterogeneity in Base PDO Media as visualized by density overlays superimposed on the imaged-derived clusters. The overlays indicate which cell lines correspond to which cluster. e Major morphologies found in PDOs cultured in Basal Branching PDO Media. Color coding implies the hierarchical relation of the super families and manual morphological clustering of the total number of organoids, n = 916 organoids. Scale bars= 200 μm. f Transcriptional correlation scoring of PDOs growing in Basal Branching PDO Media to murine organoid phenotype signatures. g Characteristic PDO organoid morphologies of additional PDO lines (n = 3 patients, PDO line IDs: B379, B403, B535) cultured in different conditions: Full PDO Media (top), Base PDO Media (middle), Basal Branching PDO Media (bottom) and HEs of the corresponding PDAC tissues. All organoid scale bars= 100 μm, HEs of the PDAC tissues scale bars= 200 μm. h K-means clustering of the image-derived features of an additional unseen data set from the PDO line IDs: B379, B403, B535 (n = 531) organoids integrated with the original data from Fig. 8h reveals 2 distinct morphological clusters when PDOs are cultured in Full PDO Media. i K-means clustering of the image-derived features of an additional unseen data set from the PDO line IDs: B379, B403, B535 (n = 349 organoids) integrated with the original data from Fig. 8i reveals 2 distinct morphological clusters when PDOs are cultured in Base PDO Media. j K-means clustering of the image-derived features of an additional unseen data set from the PDO line IDs: B379, B403, B535 (n = 783 organoids) integrated with the original data set from the Fig. 8j reveals 6 distinct morphological clusters when PDOs are cultured in Basal Branching PDO Media. k Individual PDO line (ID: B379-left, ID: B403-middle, ID: B535-right) morphological heterogeneity in Basal Branching PDO Media as visualised by density overlays superimposed on the imaged-derived clusters (Extended Data Fig. 8j). The overlays indicate which cell lines correspond to which cluster. Source data
Extended Data Fig. 9
Extended Data Fig. 9. Culturing of branching epithelial and mesenchymal organoids directly in 3D matrices.
a Schematic representation of organoid generation directly from in vivo or 3D in vitro cultures (Matrigel), image created with BioRender.com. b Epithelial (top) and mesenchymal (bottom) collagen gel grown organoids. Corresponding HEs of the primary tumours. Confocal IF imaging of E-cadherin (green), Vimentin (red), DAPI (blue). Scale bars= 500 μm (bright field), 200 μm (HEs), 200 μm (IF).

Similar articles

Cited by

References

    1. Rahib, L., Wehner, M. R., Matrisian, L. M. & Nead, K. T. Estimated projection of US cancer incidence and death to 2040. JAMA Netw. Open4, e214708 (2021). - PMC - PubMed
    1. Evan, T., Wang, V. M. & Behrens, A. The roles of intratumour heterogeneity in the biology and treatment of pancreatic ductal adenocarcinoma. Oncogene41, 4686–4695 (2022). - PMC - PubMed
    1. Collisson, E. A., Bailey, P., Chang, D. K. & Biankin, A. V. Molecular subtypes of pancreatic cancer. Nat. Rev. Gastroenterol. Hepatol.16, 207–220 (2019). - PubMed
    1. Bailey, P. et al. Genomic analyses identify molecular subtypes of pancreatic cancer. Nature531, 47–52 (2016). - PubMed
    1. Porter, R. L. et al. Epithelial to mesenchymal plasticity and differential response to therapies in pancreatic ductal adenocarcinoma. Proc. Natl Acad. Sci. USA116, 26835–26845 (2019). - PMC - PubMed

MeSH terms

LinkOut - more resources