. 2024 Dec;3(12):1531-1548.
doi: 10.1038/s44161-024-00574-1. Epub 2024 Dec 10.

PDGFRA is a conserved HAND2 effector during early cardiac development

Affiliations

PDGFRA is a conserved HAND2 effector during early cardiac development

Yanli Xu et al. Nat Cardiovasc Res. 2024 Dec.

Abstract

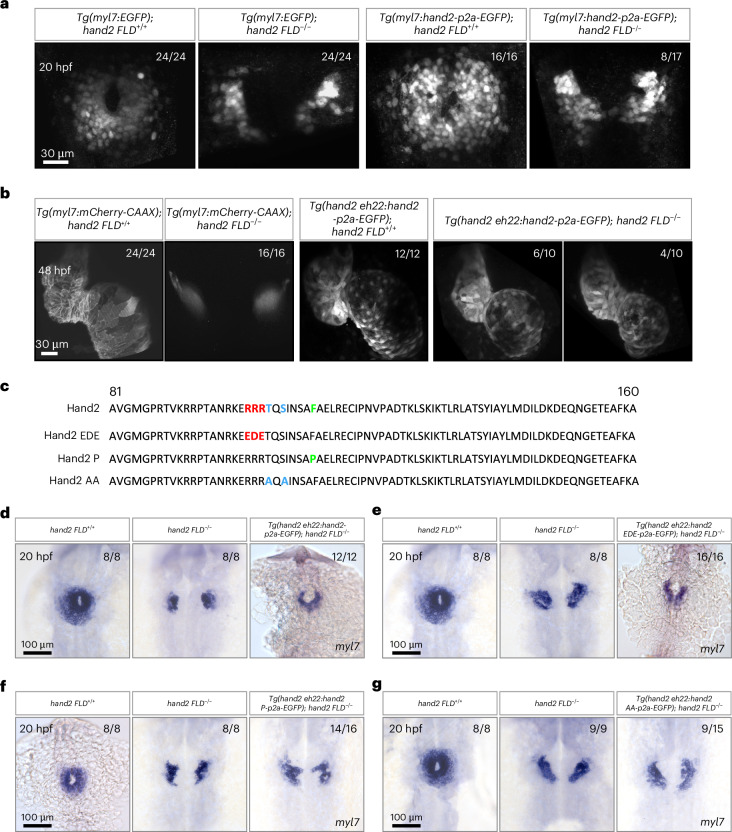
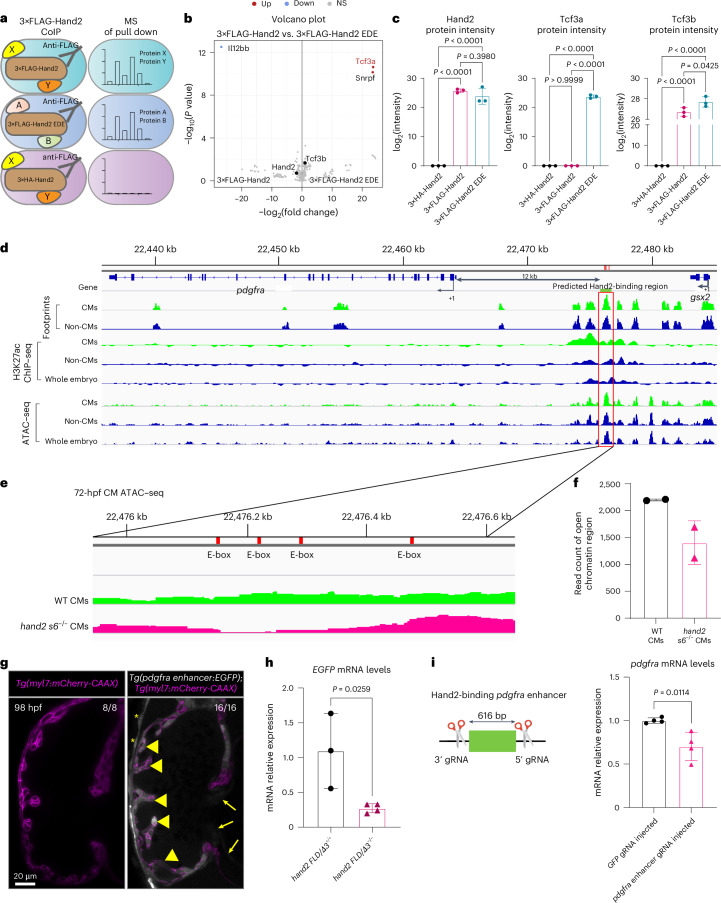
The basic helix-loop-helix transcription factor HAND2 has multiple roles during vertebrate organogenesis, including cardiogenesis. However, much remains to be uncovered about its mechanism of action. Here, we show the generation of several hand2 mutant alleles in zebrafish and demonstrate that dimerization-deficient mutants display the null phenotype but DNA-binding-deficient mutants do not. Rescue experiments with Hand2 variants using a newly identified hand2 enhancer confirmed these observations. To identify Hand2 effectors critical for cardiogenesis, we analyzed the transcriptomes of hand2 loss- and gain-of-function embryonic cardiomyocytes and tested the function of eight candidate genes in vivo; pdgfra was most effective in rescuing myocardial migration in hand2 mutants. Accordingly, we identified a putative Hand2-binding region in the zebrafish pdgfra locus that is important for its expression. In addition, Hand2 loss- and gain-of-function experiments in mouse embryonic stem cell-derived cardiac cells decreased and increased Pdgfra expression, respectively. Altogether, these results further our mechanistic understanding of HAND2 function during early cardiogenesis.


Conflict of interest statement

Competing interests: The authors declare no competing interests.

Figures

Fig. 1
Fig. 1. The DNA-binding domain of Hand2 is not required for early zebrafish cardiogenesis.
a, Schematic of the hand2 locus and hand2 mutants. A hand2 FLD allele was generated by targeting the 5′ and 3′ UTR sequences of hand2 (gRNA#1, gRNA#2), resulting in a deletion of 1,411 bp. A hand2 DNA-binding and phosphorylation domains-deficient allele was generated using one gRNA (gRNA#3) around the sequence encoding the DNA-binding and phosphorylation domains of Hand2, resulting in a 27-bp deletion. A hand2 dimerization domain-deficient allele was generated using one gRNA (gRNA#4) around the sequence encoding the dimerization domain of Hand2, resulting in a 3-bp deletion. b, Amino acid sequence alignment of Hand2, Hand2 Δ27 and Hand2 Δ3 generated through Clustal Omega. The three arginines in red and the threonine and serine in blue were deleted in the DNA-binding and phosphorylation domains-deficient form of Hand2 (Hand2 Δ27); the phenylalanine in green was deleted in the dimerization domain-deficient form of Hand2 (Hand2 Δ3). c, In situ hybridization showing myl7 expression in 20- and 24-hpf hand2 FLD+/+ and hand2 FLD−/− sibling embryos. d, In situ hybridization showing myl7 expression in 22- and 24-hpf hand2 Δ27+/+ and hand2 Δ27−/− sibling embryos. e, In situ hybridization showing myl7 expression in 20- and 24-hpf hand2 Δ3+/+ and hand2 Δ3−/− sibling embryos. The proportion of embryos matching the image shown is indicated in the top right corner of each image. The scale bars apply to all images.
Fig. 2
Fig. 2. Cardiac fusion requires the dimerization domain of Hand2.
a, Maximum intensity projections of confocal images of Tg(myl7:EGFP) expression in 20 hpf hand2 FLD+/+ and hand2 FLD−/− sibling embryos, as well as Tg(myl7:hand2-p2a-EGFP) expression in 20 hpf hand2 FLD+/+ and hand2 FLD−/− sibling embryos (of the 17 Tg(myl7:hand2-p2a-EGFP); hand2 FLD−/− embryos, 9 displayed no rescue of myocardial migration and 8 displayed partial rescue). b, Maximum intensity projections of confocal images of Tg(myl7:mCherry-CAAX) expression in 48 hpf hand2 FLD+/+ and hand2 FLD−/− sibling embryos, as well as Tg(hand2 eh22:hand2-p2a-EGFP) expression in 48 hpf hand2 FLD+/+ and hand2 FLD−/− sibling embryos. c, Partial amino acid sequence alignment of Hand2, Hand2 EDE, Hand2 P and Hand2 AA. EDE: DNA-binding-deficient form of Hand2 (RRR to EDE); P: dimerization-deficient form of Hand2 (F to P); AA: phosphorylation-deficient form of Hand2 (TS to AA). d, In situ hybridization showing myl7 expression in 20 hpf hand2 FLD+/+, hand2 FLD−/− and Tg(hand2 eh22:hand2-p2a-EGFP); hand2 FLD−/− sibling embryos. e, In situ hybridization showing myl7 expression in 20 hpf hand2 FLD+/+, hand2 FLD−/− and Tg(hand2 eh22:hand2 EDE-p2a-EGFP); hand2 FLD−/− sibling embryos. f, In situ hybridization showing myl7 expression in 20 hpf hand2 FLD+/+, hand2 FLD−/− and Tg(hand2 eh22:hand2 P-p2a-EGFP); hand2 FLD−/− sibling embryos (of the 16 Tg(hand2 eh22:hand2 P-p2a-EGFP); hand2 FLD−/− embryos, 14 displayed no rescue of myocardial migration and 2 displayed WT hand2-like rescue). g, In situ hybridization showing myl7 expression in 20 hpf hand2 FLD+/+, hand2 FLD−/− and Tg(hand2 eh22:hand2 AA-p2a-EGFP); hand2 FLD−/− sibling embryos (of the 15 Tg(hand2 eh22:hand2 AA-p2a-EGFP); hand2 FLD−/− embryos, 9 displayed no rescue of myocardial migration and 6 displayed WT hand2-like rescue). All embryos are shown in dorsal views, anterior to the top. The proportion of embryos matching the image shown is indicated in the top right corner of each image. The scale bars apply to all images.
Fig. 3
Fig. 3. scRNA-seq analysis of hand2 reporter-expressing cells in WT and hand2 mutant embryos.
a, Maximum intensity projections of confocal images of 20 hpf TgBAC(hand2:EGFP) expression in hand2 FLD+/+ and hand2 FLD−/− sibling embryos. The proportion of embryos matching the image shown is indicated in the top right corner of each image. The scale bar applies to all images. b, Schematic of the experimental protocol; the transcriptomes of 3,900 and 3,836 individual hand2 reporter-expressing cells from 24 hpf hand2 FLD−/− and hand2 FLD+/? sibling embryos, respectively, were sequenced. c, Left, UMAP representation of the cells from hand2 FLD−/− (blue) and hand2 FLD+/? (pink) sibling embryos. Right, UMAP of the data clustered by the Leiden algorithm. d, Heat map of the top 7 DEGs in each cell cluster. A list of the DEGs in each cell cluster can be found in Supplementary Table 2. e, Proportional contribution of cardiac precursors, cardiomyocytes and endothelial/endocardial cells in 24 hpf hand2 FLD+/? and hand2 FLD−/− sibling embryos generated by Scanpro’s bootstrapping method. Panel b created with BioRender.com.
Fig. 4
Fig. 4. Hand2 regulates pdgfra expression to promote cardiac fusion.
a, Left, transcriptomic analysis was performed using RNA extracted from sorted Tg(myl7:EGFP)+ cells from 20 hpf hand2 FLD+/? and hand2 FLD−/− sibling embryos. Right, normalized read count for pdgfra in 20 hpf hand2 FLD+/? and hand2 FLD−/− sibling Tg(myl7:EGFP)+ cells; error bars are mean ± s.e.m.; n = 3 biologically independent samples. b, In situ hybridization showing pdgfra expression in the anterior LPM (arrows) of 16 hpf hand2 s6+/? and hand2 s6−/− sibling embryos. c, Normalized read count for pdgfra in 20 hpf hand2 OE and WT sibling Tg(myl7:EGFP)+ cardiomyocytes; error bars are mean ± s.e.m.; n = 3 biologically independent samples. d, In situ hybridization showing myl7 expression in 24 hpf hand2 FLD+/+, hand2 FLD−/− and Tg(myl7:pdgfra-p2a-EGFP); hand2 FLD−/− sibling embryos. e, In situ hybridization showing myl7 expression in 24 hpf hand2 FLD+/+, hand2 FLD−/− and Tg(hand2 eh22:pdgfra-p2a-EGFP); hand2 FLD−/− sibling embryos. f, Left, Tg(myl7:EGFP)+ cells in 20 hpf hand2 FLD+/+, hand2 FLD−/− and Tg(myl7:pdgfra-p2a-EGFP); hand2 FLD−/− sibling embryos (of the 14 Tg(myl7:pdgfra-p2a-EGFP); hand2 FLD−/− embryos, 10 displayed a comparable number of myl7:EGFP+ cells as hand2 FLD−/− embryos and 4 displayed a few more myl7:EGFP+ cells). Right, quantification of cardiomyocyte numbers in 20 hpf hand2 FLD+/+ (n = 14), hand2 FLD−/− (n = 16), Tg(myl7:pdgfra-p2a-EGFP); hand2 FLD+/+ (n = 16) and Tg(myl7:pdgfra-p2a-EGFP); hand2 FLD−/− (n = 14) sibling embryos; error bars are mean ± s.e.m. g, Left, Tg(myl7:EGFP)+ cells in 20 hpf hand2 FLD+/+, hand2 FLD−/− and Tg(hand2 eh22:pdgfra-p2a-EGFP); hand2 FLD−/− sibling embryos (of the 23 Tg(hand2 eh22:pdgfra-p2a-EGFP); hand2 FLD−/− embryos, 20 displayed a comparable number of myl7:EGFP+ cells as hand2 FLD−/− embryos and 3 displayed a few more myl7:EGFP+ cells). Right, quantification of cardiomyocyte numbers in 20 hpf hand2 FLD+/+ (n = 15), hand2 FLD−/− (n = 23), Tg(hand2 eh22:pdgfra-p2a-EGFP); hand2 FLD+/+ (n = 23) and Tg(hand2 eh22:pdgfra-p2a-EGFP); hand2 FLD−/− (n = 23) sibling embryos; error bars are mean ± s.e.m. P values were calculated using an unpaired Student’s t test (a (right), c) or a one-way analysis of variance (ANOVA) multiple-comparison test (f (right), g (right)). All embryos are shown in dorsal views, anterior to the top. The proportion of embryos matching the image shown is indicated in the top right corner of each image. The scale bars apply to all images. FDR, false discovery rate; FC, fold change; CMs, cardiomyocytes; NS, not significant (P > 0.05).
Fig. 5
Fig. 5. Deletion of a putative Hand2-binding region in a zebrafish pdgfra enhancer results in decreased pdgfra expression in the embryonic heart.
a, Illustration of the CoIP–MS experiment: 14 hpf 3×FLAG-hand2 and 3×FLAG-hand2 EDE mRNA-injected embryos were subjected to FLAG CoIP reactions, controlling for background with 3×HA-hand2 mRNA-injected embryos. The pulled complexes were subjected to MS. b, Volcano plot showing significantly enriched proteins in the FLAG CoIP–MS experiment. Significant proteins are indicated as blue (down) and red (up) dots, and nonsignificant proteins are indicated in gray. c, Protein intensity of Hand2, Tcf3a and Tcf3b in 3×HA-Hand2, 3×FLAG-Hand2 and 3×FLAG-Hand2 EDE protein complexes by MS; error bars are mean ± s.d.; n = 3 biologically independent samples. d, Genome browser view showing ATAC–seq and ChIP–seq peaks enriched in myocardial cells at the pdgfra locus. Red box: predicted Hand2-binding region. e, ATAC–seq genome tracks showing open chromatin regions at the predicted Hand2-binding region in 72 hpf WT (green) and hand2 s6−/− (magenta) cardiomyocytes. The tracks show the peak signal intensity for open chromatin regions (data analyzed from GSE120238 (ref. )). Red boxes: conserved E-boxes in the –12-kb pdgfra enhancer. f, Normalized read count for the open chromatin region across the predicted Hand2-binding region (from chr20: 22,476,180–22,476,620 bp) in 72 hpf WT and hand2 s6−/− cardiomyocytes (data analyzed from GSE120238 (ref. )); error bars are mean ± s.d.; n = 2 biologically independent samples. g, Confocal images of hearts from representative 98 hpf Tg(myl7:mCherry-CAAX) larvae not carrying (left) or carrying (right) the pdgfra enhancer:EGFP transgene; EGFP fluorescence is detectable in the heart of the representative double-transgenic larva (in cardiomyocytes (short arrows) and endocardial cells (long arrows) and in some pericardial cells (asterisks)); EGFP is shown in white, and cardiomyocyte membranes are shown in magenta (myl7:mCherry-CAAX). h, Relative mRNA levels of EGFP in 18 hpf Tg(pdgfra enhancer:EGFP); hand2 FLD/Δ3+/+ and Tg(pdgfra enhancer:EGFP); hand2 FLD/Δ3−/− sibling embryos; error bars are mean ± s.d.; n = 3 hand2 FLD/Δ3+/+ and n = 4 hand2 FLD/Δ3−/−. i, Left, schematic of the strategy to generate Hand2-binding pdgfra enhancer crispant embryos. Right, relative mRNA levels of pdgfra in the hearts of GFP crispant and Hand2-binding pdgfra enhancer crispant embryos at 24 hpf. P values were calculated using a one-way ANOVA multiple-comparison test (c) or an unpaired Student’s t test (h, i (right)); error bars are mean ± s.d.; n = 4 biologically independent samples. The proportion of larvae matching the image shown is indicated in the top right corner of each image. The scale bar applies to all images. Ct values of qPCR data are listed in Supplementary Table 1.
Fig. 6
Fig. 6. Hand2 promotes Pdgfra expression in mouse cardiac cells.
a, Violin plots showing Pdgfra expression in cardiac precursors of E8.25 WT and Hand2−/− mutant hearts (data analyzed from GSE126128 (ref. )). b, Violin plots showing Pdgfra expression in posterior second heart field cells of E8.25 WT and Hand2−/− mutant hearts (data analyzed from GSE126128 (ref. )). c, Schematic of knockdown and overexpression of Hand2 during mESC differentiation into cardiac cells. d, Relative mRNA levels of Hand2 and Pdgfra in Hand2 knockdown mESC-derived cardiac cells; error bars are mean ± s.e.m.; n = 3 biologically independent samples. e, Relative mRNA levels of Hand2 and Pdgfra in Hand2 OE mESC-derived cardiac cells; error bars are mean ± s.e.m.; n = 3 biologically independent samples. P values in d and e were calculated using a one-way ANOVA multiple-comparison test. The average mRNA level in mESCs was set at 1.0. The Ct values of qPCR data are listed in Supplementary Table 1. Ctrl, control; KD, knockdown.
Extended Data Fig. 1
Extended Data Fig. 1. Loss of hand1 in zebrafish.
a, Phylogenetic profile of HAND1 on a species level resolution. Colour code indicates the feature architecture similarity (FAS) score of the orthologues to the human seed protein. Dot colour (FAS_F) and cell colour (FAS_B) represent the feature architecture similarity score between two orthologs using the human protein (dot colour) and the ortholog (cell colour) as reference, respectively. b, PhyloView representation of HAND1 and HAND2 in the human genome and their ortholog in other genomes. HAND1/HAND2 and their orthologs are positioned in the center, aligned with their neighboring genes, in various genomes. Genes of the same color represent orthologs.
Extended Data Fig. 2
Extended Data Fig. 2. Generation of hand2 mutant alleles.
a, Amino acid sequence alignment of Human HAND2, mouse HAND2, and zebrafish Hand2 generated through Clustal Omega. The three arginines in red have DNA binding activity; the threonine and serine in blue have phosphorylation activity; the phenylalanine in green has dimerization activity. While there is 100% amino acid sequence identity between human and mouse HAND2, the residues that are different in zebrafish are indicated in orange. b, Partial nucleotide sequence of the hand2 FLD allele, which shows a 1,411 bp deletion, the hand2 Δ27 allele, and the hand2 Δ3 allele. c, Brightfield images of 75 hpf hand2 FLD+/+ and hand2 FLD/ sibling larvae, hand2 Δ27+/+ and hand2 Δ27/ sibling larvae, hand2 Δ3+/+ and hand2 Δ3/ sibling larvae, hand2 Δ27/FLD transheterozygous larvae, and hand2 Δ27/Δ3 transheterozygous larvae. The proportion of larvae matching the image shown is indicated in the top right corner of each image. Scale bars apply to all images.
Extended Data Fig. 3
Extended Data Fig. 3. hand2 expression in hand2 mutant alleles.
a, Relative mRNA levels of hand2 in 12 hpf hand2 FLD+/+, hand2 FLD+/, and hand2 FLD/ sibling embryos; relative mRNA levels of hand2 in 12 hpf hand2 Δ3+/+, hand2 Δ3+/, and hand2 Δ3/ sibling embryos; relative mRNA levels of hand2 in 12 hpf hand2 Δ27+/+, hand2 Δ27+/, and hand2 Δ27/ sibling embryos; error bars are mean ± s.e.m; n = 5 hand2 FLD+/+, n = 5 hand2 FLD+/, n = 5 hand2 FLD/; n = 7 hand2 Δ3+/+, n = 7 hand2 Δ3+/, n = 7 hand2 Δ3/; n = 8 hand2 Δ27+/+, n = 7 hand2 Δ27+/, n = 7 hand2 Δ27/. b, Relative pre-mRNA levels of hand2 in 12 hpf hand2 FLD+/+, hand2 FLD+/, and hand2 FLD/ sibling embryos; relative pre-mRNA levels of hand2 in 12 hpf hand2 Δ3+/+, hand2 Δ3+/, and hand2 Δ3/ sibling embryos; relative pre-mRNA levels of hand2 in 12 hpf hand2 Δ27+/+, hand2 Δ27+/, and hand2 Δ27/ sibling embryos; error bars are mean ± s.e.m; n = 5 hand2 FLD+/+, n = 5 hand2 FLD+/, n = 5 hand2 FLD/; n = 7 hand2 Δ3+/+, n = 7 hand2 Δ3+/, n = 7 hand2 Δ3/; n = 8 hand2 Δ27+/+, n = 7 hand2 Δ27+/, n = 7 hand2 Δ27/. c, Western blot analysis comparing the levels of FLAG-tagged Hand2 protein in 14 and 22 hpf 3xFLAG-hand2, 3xFLAG-hand2 Δ3, and 3xFLAG-hand2 Δ27 mRNA injected embryos. d, Confocal images of representative Tg(myl7:mCherry-CAAX) hearts from 72 hpf larvae that were not injected, or injected at the one-cell stage with a hand2 eh22:hand2 Δ3-p2a-EGFP plasmid, or a hand2 eh22:hand2 Δ27-p2a-EGFP plasmid. P values in a, b were calculated using a one-way ANOVA multiple comparison test. The proportion of larvae matching the image shown is indicated in the top right corner of each image. Scale bar applies to all images. Ct values of qPCR data are listed in Supplementary Table 1.
Extended Data Fig. 4
Extended Data Fig. 4. hand2 eh22 enhancer-driven reporter labels early cardiac precursors.
a, Schematic representation of ATAC-seq and H3K27ac ChIP-seq experimental design; a Tg(myl7:EGFP) line was used to isolate EGFP+ (that is, myocardial) cells and EGFP (that is, non-myocardial) cells at 24 hpf. a’, Graphs showing the FACS gating strategies to sort 24 hpf Tg(myl7:EGFP + ) CMs. b, Genome browser view showing ATAC-seq and ChIP-seq peaks enriched in myocardial cells at the hand2 locus; red boxes indicate 3 of the putative enhancers that were tested. c, Confocal images of representative Tg(myl7:mCherry-CAAX) hearts from 75 hpf larvae that were injected at the one-cell stage with a hand2 eh2:EGFP, hand2 eh16:EGFP, or hand2 eh22:EGFP plasmid. c’, Percentage of EGFP+ embryos that were injected at the one-cell stage with a myl7:EGFP, hand2 eh2:EGFP, hand2 eh16:EGFP, or hand2 eh22:EGFP plasmid. d, In situ hybridization showing hand2, EGFP, and myl7 expression in 12, 14, 16, and 24 hpf WT and Tg(hand2 eh22:EGFP) sibling embryos; schematics of the expression pattern shown on the right. The proportion of embryos matching the image shown is indicated in the top right corner of each image. Scale bar applies to all images. Panel a created with BioRender.com.
Extended Data Fig. 5
Extended Data Fig. 5. hand2 expression in hand2 OE lines.
a, Proportion (a) and percentage (a’) of rescued 48 hpf hand2 FLD/ embryos after injection at the one-cell stage with the constructs as listed (as in Fig. 2b). b, Confocal images of representative Tg(myl7:mCherry-CAAX) hearts from 98 hpf Tg(hand2 eh22:hand2-p2a-EGFP), Tg(hand2 eh22:hand2 EDE-p2a-EGFP), Tg(hand2 eh22:hand2 P-p2a-EGFP), and Tg(hand2 eh22:hand2 AA-p2a-EGFP) larvae. c, Proportion (c) and percentage (c’) of rescued 20 hpf Tg(hand2 eh22:hand2-p2a-EGFP);hand2 FLD/, Tg(hand2 eh22:hand2 EDE-p2a-EGFP);hand2 FLD/, Tg(hand2 eh22:hand2 P-p2a-EGFP);hand2 FLD/, and Tg(hand2 eh22:hand2 AA-p2a-EGFP);hand2 FLD/ embryos. d, Relative mRNA levels of hand2 in 20 hpf Tg(hand2 eh22:EGFP), Tg(hand2 eh22:hand2-p2a-EGFP), Tg(hand2 eh22:hand2 EDE-p2a-EGFP), Tg(hand2 eh22:hand2 P-p2a-EGFP), and Tg(hand2 eh22:hand2 AA-p2a-EGFP) EGFP+ cells; error bars are mean ± s.e.m.; n = 3 hand2 eh22:EGFP, n = 5 hand2 eh22:hand2, n = 3 hand2 eh22:hand2 EDE, n = 3 hand2 eh22:hand2 P, n = 4 hand2 eh22:hand2 AA. e, Western blot analysis comparing the levels of FLAG-tagged Hand2 protein in 14 hpf 3xFLAG-hand2, 3xFLAG-hand2 EDE, 3xFLAG-hand2 P, and 3xFLAG-hand2 AA mRNA injected embryos. f, Western blot analysis comparing the levels of FLAG-tagged Hand2 protein in 4 hpf 3xFLAG-hand2, 3xFLAG-hand2 P, and 3xFLAG-hand2 AA mRNA injected embryos with different exposure times for protein detection. g, Modeling of the structure of Hand2, Hand2 Δ27, Hand2 Δ3, Hand2 EDE, Hand2 P and Hand2 AA by Alphafold2. P values in d were calculated using a one-way ANOVA multiple comparison test. The proportion of larvae matching the image shown is indicated in the top right corner of each image. Scale bar applies to all images. Ct values of qPCR data are listed in Supplementary Table 1. Source data
Extended Data Fig. 6
Extended Data Fig. 6. Deleting cloche/npas4l promotes myocardial migration in hand2 mutants.
a, In situ hybridization showing myl7 expression in 24 hpf hand2 FLD+/+, hand2 FLD/, npas4l/, and hand2 FLD/; npas4l/ sibling embryos. b, In situ hybridization showing fn1a expression in 20 hpf hand2 FLD+/+, hand2 FLD/, npas4l/, and hand2 FLD/; npas4l/ sibling embryos. To prevent overstaining hand2 FLD/ and npas4l/ embryos, we stopped staining reaction once some embryos became dark. Consequently, hand2 FLD+/+ embryos appear lighter in color. c, Normalized read count for fn1a expression in kdrl:mCherry+ endothelium from 20 hpf hand2 FLD+/? and hand2 FLD/ sibling embryos. P value in c was calculated using an unpaired Student’s t-Test. Error bars are mean ± s.e.m.; n = 3 biologically independent samples. The proportion of embryos matching the image shown is indicated in the top right corner of each image. Scale bars apply to all images.
Extended Data Fig. 7
Extended Data Fig. 7. Hand2 promotes pdgfra expression in zebrafish cardiomyocytes.
a, Maximum intensity projections of confocal images of Tg(myl7:EGFP) expression in 20 hpf hand2 FLD+/+ and hand2 FLD/ sibling embryos. b, Heat map of DEGs comparing the Tg(myl7:EGFP) + cells hand2 FLD+/? and hand2 FLD/ sibling embryos at 20 hpf. c, Gene ontology (GO) term analysis of molecular function shows enrichment of platelet-derived growth factor alpha-receptor activity genes downregulated in 20 hpf hand2 FLD/ Tg(myl7:EGFP)+ cells. d, Spearman correlation coefficient (ρ) between hand2 expression and pdgfra expression during early embryonic stages from the Zebrahub datasets. e, Double fluorescence in situ hybridization showing hand2 (green) and pdgfra (red) expression patterns illustrating their overlap in the 14.5 hpf anterior LPM. f, Violin plots showing pdgfra expression within cluster 3 (cardiac precursors). f’ UMAP representation of cells from different samples within cluster 3. g. Relative mRNA levels of pdgfra and hand2 in Tg(myl7:EGFP)+ cells from 24 hpf hand2 Δ27+/? and hand2 Δ27/ sibling embryos; error bars are mean ± s.e.m.; n = 4 biologically independent samples. P values in g were calculated using an unpaired Student’s t-Test. Scale bars apply to all images.
Extended Data Fig. 8
Extended Data Fig. 8. pdgfra is a potential effector of Hand2 during early zebrafish cardiogenesis.
a, Gene set enrichment analysis (GSEA) revealed that the PDGF signaling pathway is enriched in hand2 OE myocardial cells. b, Heat map of DEGs comparing the Tg(myl7:mCherry)+ cells in Tg(myl7:hand2-p2a-EGFP) and WT sibling embryos. c, In situ hybridization showing myl7 expression in 24 hpf hand2 FLD+/+ and hand2 FLD/ sibling embryos that were injected at the one-cell stage with a myl7:fgf17, myl7:fgfr3, myl7:fgfr4, myl7:jam2b, myl7:postnb, myl7:rhag, myl7:bmp5, or myl7:pdgfra plasmid. c’, Percentage of 24 hpf hand2 FLD/ embryos that displayed evidence of cardiac cell migration after injection at the one-cell stage with a myl7:fgf17, myl7:fgfr3, myl7:fgfr4, myl7:jam2b, myl7:postnb, myl7:rhag, myl7:bmp5, or myl7:pdgfra plasmid. All embryos are shown in dorsal views, anterior to the top. The proportion of embryos matching the image shown is indicated in the top right corner of each image. Scale bar applies to all images.
Extended Data Fig. 9
Extended Data Fig. 9. 3xFLAG-Hand2 pull down experiment.
a, FLAG IP of lysates from 14 hpf 3xFLAG-hand2 and 3xFLAG-hand2 EDE mRNA injected embryos blotted with antibodies against FLAG and β-actin. b, b’, Absolute protein intensity of Hand2, Tcf3a, and Tcf3b in 3xFLAG-Hand2 and 3xFLAG-Hand2 EDE protein complexes by mass spectrometry; error bars are mean ± s.d.; n = 3 biologically independent samples; list of the mean of absolute protein intensity shown in b’.
Extended Data Fig. 10
Extended Data Fig. 10. mESC differentiation into cardiac cells.
a, Schematic of mESC differentiation into cardiac cells. b, Relative mRNA levels of mESC (pluripotency) markers in mESC (V6.5)-derived cardiac cells; error bars are mean ± s.e.m.; n = 6 biologically independent samples. c, Relative mRNA levels of CM markers in mESC (V6.5)-derived cardiac cells; error bars are mean ± s.e.m.; n = 6 biologically independent samples. d, Relative mRNA levels of mESC (pluripotency) markers in mESC (E14)-derived cardiac cells; error bars are mean ± s.e.m.; n = 3 biologically independent samples. e, Relative mRNA levels of CM markers in mESC (E14)-derived cardiac cells; error bars are mean ± s.e.m.; n = 3 biologically independent samples. f, Relative mRNA levels of Hand2 in Hand2 OE mESC (E14)-derived cardiac cells; error bars are mean ± s.e.m.; n = 3 biologically independent samples. g, Relative mRNA levels of Pdgfra in Hand2 OE mESC (E14)-derived cardiac cells; error bars are mean ± s.e.m.; n = 3 biologically independent samples. P values were calculated using an unpaired Student’s t-Test in b-e, and using a one-way ANOVA multiple comparison test in f, g. The average mRNA level in mESCs was set at 1.0. Ct values of qPCR data are listed in Supplementary Table 1.

References

    1. Stainier, D. Y., Lee, R. K. & Fishman, M. C. Cardiovascular development in the zebrafish. I. Myocardial fate map and heart tube formation. Development119, 31–40 (1993). - PubMed
    1. Kaufman, M. H. & Navaratnam, V. Early differentiation of the heart in mouse embryos. J. Anat.133, 235–246 (1981). - PMC - PubMed
    1. Prummel, K. D., Nieuwenhuize, S. & Mosimann, C. The lateral plate mesoderm. Development147, dev175059 (2020). - PMC - PubMed
    1. Garg, V. et al. GATA4 mutations cause human congenital heart defects and reveal an interaction with TBX5. Nature424, 443–447 (2003). - PubMed
    1. Jiang, J.-Q. et al. Prevalence and spectrum of GATA5 mutations associated with congenital heart disease. Int. J. Cardiol.165, 570–573 (2013). - PubMed

MeSH terms

Substances